| Param | Original file | Final file |
|---|---|---|
| Filename | modeM0/AS1A07_147T01_9000003722_25538cztM0_level2.evt | modeM0/AS1A07_147T01_9000003722_25538cztM0_level2_quad_clean.evt |
| Size (bytes) | 509,529,600 | 96,448,320 |
| Size | 485.9 MB | 92.0 MB |
| Events in quadrant A | 3,363,137 | 627,524 |
| Events in quadrant B | 3,396,342 | 636,652 |
| Events in quadrant C | 3,375,253 | 595,311 |
| Events in quadrant D | 4,830,839 | 583,632 |
| Mode M0 | |||
|---|---|---|---|
| Quadrant | BADHDUFLAG | Total packets | Discarded packets |
| A | 0 | 14260 | 0 |
| B | 0 | 14270 | 0 |
| C | 0 | 14297 | 0 |
| D | 0 | 18863 | 0 |
| Mode M9 | |||
|---|---|---|---|
| Quadrant | BADHDUFLAG | Total packets | Discarded packets |
| A | 0 | 2 | 0 |
| B | 0 | 2 | 0 |
| C | 0 | 2 | 0 |
| D | 0 | 2 | 0 |
| Quadrant | Total seconds | Saturated seconds | Saturation percentage |
|---|---|---|---|
| A | 6853 | 171 | 2.495258% |
| B | 6854 | 200 | 2.918004% |
| C | 6854 | 215 | 3.136854% |
| D | 6854 | 306 | 4.464546% |
Noise dominated data is calculated using 1-second bins in cleaned event files. If a bin has >2000 counts, and if more than 50% of those come from <1% of pixels, then it is considered to be noise-dominated and hence unusable.
| Quadrant | # 1 sec bins | Bins with >0 counts | Bins with >2000 counts | High rate bins dominated by noise | Noise dominated (total time) | Noise dominated (detector-on time) | Marked lightcurve |
|---|---|---|---|---|---|---|---|
| A | 7053 | 6854 | 0 | 0 | 0.00% | 0.00% | 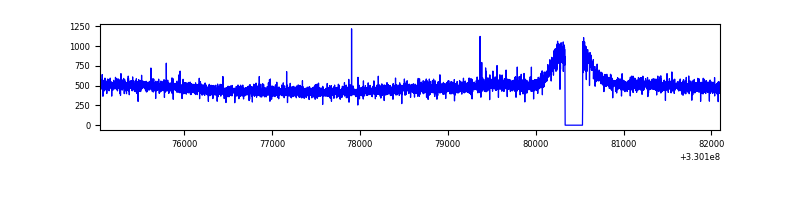 |
| B | 7054 | 6855 | 0 | 0 | 0.00% | 0.00% | 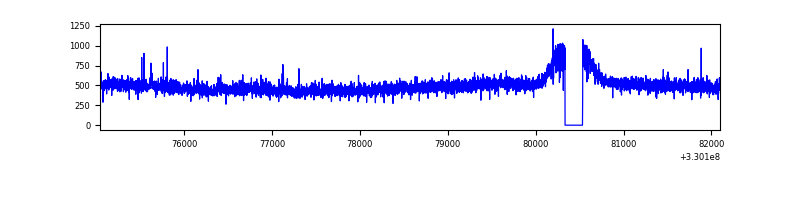 |
| C | 7054 | 6855 | 0 | 0 | 0.00% | 0.00% | 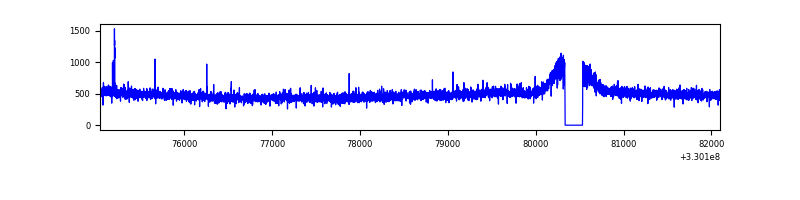 |
| D | 7054 | 6855 | 154 | 154 | 2.18% | 2.25% | 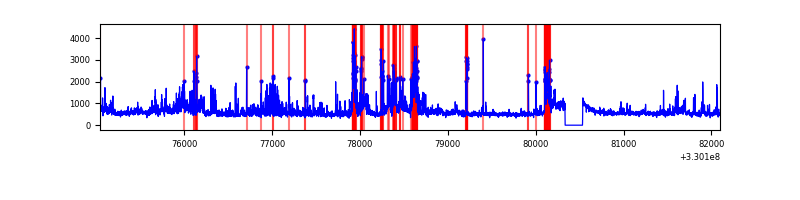 |
Top three noisy pixels from each quadrant. If the there are fewer than three noisy pixels in the level2.evt file, extra rows are filled as -1
| Pixel properties | Quadrant properties | ||||||
|---|---|---|---|---|---|---|---|
| Quadrant | DetID | PixID | Counts | Sigma | Mean | Median | Sigma |
| A | 13 | 254 | 10669 | 55.5 | 870 | 850 | 176.9 |
| A | 3 | 137 | 8175 | 41.4 | 870 | 850 | 176.9 |
| A | 0 | 226 | 7286 | 36.38 | 870 | 850 | 176.9 |
| B | 12 | 111 | 20524 | 118.07 | 857 | 834 | 166.8 |
| B | 11 | 111 | 18889 | 108.27 | 857 | 834 | 166.8 |
| B | 14 | 111 | 16900 | 96.34 | 857 | 834 | 166.8 |
| C | 14 | 238 | 131329 | 661.82 | 826 | 829 | 197.2 |
| C | 2 | 16 | 20205 | 98.26 | 826 | 829 | 197.2 |
| C | 3 | 233 | 6013 | 26.29 | 826 | 829 | 197.2 |
| D | 1 | 52 | 1311886 | 5908.58 | 830 | 813 | 221.9 |
| D | 8 | 195 | 242336 | 1088.46 | 830 | 813 | 221.9 |
| D | 2 | 244 | 89681 | 400.5 | 830 | 813 | 221.9 |
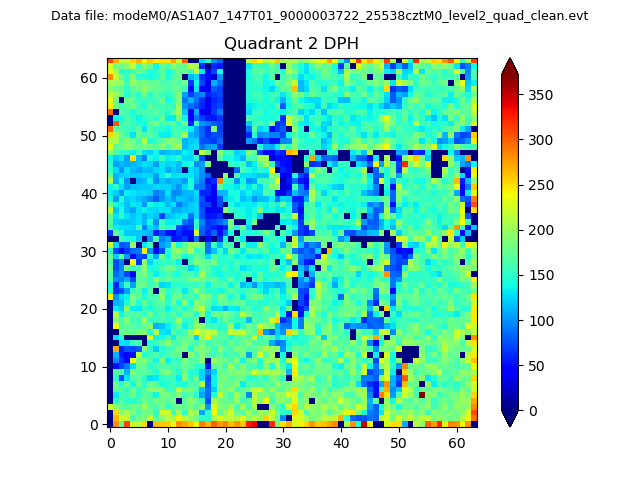
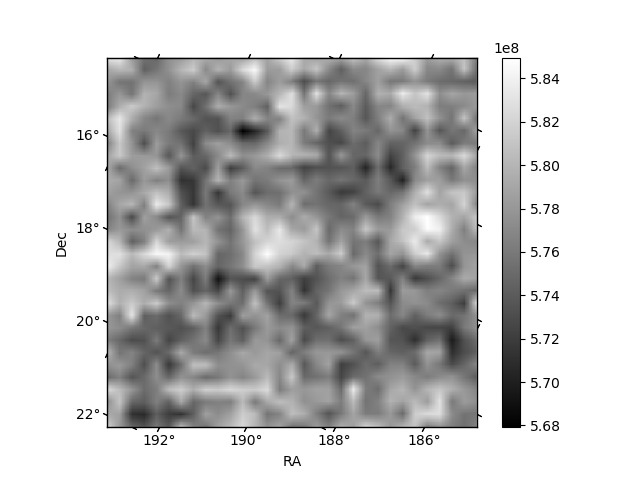
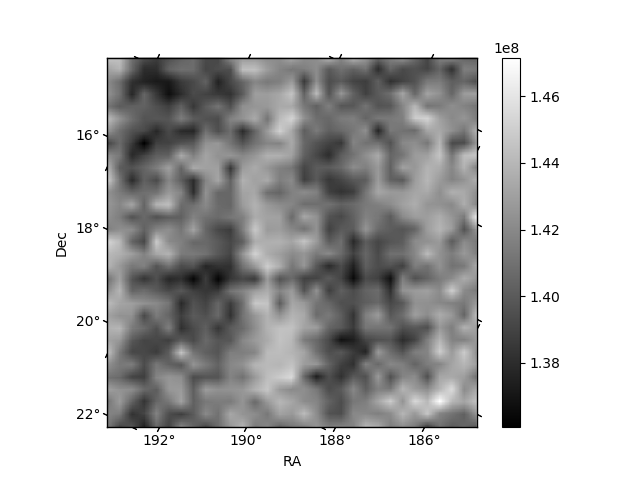
Histogram calculated using DETX and DETY for each event in the final _common_clean file
| Quadrant A | 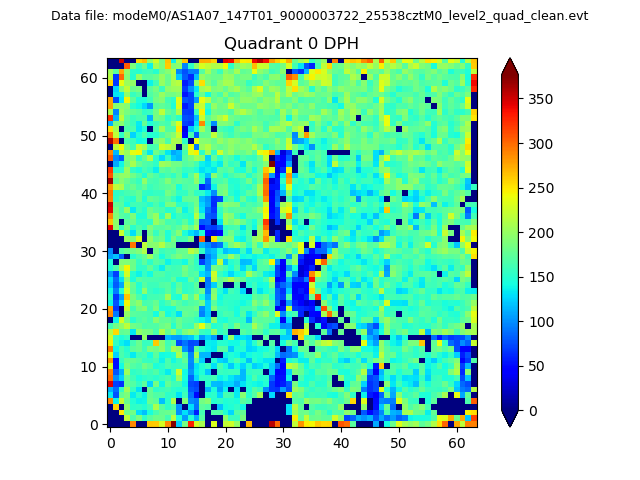 |
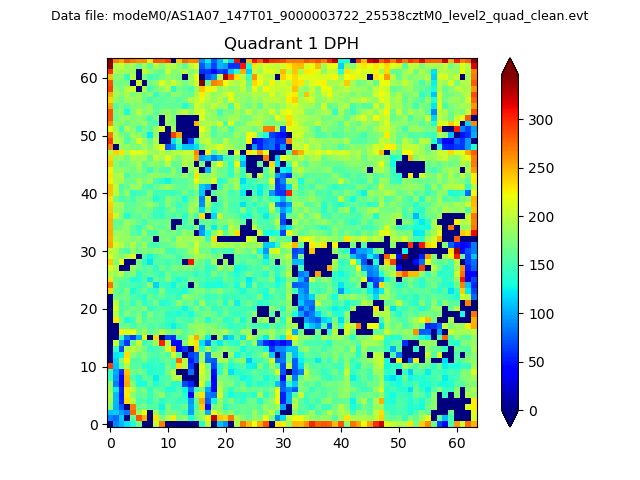 |
Quadrant B |
|---|---|---|---|
| Quadrant D | 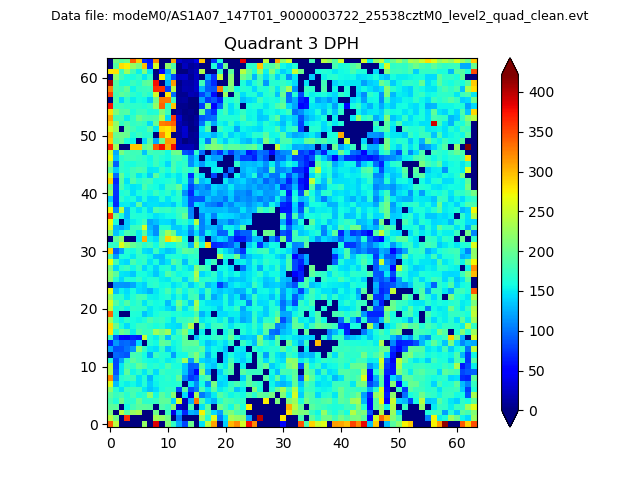 |
 |
Quadrant C |
| Plot type | Count rate plots | Images |
|---|---|---|
| Comparison with Poisson distribution Blue bars denote a histogram of data divided into 1 sec bins. Red curve is a Poisson curve with rate = median count rate of data. |
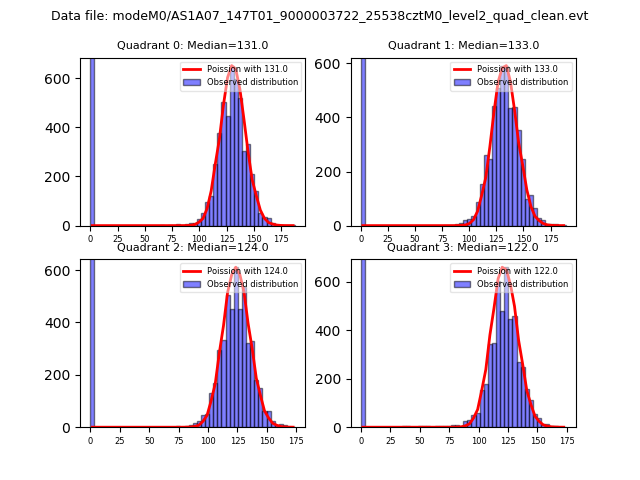 |
 |
| Quadrant-wise count rates Data is divided into 100 sec bins |
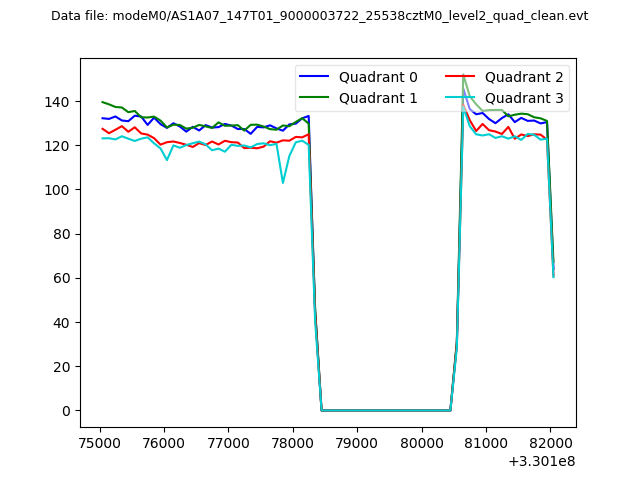 |
|
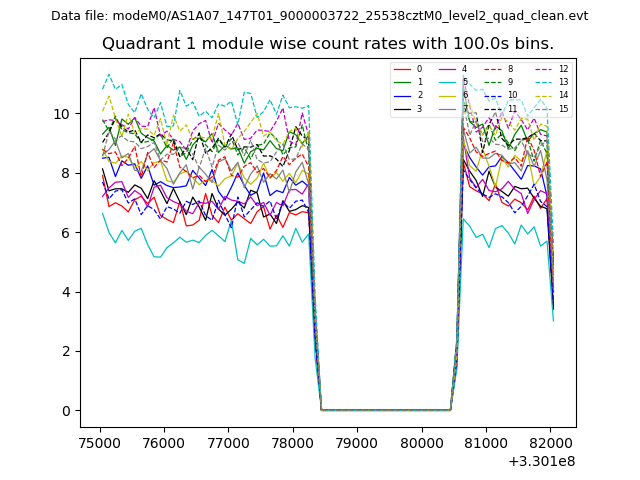
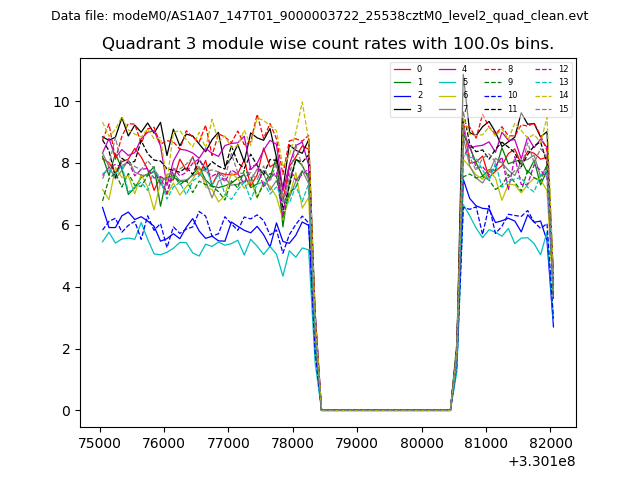
| Module-wise count rates for Quadrant A Data is divided into 100 sec bins |
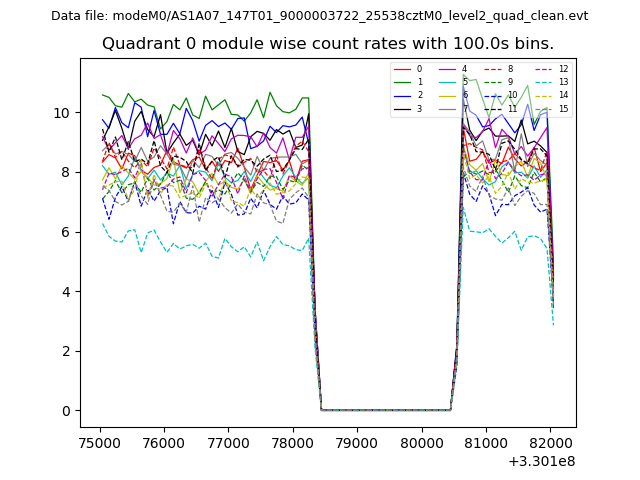 |
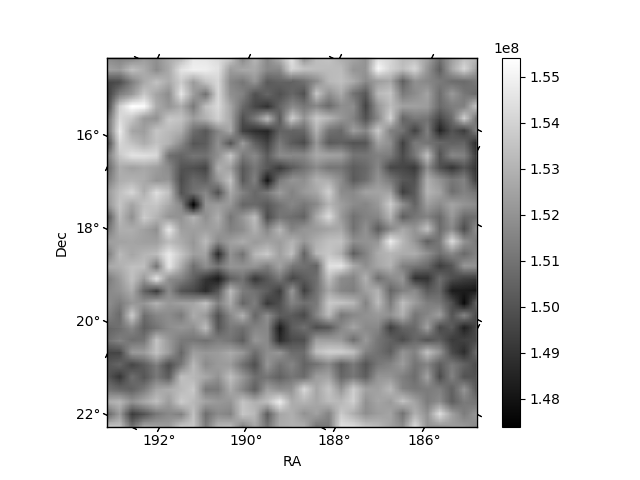 |
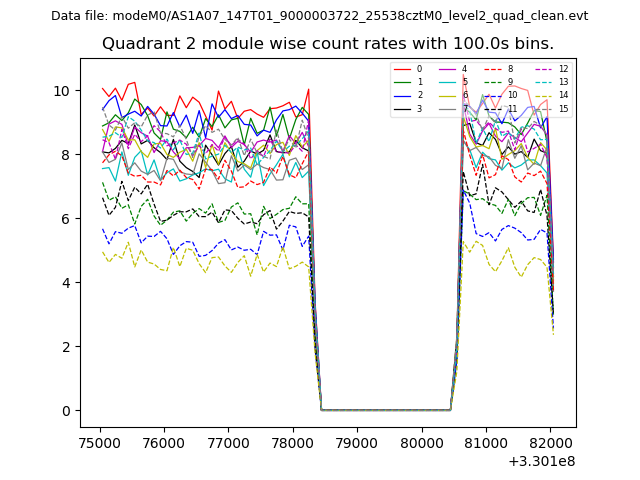
| Module-wise count rates for Quadrant B Data is divided into 100 sec bins |
 |
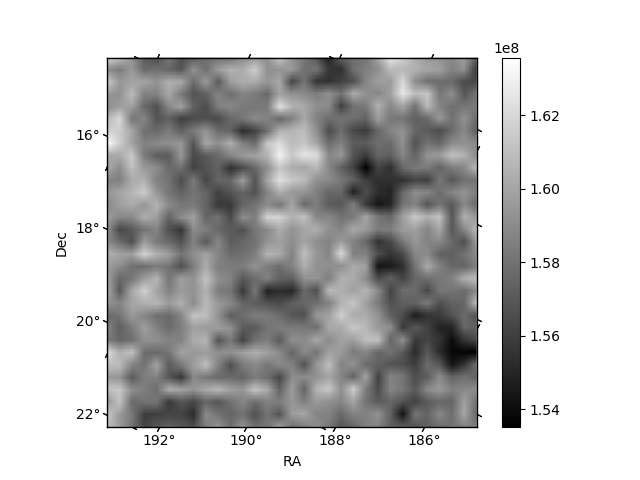 |
| Module-wise count rates for Quadrant C Data is divided into 100 sec bins |
 |
 |
| Module-wise count rates for Quadrant D Data is divided into 100 sec bins |
 |
 |
| Parameter | Plot |
|---|---|
| CZT HV Monitor | 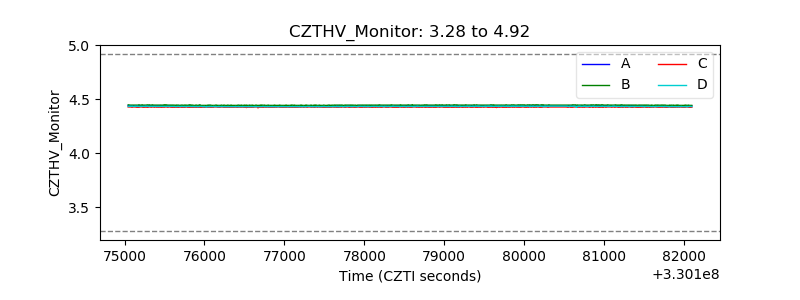 |
| D_VDD | 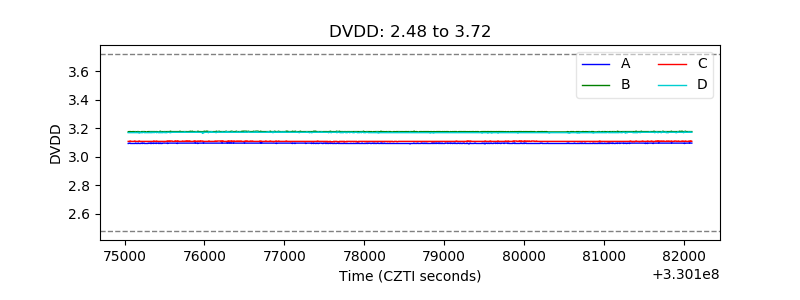 |
| Temperature 1 | 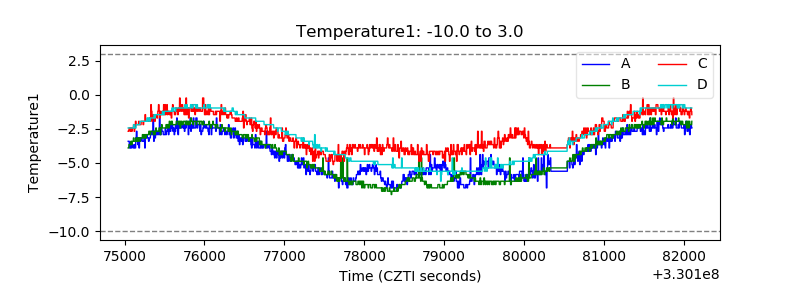 |
| Veto HV Monitor | 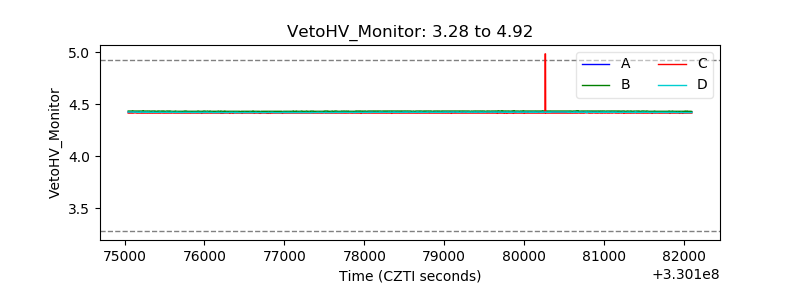 |
| Veto LLD | 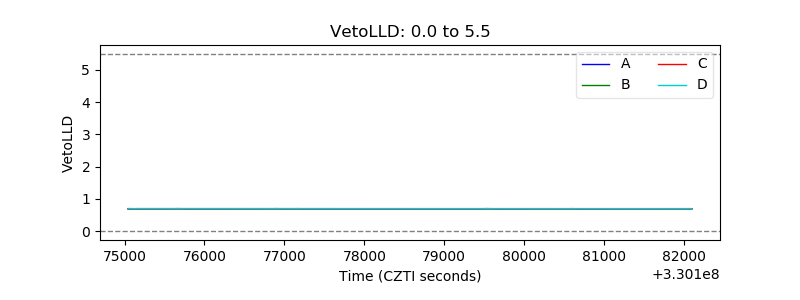 |
| Alpha Counter | 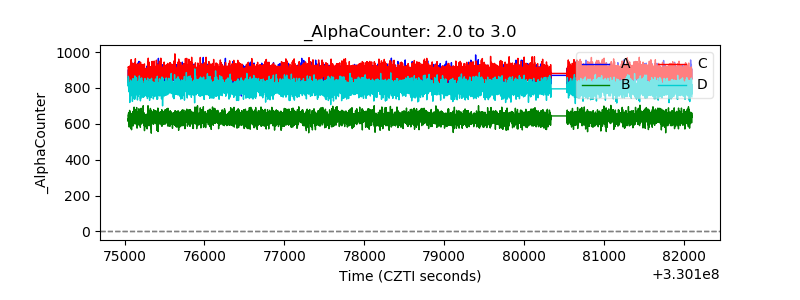 |
| _CPM_Rate | 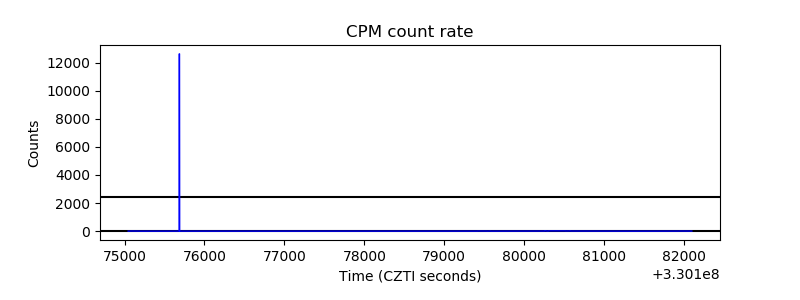 |
| CZT Counter |  |
| +2.5 Volts monitor |  |
| +5 Volts monitor |  |
| _ROLL_ROT | 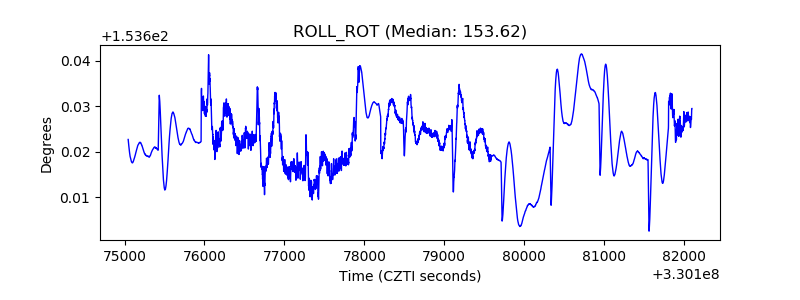 |
| _Roll_DEC | 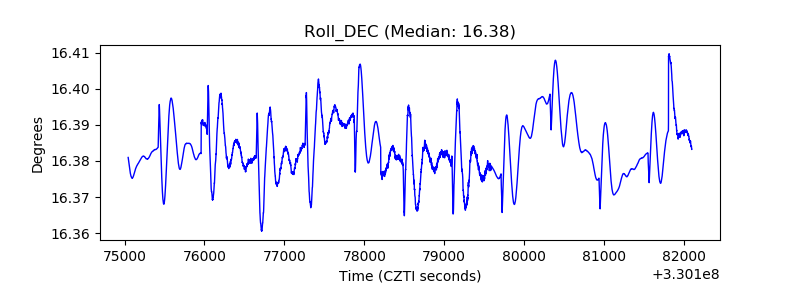 |
| _Roll_RA |  |
| Veto Counter | 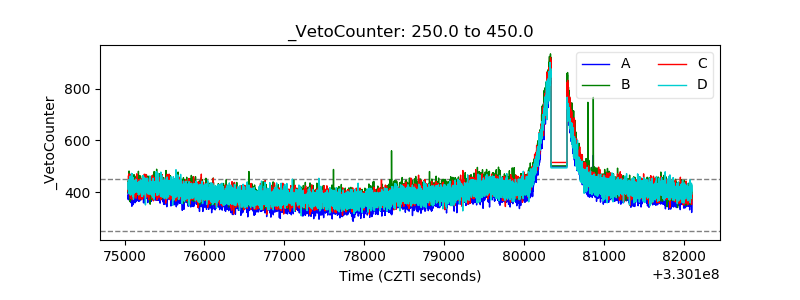 |