| Param | Original file | Final file |
|---|---|---|
| Filename | modeM0/AS1A07_147T01_9000003722_25539cztM0_level2.evt | modeM0/AS1A07_147T01_9000003722_25539cztM0_level2_quad_clean.evt |
| Size (bytes) | 518,572,800 | 99,918,720 |
| Size | 494.5 MB | 95.3 MB |
| Events in quadrant A | 3,488,242 | 647,100 |
| Events in quadrant B | 3,587,242 | 653,771 |
| Events in quadrant C | 3,494,621 | 615,087 |
| Events in quadrant D | 4,643,924 | 606,469 |
| Mode M0 | |||
|---|---|---|---|
| Quadrant | BADHDUFLAG | Total packets | Discarded packets |
| A | 0 | 14960 | 0 |
| B | 0 | 15126 | 0 |
| C | 0 | 14923 | 0 |
| D | 0 | 18331 | 0 |
| Mode M9 | |||
|---|---|---|---|
| Quadrant | BADHDUFLAG | Total packets | Discarded packets |
| A | 0 | 4 | 0 |
| B | 0 | 4 | 0 |
| C | 0 | 4 | 0 |
| D | 0 | 4 | 0 |
| Quadrant | Total seconds | Saturated seconds | Saturation percentage |
|---|---|---|---|
| A | 7233 | 99 | 1.368727% |
| B | 7234 | 119 | 1.645010% |
| C | 7234 | 131 | 1.810893% |
| D | 7233 | 202 | 2.792755% |
Noise dominated data is calculated using 1-second bins in cleaned event files. If a bin has >2000 counts, and if more than 50% of those come from <1% of pixels, then it is considered to be noise-dominated and hence unusable.
| Quadrant | # 1 sec bins | Bins with >0 counts | Bins with >2000 counts | High rate bins dominated by noise | Noise dominated (total time) | Noise dominated (detector-on time) | Marked lightcurve |
|---|---|---|---|---|---|---|---|
| A | 7583 | 7234 | 0 | 0 | 0.00% | 0.00% | 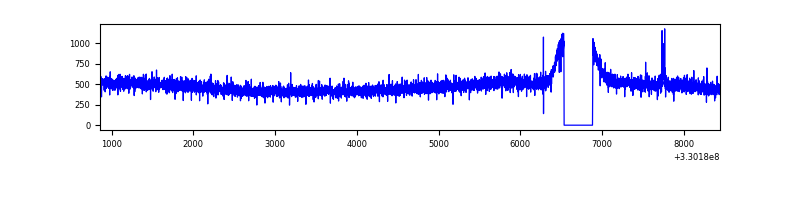 |
| B | 7584 | 7235 | 0 | 0 | 0.00% | 0.00% | 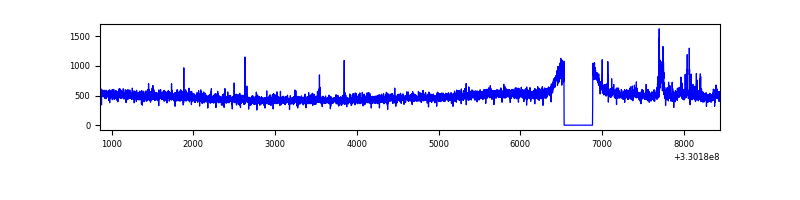 |
| C | 7584 | 7235 | 0 | 0 | 0.00% | 0.00% | 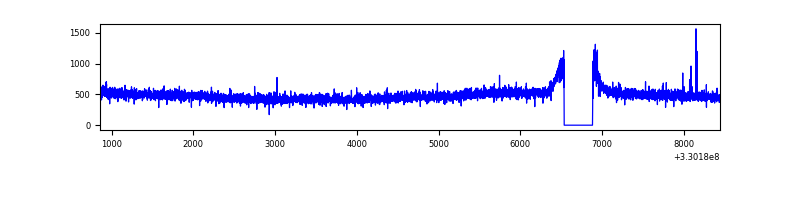 |
| D | 7583 | 7234 | 148 | 148 | 1.95% | 2.05% | 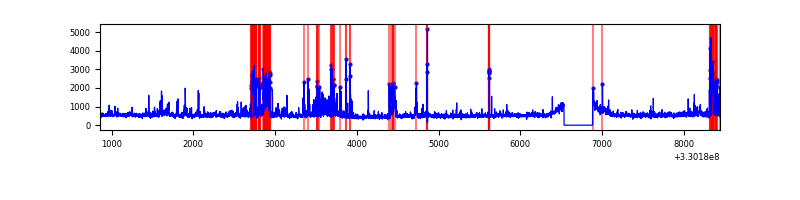 |
Top three noisy pixels from each quadrant. If the there are fewer than three noisy pixels in the level2.evt file, extra rows are filled as -1
| Pixel properties | Quadrant properties | ||||||
|---|---|---|---|---|---|---|---|
| Quadrant | DetID | PixID | Counts | Sigma | Mean | Median | Sigma |
| A | 13 | 254 | 11504 | 58.3 | 901 | 883 | 182.2 |
| A | 4 | 2 | 10368 | 52.06 | 901 | 883 | 182.2 |
| A | 3 | 137 | 8378 | 41.14 | 901 | 883 | 182.2 |
| B | 15 | 33 | 37366 | 212.0 | 891 | 867 | 172.2 |
| B | 12 | 111 | 21247 | 118.38 | 891 | 867 | 172.2 |
| B | 0 | 229 | 21107 | 117.56 | 891 | 867 | 172.2 |
| C | 14 | 238 | 135880 | 662.55 | 857 | 861 | 203.8 |
| C | 2 | 16 | 12123 | 55.26 | 857 | 861 | 203.8 |
| C | 3 | 233 | 9126 | 40.55 | 857 | 861 | 203.8 |
| D | 1 | 52 | 1032794 | 4479.83 | 863 | 845 | 230.4 |
| D | 8 | 195 | 302818 | 1310.9 | 863 | 845 | 230.4 |
| D | 2 | 234 | 29614 | 124.89 | 863 | 845 | 230.4 |
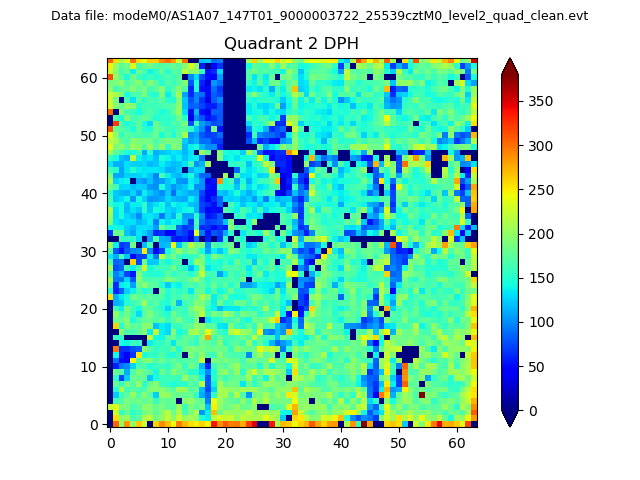
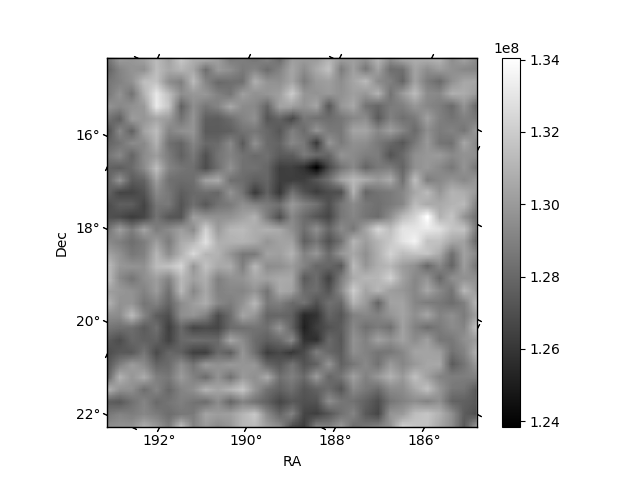
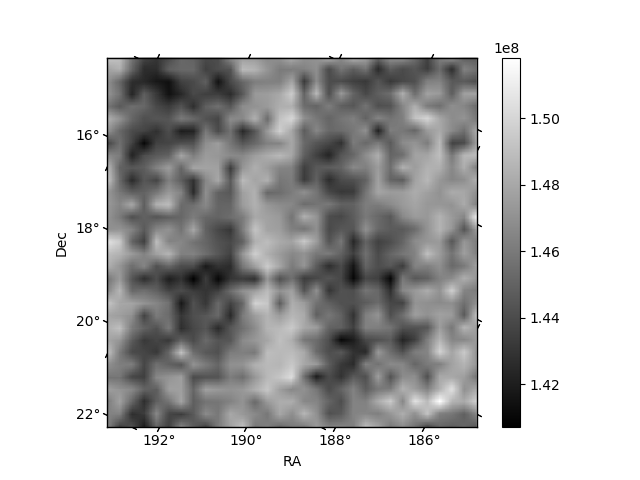
Histogram calculated using DETX and DETY for each event in the final _common_clean file
| Quadrant A | 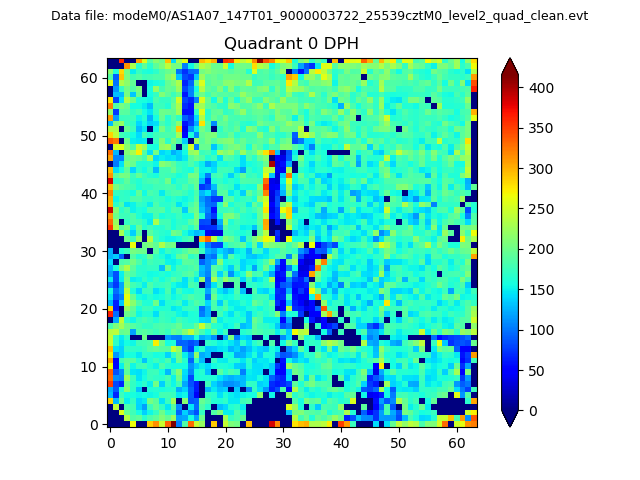 |
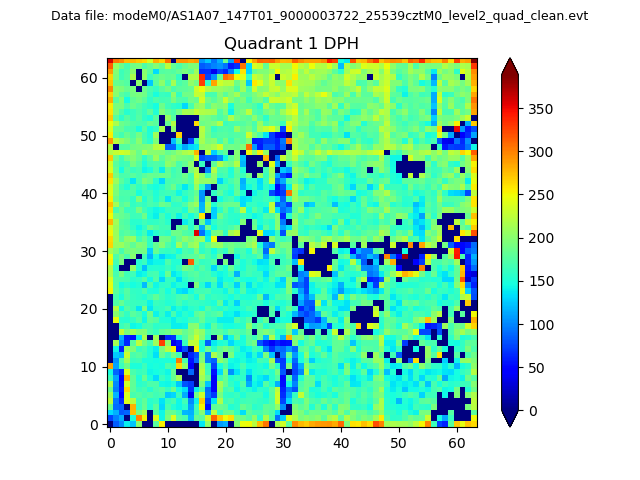 |
Quadrant B |
|---|---|---|---|
| Quadrant D | 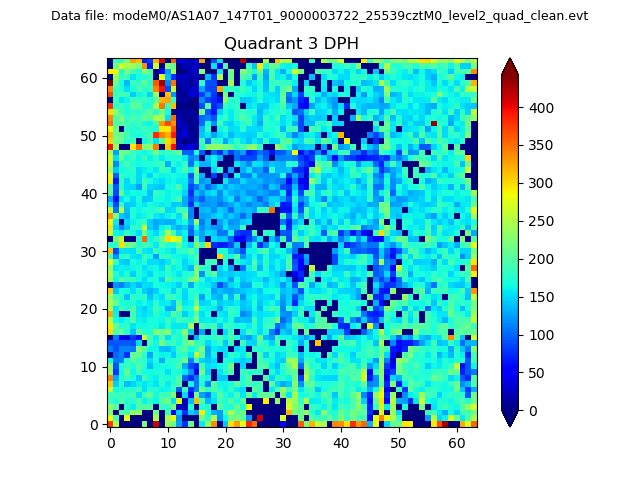 |
 |
Quadrant C |
| Plot type | Count rate plots | Images |
|---|---|---|
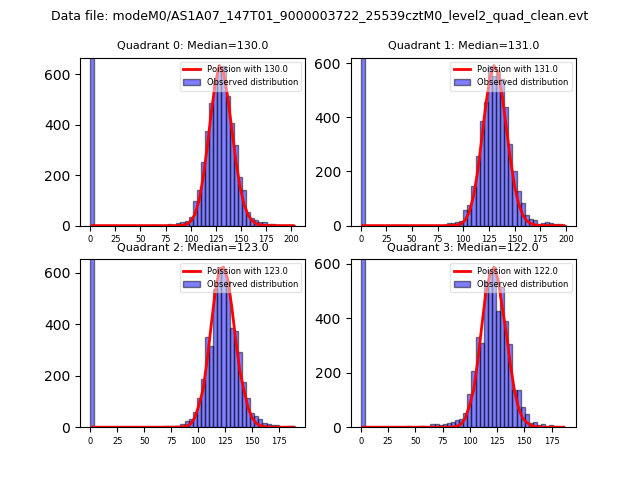
| Comparison with Poisson distribution Blue bars denote a histogram of data divided into 1 sec bins. Red curve is a Poisson curve with rate = median count rate of data. |
 |
 |
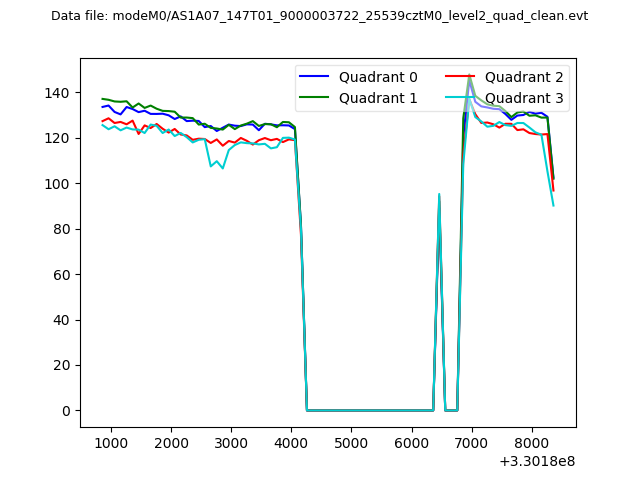
| Quadrant-wise count rates Data is divided into 100 sec bins |
 |
|
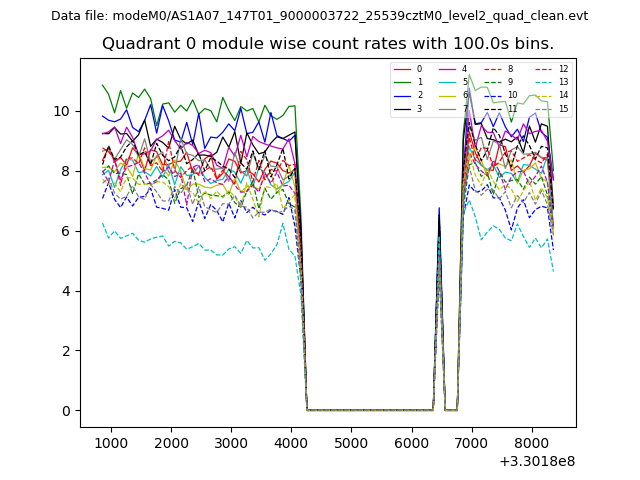
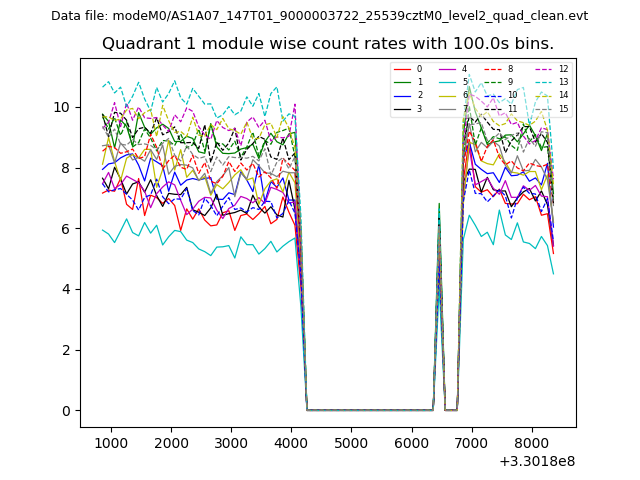
| Module-wise count rates for Quadrant A Data is divided into 100 sec bins |
 |
 |
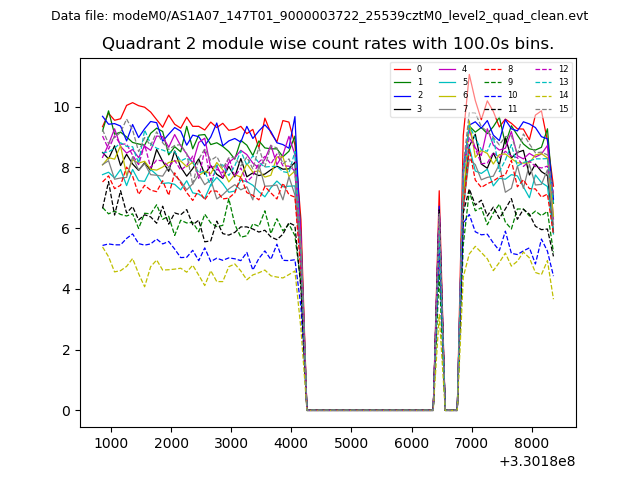
| Module-wise count rates for Quadrant B Data is divided into 100 sec bins |
 |
 |
| Module-wise count rates for Quadrant C Data is divided into 100 sec bins |
 |
 |
| Module-wise count rates for Quadrant D Data is divided into 100 sec bins |
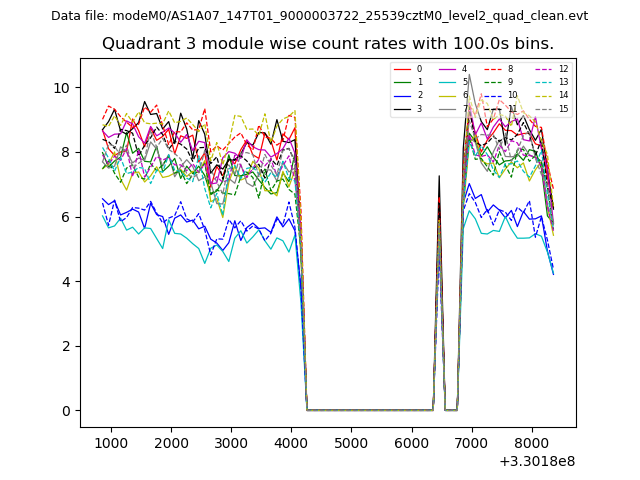 |
 |
| Parameter | Plot |
|---|---|
| CZT HV Monitor | 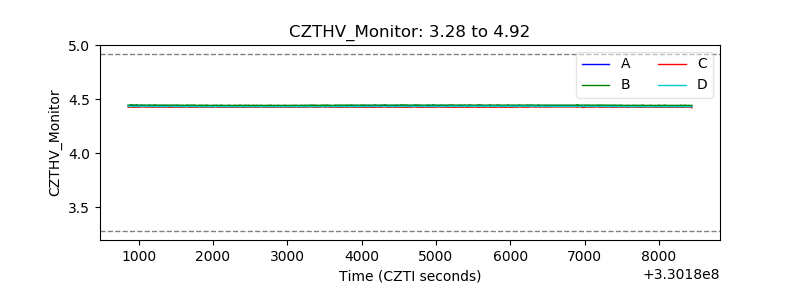 |
| D_VDD | 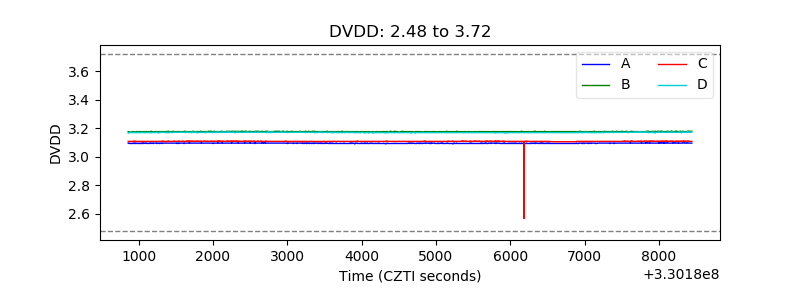 |
| Temperature 1 | 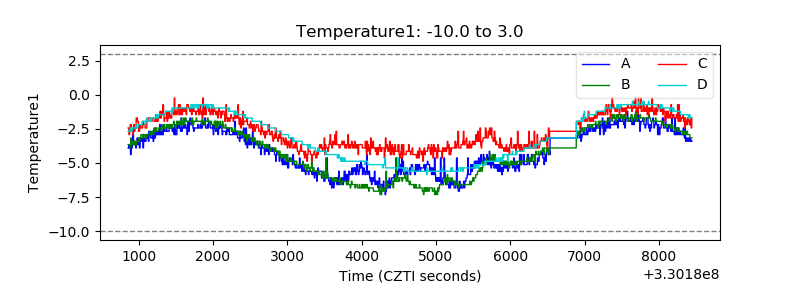 |
| Veto HV Monitor | 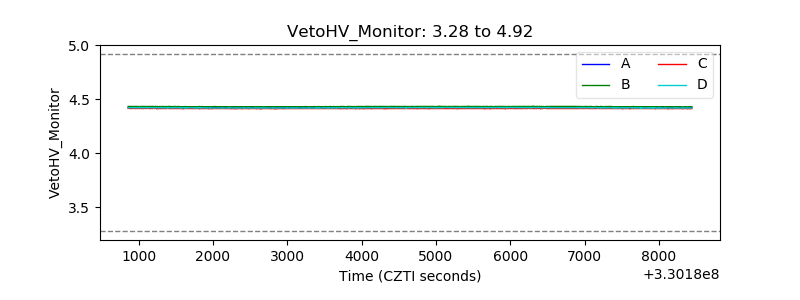 |
| Veto LLD | 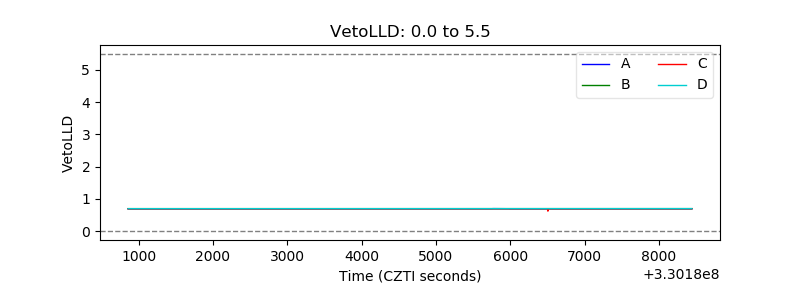 |
| Alpha Counter | 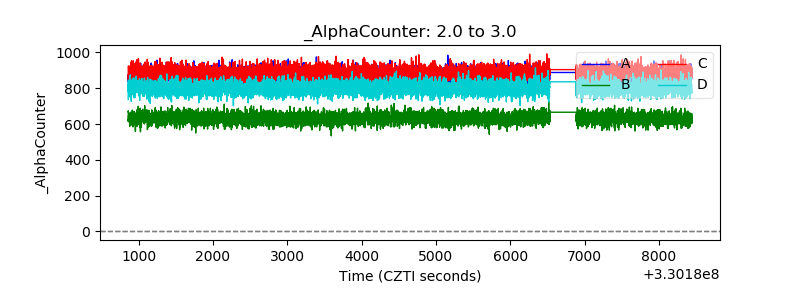 |
| _CPM_Rate | 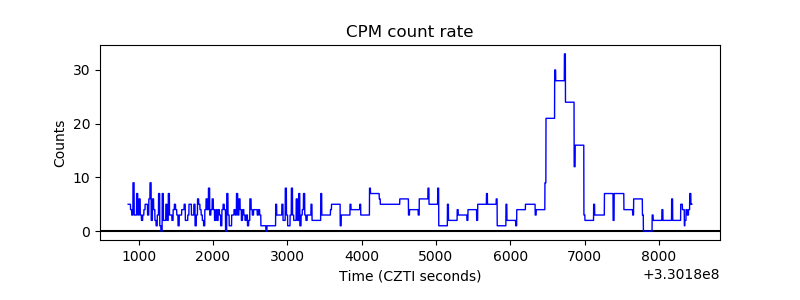 |
| CZT Counter | 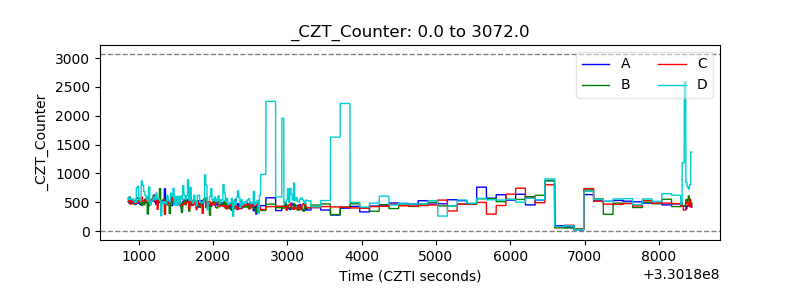 |
| +2.5 Volts monitor |  |
| +5 Volts monitor |  |
| _ROLL_ROT | 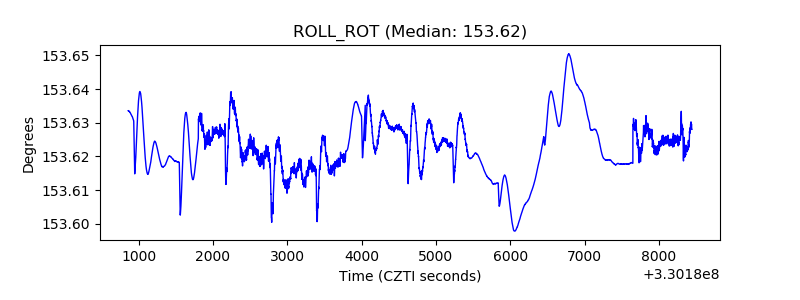 |
| _Roll_DEC | 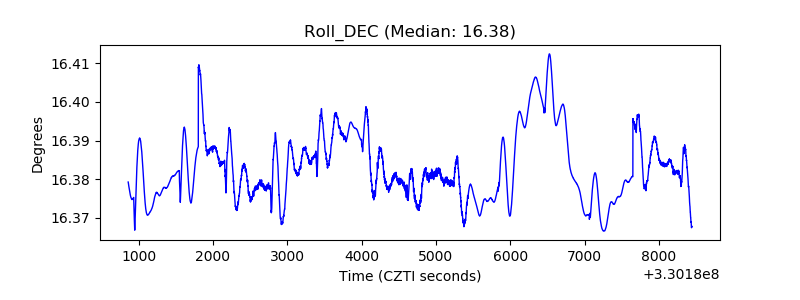 |
| _Roll_RA | 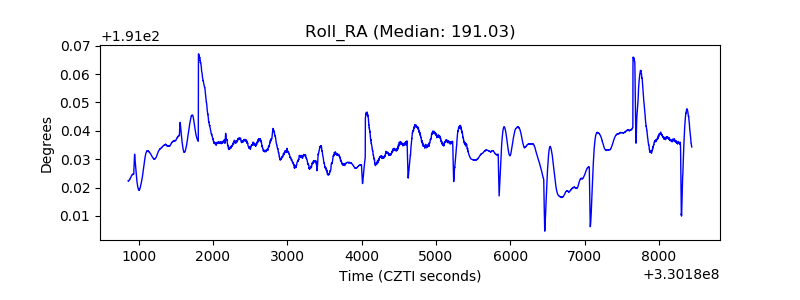 |
| Veto Counter | 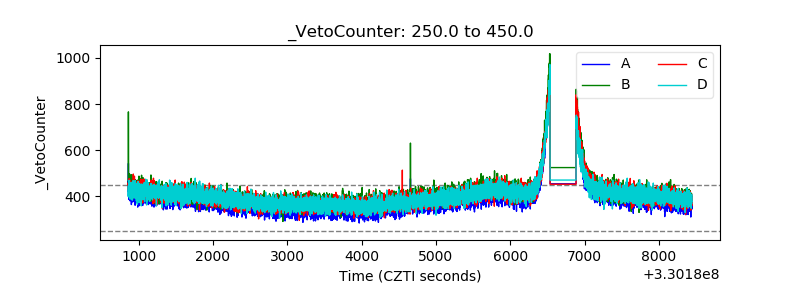 |