| Param | Original file | Final file |
|---|---|---|
| Filename | modeM0/AS1A07_147T01_9000003722_25542cztM0_level2.evt | modeM0/AS1A07_147T01_9000003722_25542cztM0_level2_quad_clean.evt |
| Size (bytes) | 528,442,560 | 101,430,720 |
| Size | 504.0 MB | 96.7 MB |
| Events in quadrant A | 3,520,389 | 659,978 |
| Events in quadrant B | 3,721,577 | 662,684 |
| Events in quadrant C | 3,622,774 | 624,367 |
| Events in quadrant D | 4,643,356 | 616,119 |
| Mode M0 | |||
|---|---|---|---|
| Quadrant | BADHDUFLAG | Total packets | Discarded packets |
| A | 0 | 15203 | 0 |
| B | 0 | 15623 | 0 |
| C | 0 | 15409 | 0 |
| D | 0 | 18426 | 0 |
| Mode M9 | |||
|---|---|---|---|
| Quadrant | BADHDUFLAG | Total packets | Discarded packets |
| A | 0 | 5 | 0 |
| B | 0 | 6 | 0 |
| C | 0 | 6 | 0 |
| D | 0 | 6 | 0 |
| Quadrant | Total seconds | Saturated seconds | Saturation percentage |
|---|---|---|---|
| A | 7304 | 94 | 1.286966% |
| B | 7304 | 120 | 1.642935% |
| C | 7304 | 153 | 2.094743% |
| D | 7304 | 165 | 2.259036% |
Noise dominated data is calculated using 1-second bins in cleaned event files. If a bin has >2000 counts, and if more than 50% of those come from <1% of pixels, then it is considered to be noise-dominated and hence unusable.
| Quadrant | # 1 sec bins | Bins with >0 counts | Bins with >2000 counts | High rate bins dominated by noise | Noise dominated (total time) | Noise dominated (detector-on time) | Marked lightcurve |
|---|---|---|---|---|---|---|---|
| A | 7819 | 7305 | 0 | 0 | 0.00% | 0.00% | 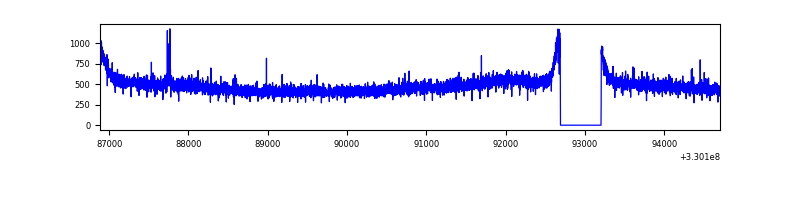 |
| B | 7819 | 7305 | 16 | 16 | 0.20% | 0.22% | 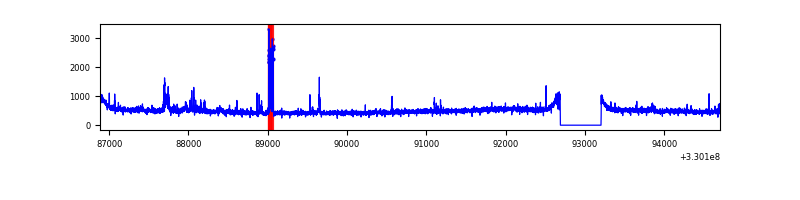 |
| C | 7819 | 7305 | 8 | 8 | 0.10% | 0.11% | 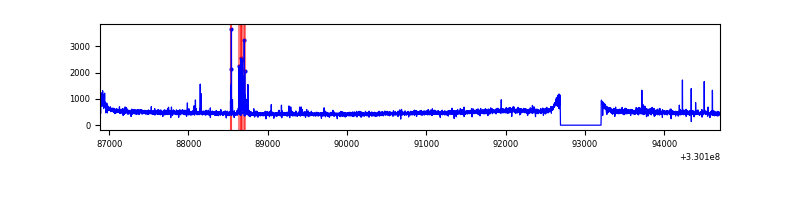 |
| D | 7819 | 7305 | 109 | 109 | 1.39% | 1.49% | 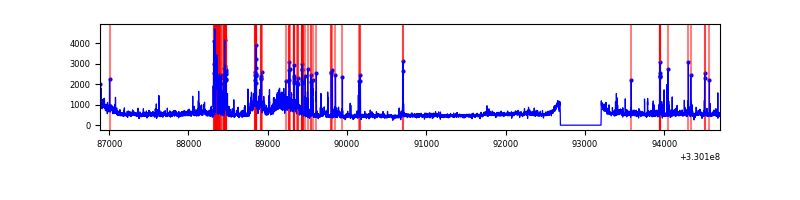 |
Top three noisy pixels from each quadrant. If the there are fewer than three noisy pixels in the level2.evt file, extra rows are filled as -1
| Pixel properties | Quadrant properties | ||||||
|---|---|---|---|---|---|---|---|
| Quadrant | DetID | PixID | Counts | Sigma | Mean | Median | Sigma |
| A | 13 | 254 | 11400 | 57.34 | 910 | 890 | 183.3 |
| A | 4 | 2 | 11048 | 55.42 | 910 | 890 | 183.3 |
| A | 3 | 137 | 8653 | 42.35 | 910 | 890 | 183.3 |
| B | 0 | 229 | 113456 | 650.25 | 899 | 876 | 173.1 |
| B | 15 | 33 | 34104 | 191.92 | 899 | 876 | 173.1 |
| B | 12 | 111 | 21407 | 118.58 | 899 | 876 | 173.1 |
| C | 14 | 238 | 137297 | 662.43 | 866 | 871 | 205.9 |
| C | 2 | 16 | 92103 | 442.99 | 866 | 871 | 205.9 |
| C | 3 | 233 | 22485 | 104.95 | 866 | 871 | 205.9 |
| D | 1 | 52 | 710532 | 3033.31 | 872 | 854 | 234.0 |
| D | 8 | 195 | 585302 | 2498.05 | 872 | 854 | 234.0 |
| D | 2 | 234 | 31072 | 129.16 | 872 | 854 | 234.0 |
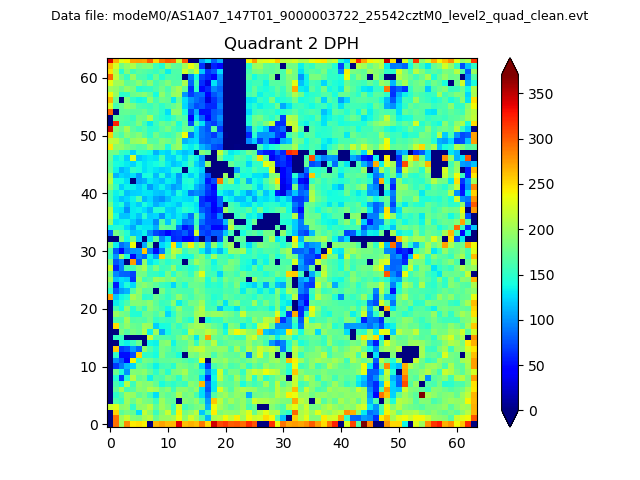
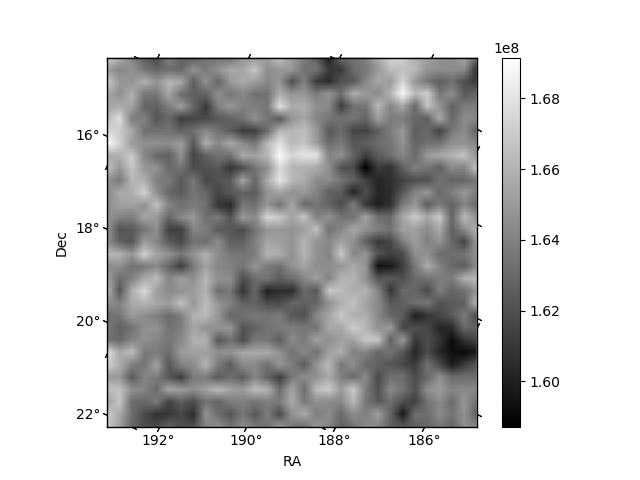
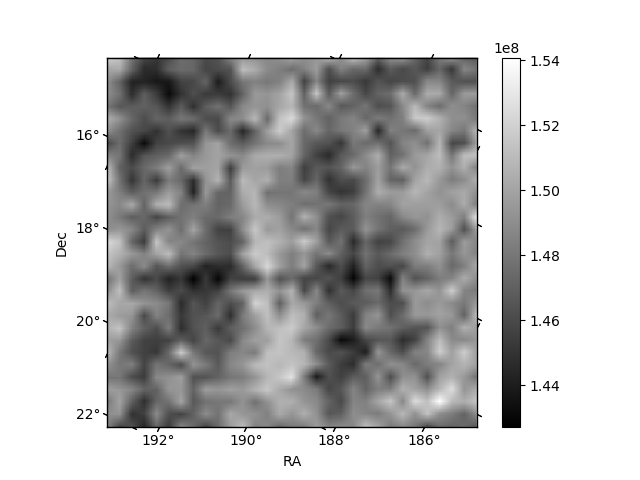
Histogram calculated using DETX and DETY for each event in the final _common_clean file
| Quadrant A | 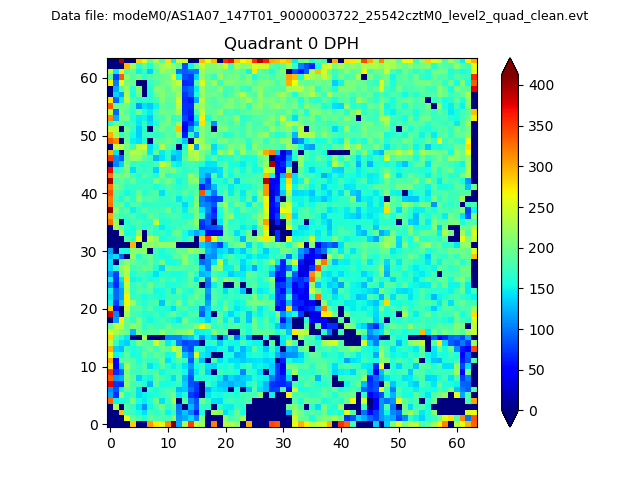 |
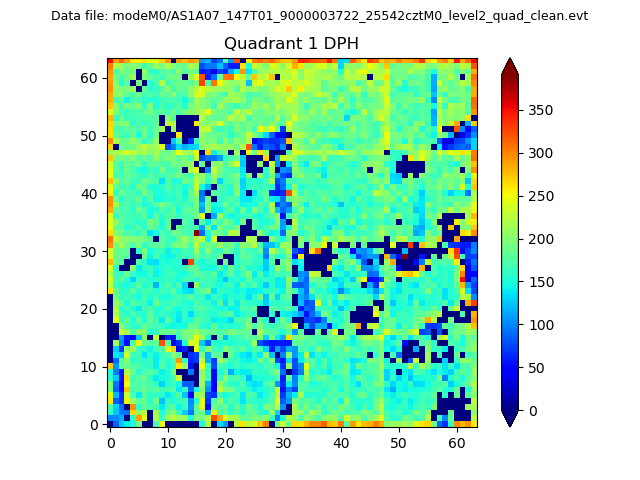 |
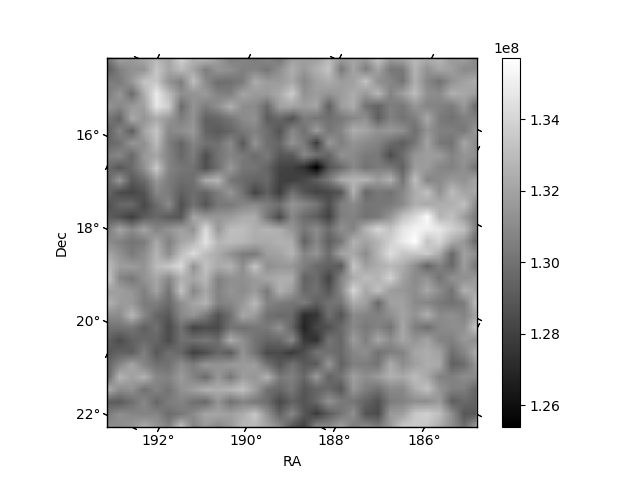
Quadrant B |
|---|---|---|---|
| Quadrant D | 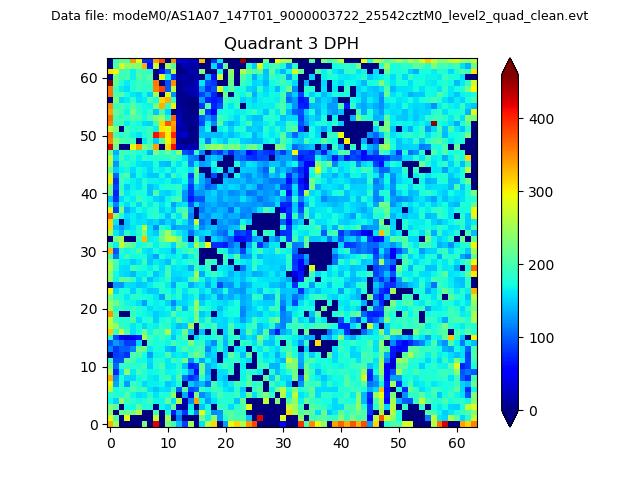 |
 |
Quadrant C |
| Plot type | Count rate plots | Images |
|---|---|---|
| Comparison with Poisson distribution Blue bars denote a histogram of data divided into 1 sec bins. Red curve is a Poisson curve with rate = median count rate of data. |
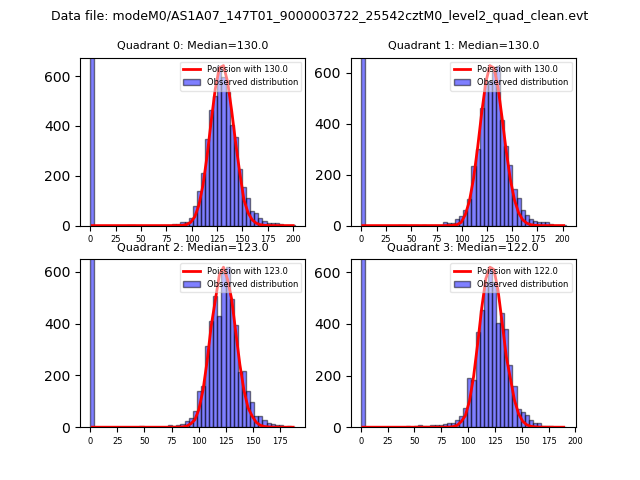 |
 |
| Quadrant-wise count rates Data is divided into 100 sec bins |
 |
|
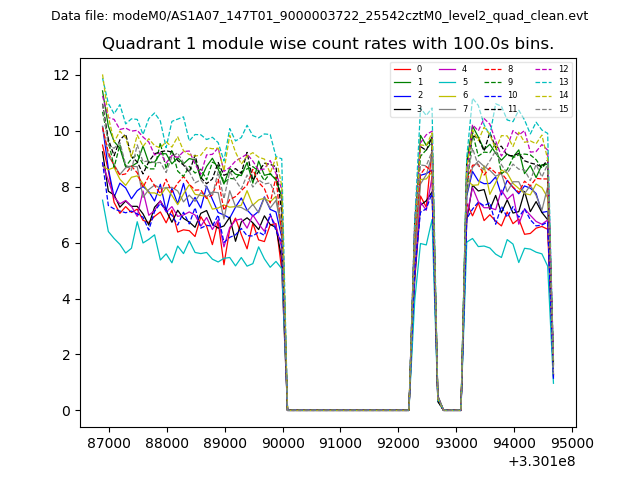
| Module-wise count rates for Quadrant A Data is divided into 100 sec bins |
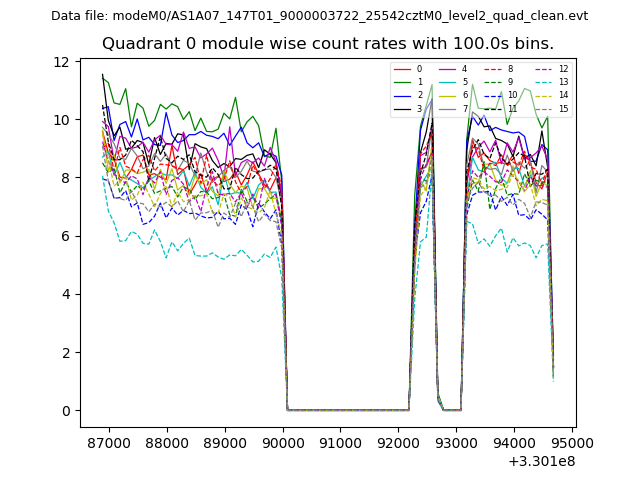 |
 |
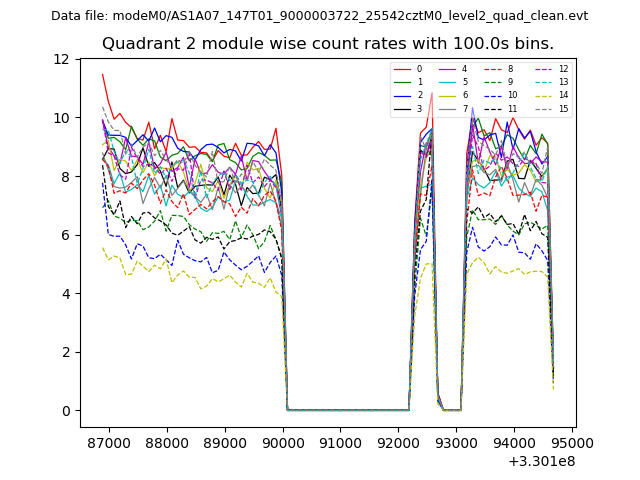
| Module-wise count rates for Quadrant B Data is divided into 100 sec bins |
 |
 |
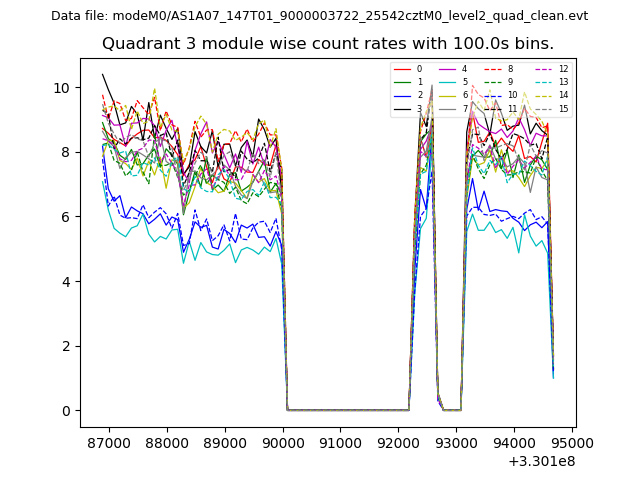
| Module-wise count rates for Quadrant C Data is divided into 100 sec bins |
 |
 |
| Module-wise count rates for Quadrant D Data is divided into 100 sec bins |
 |
 |
| Parameter | Plot |
|---|---|
| CZT HV Monitor | 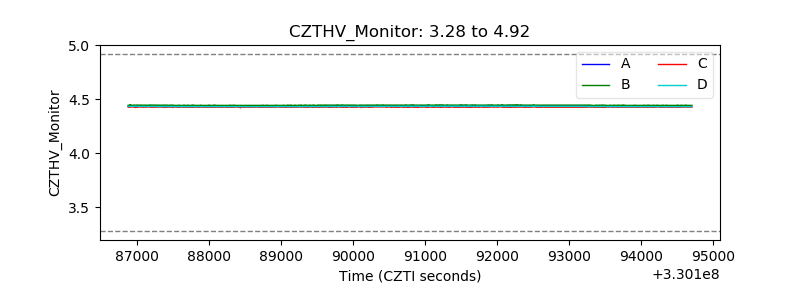 |
| D_VDD | 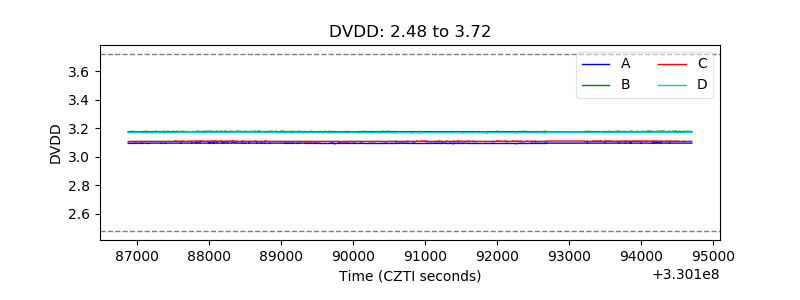 |
| Temperature 1 | 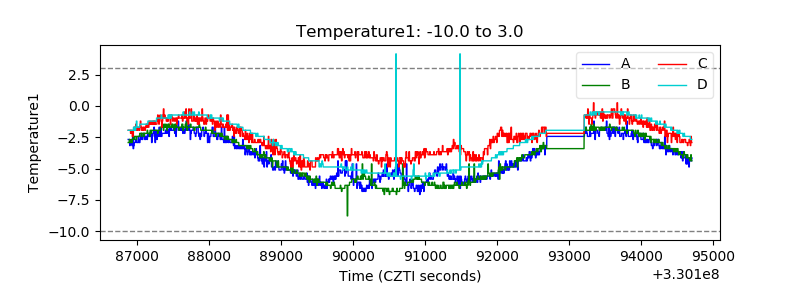 |
| Veto HV Monitor | 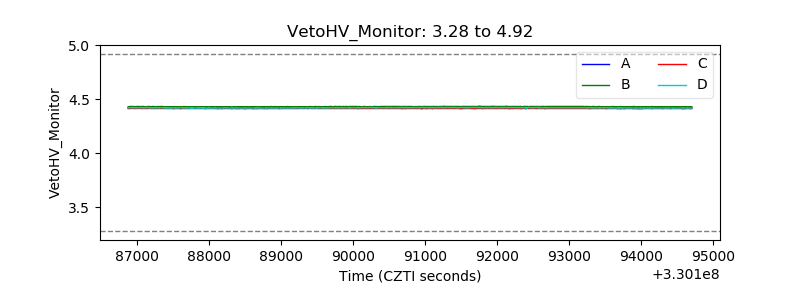 |
| Veto LLD | 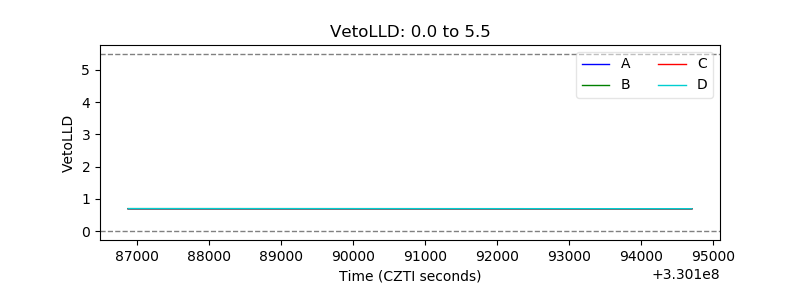 |
| Alpha Counter |  |
| _CPM_Rate |  |
| CZT Counter | 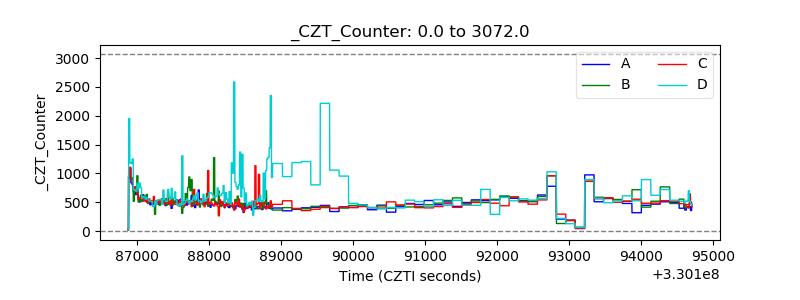 |
| +2.5 Volts monitor |  |
| +5 Volts monitor |  |
| _ROLL_ROT | 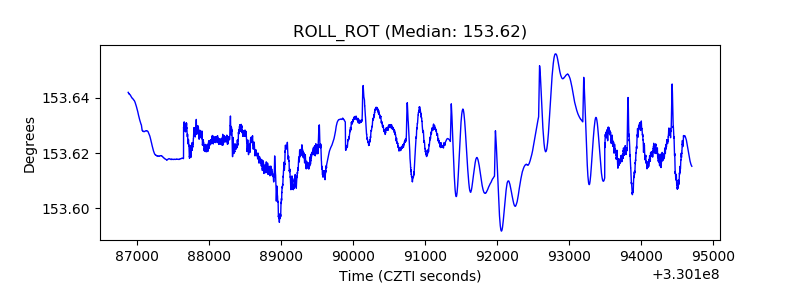 |
| _Roll_DEC | 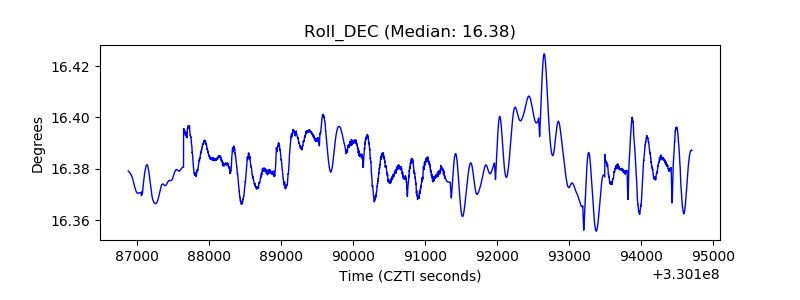 |
| _Roll_RA | 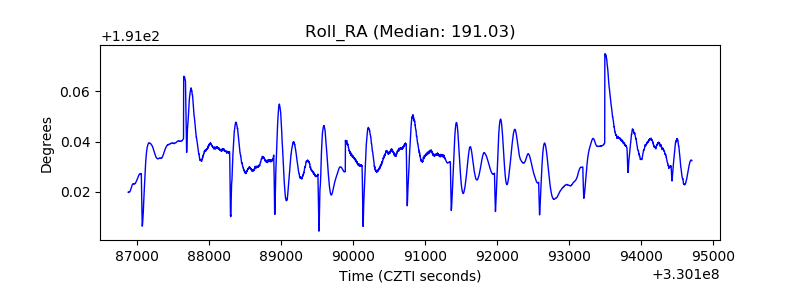 |
| Veto Counter | 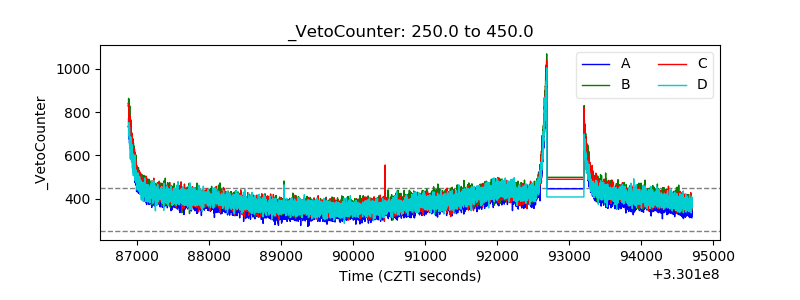 |