| Param | Original file | Final file |
|---|---|---|
| Filename | modeM0/AS1A09_008T05_9000003724cztM0_level2.fits | modeM0/AS1A09_008T05_9000003724cztM0_level2_quad_clean.evt |
| Size (bytes) | 859,348,800 | 644,486,400 |
| Size | 819.5 MB | 614.6 MB |
| Events in quadrant A | 5,394,792 | 3,663,155 |
| Events in quadrant B | 5,176,472 | 3,643,155 |
| Events in quadrant C | 5,120,722 | 3,338,164 |
| Events in quadrant D | 4,459,730 | 2,998,160 |
| Mode M0 | |||
|---|---|---|---|
| Quadrant | BADHDUFLAG | Total packets | Discarded packets |
| A | 0 | 182723 | 0 |
| B | 0 | 178418 | 0 |
| C | 0 | 189785 | 0 |
| D | 0 | 227388 | 0 |
| Mode SS | |||
|---|---|---|---|
| Quadrant | BADHDUFLAG | Total packets | Discarded packets |
| A | 0 | 1742 | 0 |
| B | 0 | 1742 | 0 |
| C | 0 | 1742 | 0 |
| D | 0 | 1742 | 0 |
| Mode M9 | |||
|---|---|---|---|
| Quadrant | BADHDUFLAG | Total packets | Discarded packets |
| A | 0 | 143 | 0 |
| B | 0 | 143 | 0 |
| C | 0 | 143 | 0 |
| D | 0 | 143 | 0 |
| Quadrant | Total seconds | Saturated seconds | Saturation percentage |
|---|---|---|---|
| A | 85679 | 1016 | 1.185821% |
| B | 85679 | 1097 | 1.280360% |
| C | 85679 | 2655 | 3.098776% |
| D | 85678 | 3155 | 3.682392% |
Noise dominated data is calculated using 1-second bins in cleaned event files. If a bin has >2000 counts, and if more than 50% of those come from <1% of pixels, then it is considered to be noise-dominated and hence unusable.
| Quadrant | # 1 sec bins | Bins with >0 counts | Bins with >2000 counts | High rate bins dominated by noise | Noise dominated (total time) | Noise dominated (detector-on time) | Marked lightcurve |
|---|---|---|---|---|---|---|---|
| A | 99720 | 85679 | 0 | 0 | 0.00% | 0.00% | 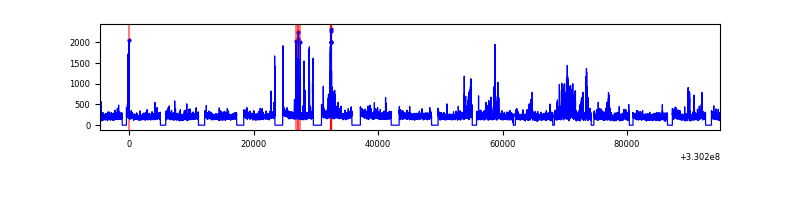 |
| B | 99720 | 85680 | 0 | 0 | 0.00% | 0.00% |  |
| C | 99720 | 85679 | 0 | 0 | 0.00% | 0.00% | 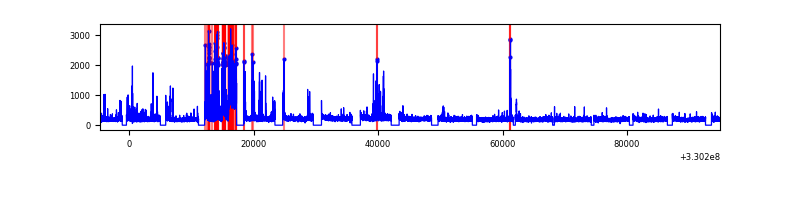 |
| D | 99720 | 85105 | 0 | 0 | 0.00% | 0.00% |  |
Top three noisy pixels from each quadrant. If the there are fewer than three noisy pixels in the level2.evt file, extra rows are filled as -1
| Pixel properties | Quadrant properties | ||||||
|---|---|---|---|---|---|---|---|
| Quadrant | DetID | PixID | Counts | Sigma | Mean | Median | Sigma |
| A | 0 | 29 | 5281 | 11.47 | 1405 | 1319 | 345.6 |
| A | 7 | 110 | 4283 | 8.58 | 1405 | 1319 | 345.6 |
| A | 0 | 30 | 4086 | 8.01 | 1405 | 1319 | 345.6 |
| B | 2 | 9 | 4124 | 10.41 | 1366 | 1302 | 271.2 |
| B | 5 | 128 | 3452 | 7.93 | 1366 | 1302 | 271.2 |
| B | 2 | 8 | 3425 | 7.83 | 1366 | 1302 | 271.2 |
| C | 1 | 81 | 3951 | 7.76 | 1352 | 1263 | 346.3 |
| C | 1 | 80 | 3931 | 7.7 | 1352 | 1263 | 346.3 |
| C | 12 | 241 | 3532 | 6.55 | 1352 | 1263 | 346.3 |
| D | 3 | 14 | 3218 | 6.0 | 1271 | 1155 | 343.9 |
| D | 7 | 3 | 3151 | 5.8 | 1271 | 1155 | 343.9 |
| D | 6 | 231 | 3130 | 5.74 | 1271 | 1155 | 343.9 |
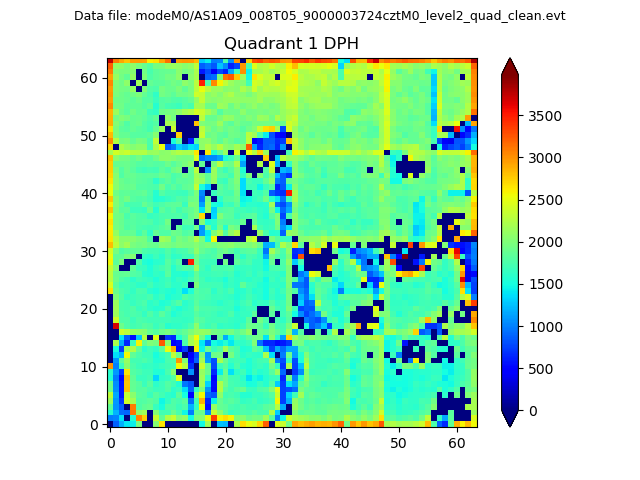
Histogram calculated using DETX and DETY for each event in the final _common_clean file
| Quadrant A |  |
 |
Quadrant B |
|---|---|---|---|
| Quadrant D | 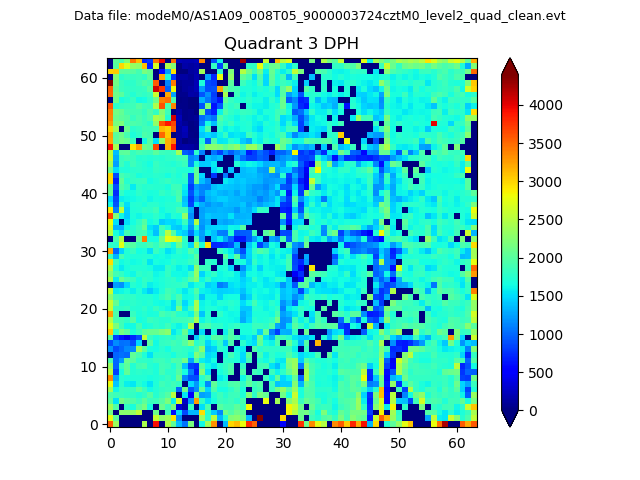 |
 |
Quadrant C |
| Plot type | Count rate plots | Images |
|---|---|---|
| Comparison with Poisson distribution Blue bars denote a histogram of data divided into 1 sec bins. Red curve is a Poisson curve with rate = median count rate of data. |
 |
 |
| Quadrant-wise count rates Data is divided into 100 sec bins |
 |
|
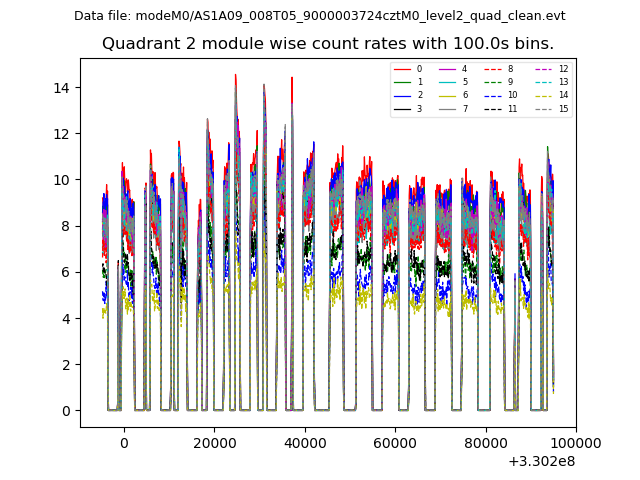
| Module-wise count rates for Quadrant A Data is divided into 100 sec bins |
 |
 |
| Module-wise count rates for Quadrant B Data is divided into 100 sec bins |
 |
 |
| Module-wise count rates for Quadrant C Data is divided into 100 sec bins |
 |
 |
| Module-wise count rates for Quadrant D Data is divided into 100 sec bins |
 |
 |
| Parameter | Plot |
|---|---|
| CZT HV Monitor |  |
| D_VDD |  |
| Temperature 1 |  |
| Veto HV Monitor |  |
| Veto LLD |  |
| Alpha Counter |  |
| _CPM_Rate | 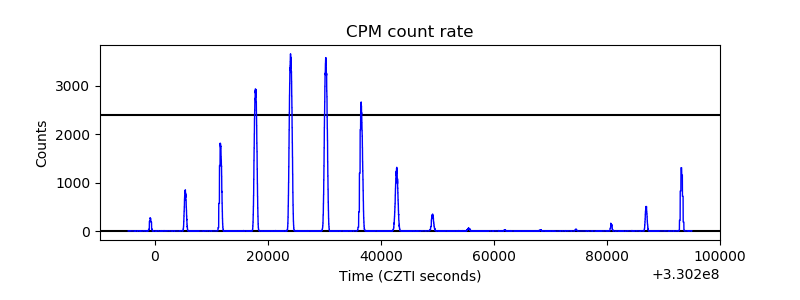 |
| CZT Counter |  |
| +2.5 Volts monitor |  |
| +5 Volts monitor |  |
| _ROLL_ROT | 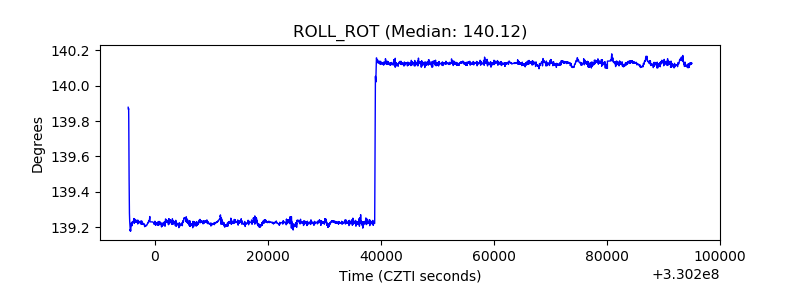 |
| _Roll_DEC | 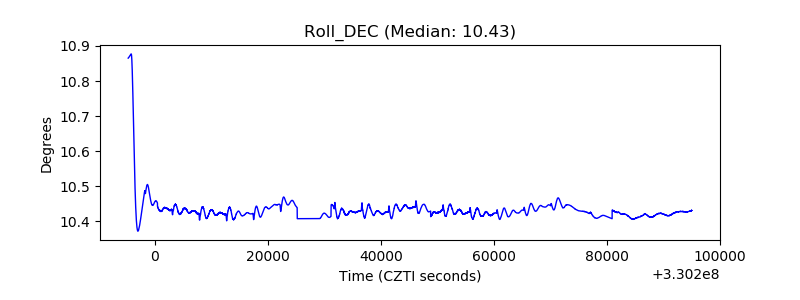 |
| _Roll_RA |  |
| Veto Counter |  |