| Param | Original file | Final file |
|---|---|---|
| Filename | modeM0/AS1A09_008T05_9000003724_25542cztM0_level2.evt | modeM0/AS1A09_008T05_9000003724_25542cztM0_level2_quad_clean.evt |
| Size (bytes) | 720,800,640 | 124,300,800 |
| Size | 687.4 MB | 118.5 MB |
| Events in quadrant A | 4,984,291 | 781,581 |
| Events in quadrant B | 5,019,381 | 783,877 |
| Events in quadrant C | 5,214,059 | 737,208 |
| Events in quadrant D | 5,904,144 | 738,381 |
| Mode M0 | |||
|---|---|---|---|
| Quadrant | BADHDUFLAG | Total packets | Discarded packets |
| A | 0 | 21687 | 0 |
| B | 0 | 21596 | 0 |
| C | 0 | 22256 | 0 |
| D | 0 | 24607 | 0 |
| Mode M9 | |||
|---|---|---|---|
| Quadrant | BADHDUFLAG | Total packets | Discarded packets |
| A | 0 | 16 | 0 |
| B | 0 | 16 | 0 |
| C | 0 | 16 | 0 |
| D | 0 | 16 | 0 |
| Quadrant | Total seconds | Saturated seconds | Saturation percentage |
|---|---|---|---|
| A | 10446 | 102 | 0.976450% |
| B | 10445 | 118 | 1.129727% |
| C | 10445 | 198 | 1.895644% |
| D | 10445 | 127 | 1.215893% |
Noise dominated data is calculated using 1-second bins in cleaned event files. If a bin has >2000 counts, and if more than 50% of those come from <1% of pixels, then it is considered to be noise-dominated and hence unusable.
| Quadrant | # 1 sec bins | Bins with >0 counts | Bins with >2000 counts | High rate bins dominated by noise | Noise dominated (total time) | Noise dominated (detector-on time) | Marked lightcurve |
|---|---|---|---|---|---|---|---|
| A | 11991 | 10448 | 3 | 3 | 0.03% | 0.03% | 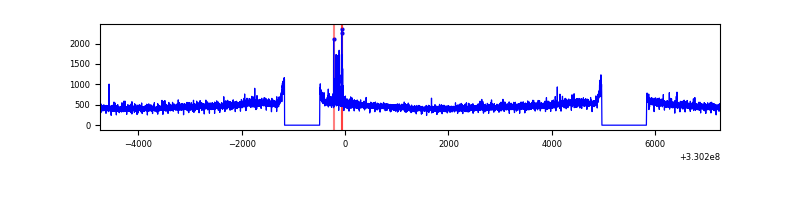 |
| B | 11990 | 10447 | 0 | 0 | 0.00% | 0.00% | 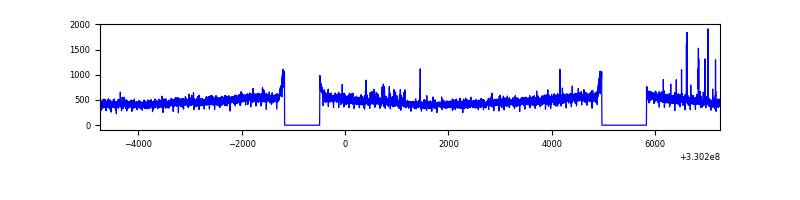 |
| C | 11990 | 10447 | 6 | 6 | 0.05% | 0.06% | 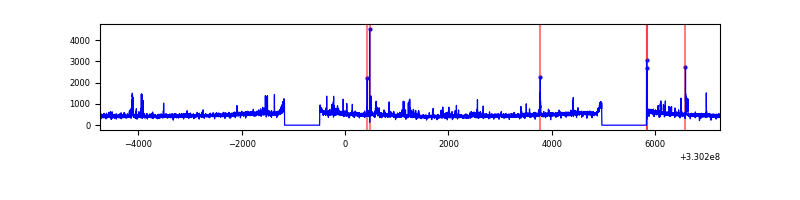 |
| D | 11990 | 10447 | 45 | 45 | 0.38% | 0.43% | 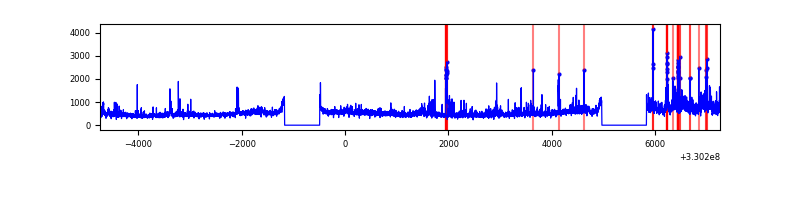 |
Top three noisy pixels from each quadrant. If the there are fewer than three noisy pixels in the level2.evt file, extra rows are filled as -1
| Pixel properties | Quadrant properties | ||||||
|---|---|---|---|---|---|---|---|
| Quadrant | DetID | PixID | Counts | Sigma | Mean | Median | Sigma |
| A | 6 | 16 | 51574 | 195.34 | 1278 | 1253 | 257.6 |
| A | 13 | 254 | 15985 | 57.19 | 1278 | 1253 | 257.6 |
| A | 3 | 137 | 12054 | 41.93 | 1278 | 1253 | 257.6 |
| B | 0 | 190 | 35445 | 141.2 | 1268 | 1234 | 242.3 |
| B | 12 | 111 | 30807 | 122.06 | 1268 | 1234 | 242.3 |
| B | 11 | 111 | 28014 | 110.53 | 1268 | 1234 | 242.3 |
| C | 14 | 238 | 194318 | 671.34 | 1219 | 1228 | 287.6 |
| C | 2 | 16 | 144899 | 499.52 | 1219 | 1228 | 287.6 |
| C | 3 | 233 | 130531 | 449.56 | 1219 | 1228 | 287.6 |
| D | 8 | 195 | 683322 | 2063.37 | 1225 | 1199 | 330.6 |
| D | 1 | 52 | 499467 | 1507.22 | 1225 | 1199 | 330.6 |
| D | 2 | 234 | 43899 | 129.16 | 1225 | 1199 | 330.6 |
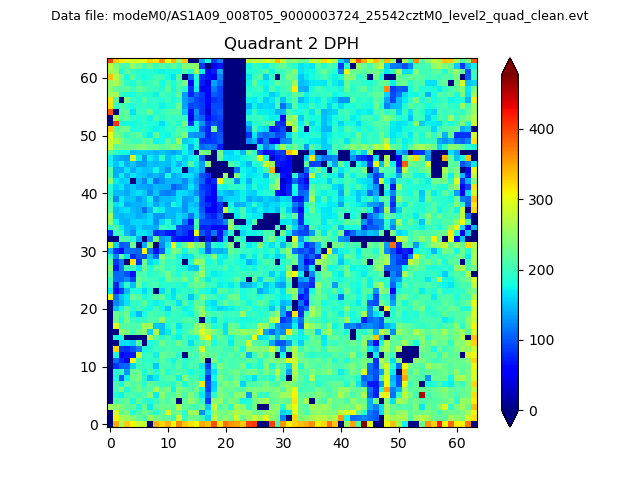
Histogram calculated using DETX and DETY for each event in the final _common_clean file
| Quadrant A | 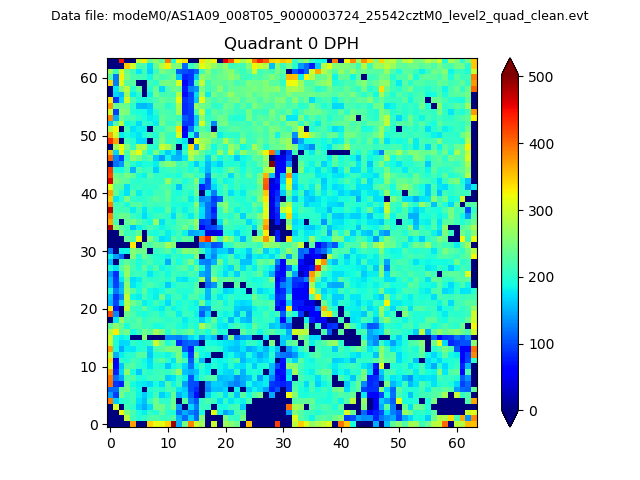 |
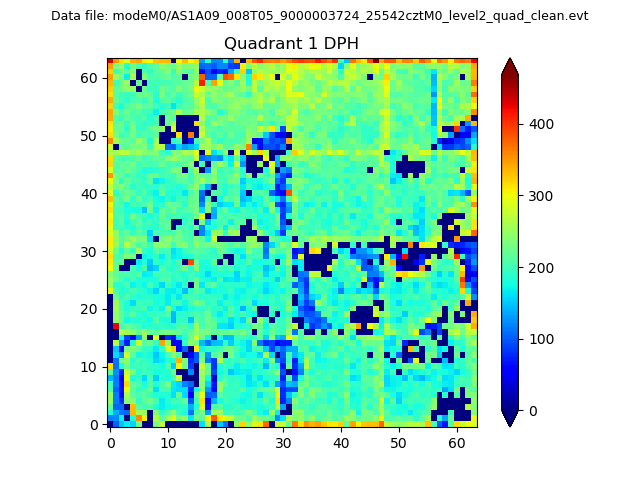 |
Quadrant B |
|---|---|---|---|
| Quadrant D | 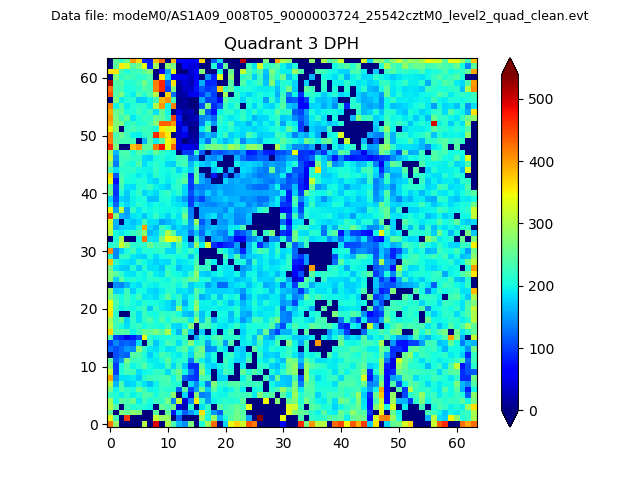 |
 |
Quadrant C |
| Plot type | Count rate plots | Images |
|---|---|---|
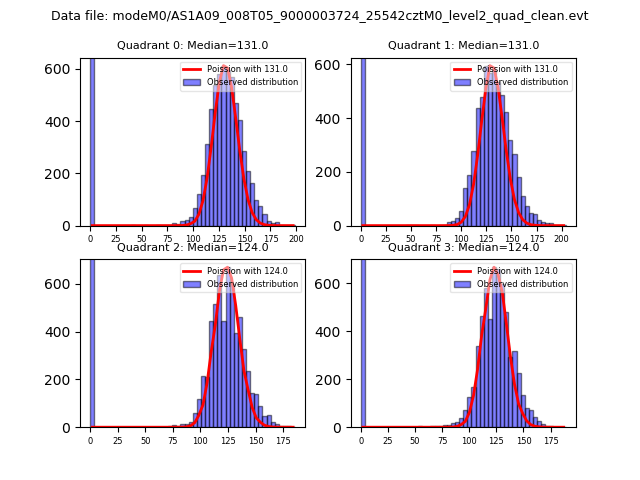
| Comparison with Poisson distribution Blue bars denote a histogram of data divided into 1 sec bins. Red curve is a Poisson curve with rate = median count rate of data. |
 |
 |
| Quadrant-wise count rates Data is divided into 100 sec bins |
 |
|
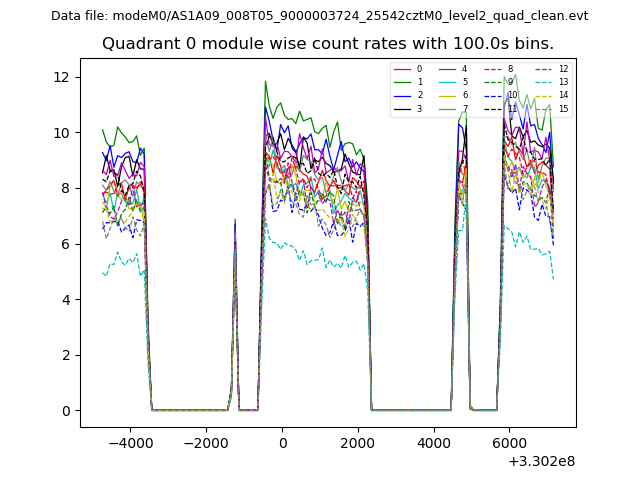
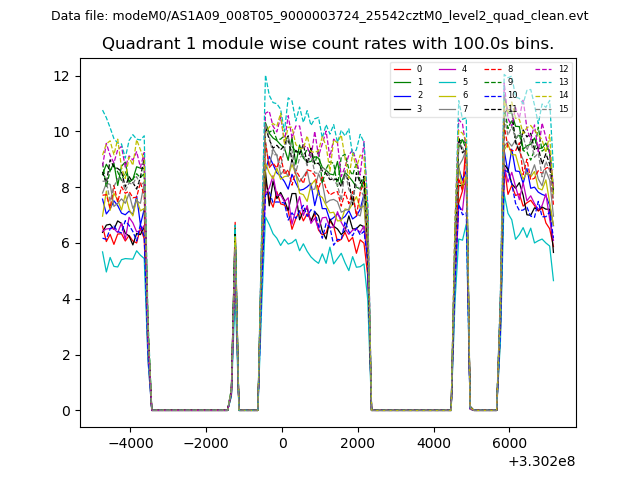
| Module-wise count rates for Quadrant A Data is divided into 100 sec bins |
 |
 |
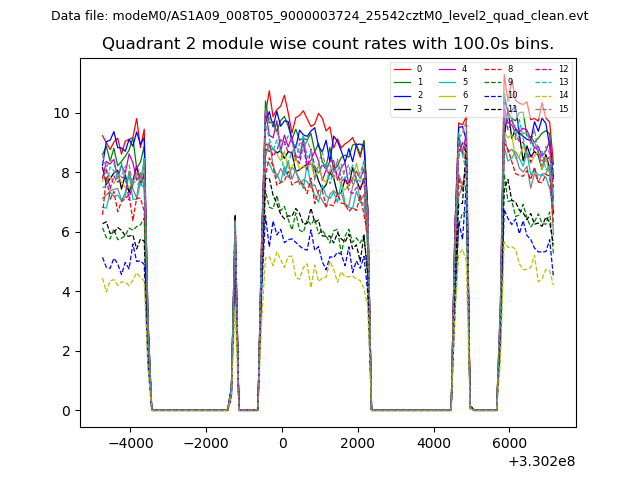
| Module-wise count rates for Quadrant B Data is divided into 100 sec bins |
 |
 |
| Module-wise count rates for Quadrant C Data is divided into 100 sec bins |
 |
 |
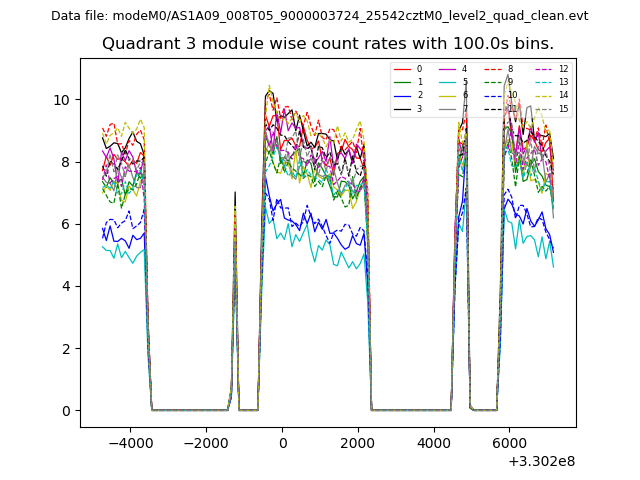
| Module-wise count rates for Quadrant D Data is divided into 100 sec bins |
 |
 |
| Parameter | Plot |
|---|---|
| CZT HV Monitor | 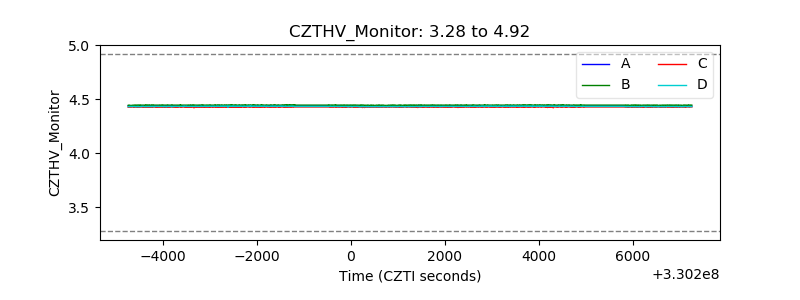 |
| D_VDD | 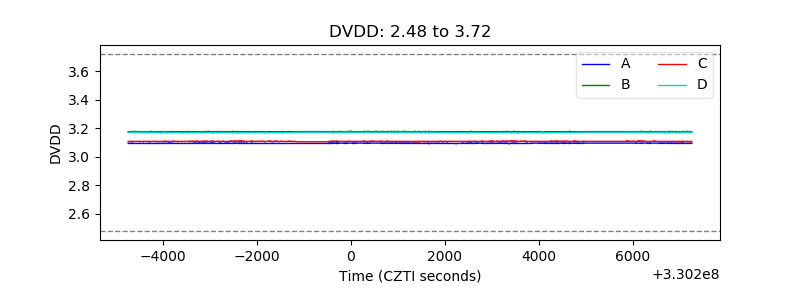 |
| Temperature 1 | 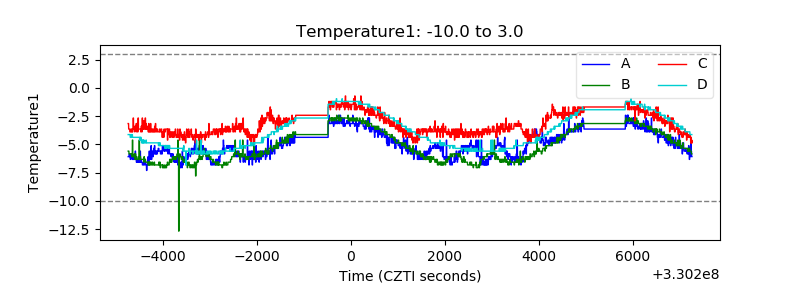 |
| Veto HV Monitor | 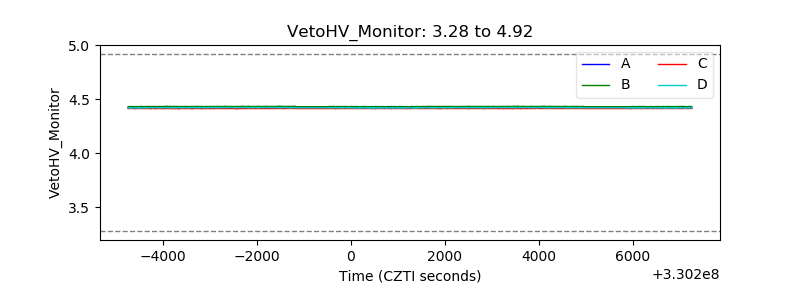 |
| Veto LLD | 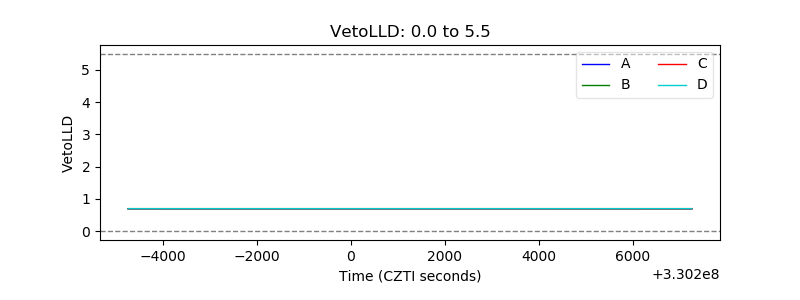 |
| Alpha Counter |  |
| _CPM_Rate |  |
| CZT Counter | 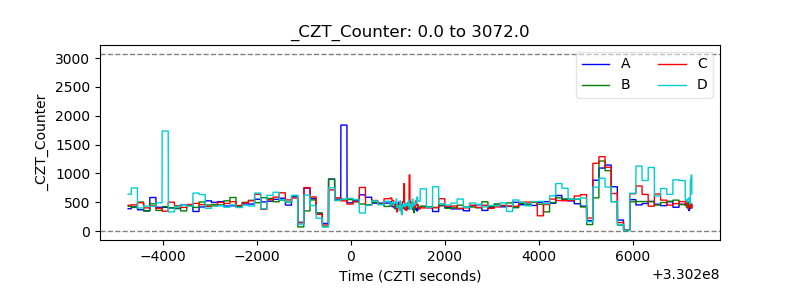 |
| +2.5 Volts monitor |  |
| +5 Volts monitor |  |
| _ROLL_ROT | 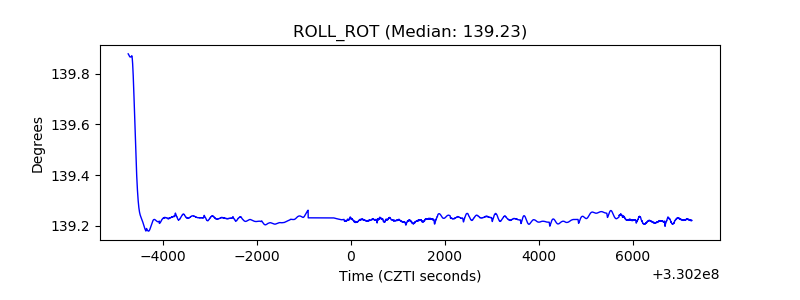 |
| _Roll_DEC | 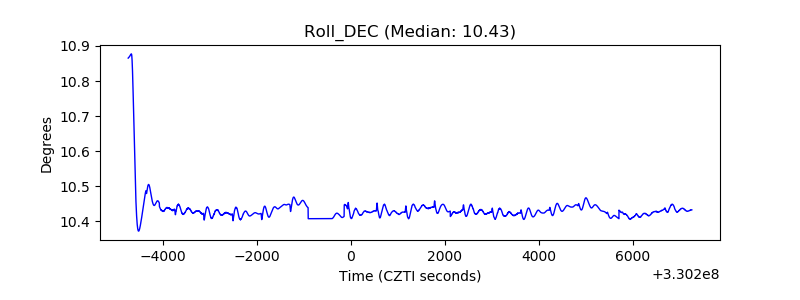 |
| _Roll_RA | 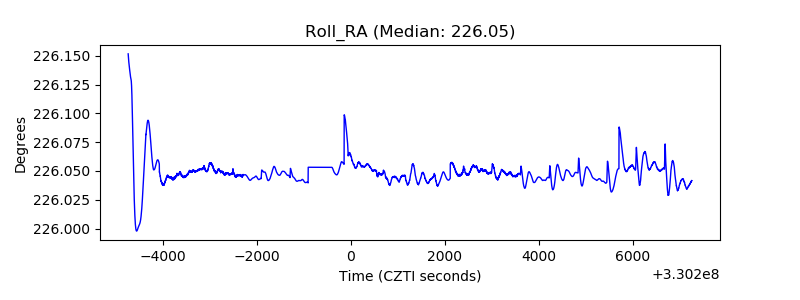 |
| Veto Counter | 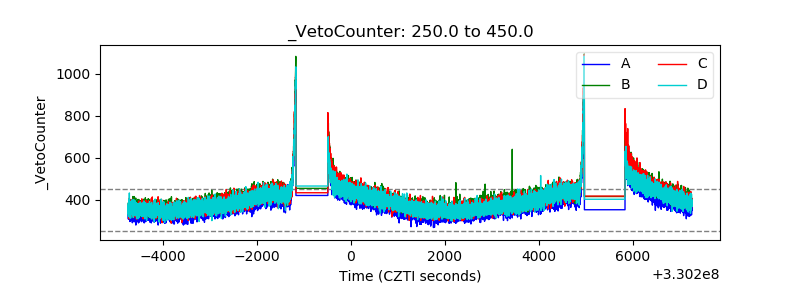 |