| Param | Original file | Final file |
|---|---|---|
| Filename | modeM0/AS1A09_008T05_9000003724_25543cztM0_level2.evt | modeM0/AS1A09_008T05_9000003724_25543cztM0_level2_quad_clean.evt |
| Size (bytes) | 510,641,280 | 92,865,600 |
| Size | 487.0 MB | 88.6 MB |
| Events in quadrant A | 3,174,281 | 608,411 |
| Events in quadrant B | 3,239,155 | 616,382 |
| Events in quadrant C | 3,555,710 | 566,572 |
| Events in quadrant D | 5,046,616 | 559,282 |
| Mode M0 | |||
|---|---|---|---|
| Quadrant | BADHDUFLAG | Total packets | Discarded packets |
| A | 0 | 13664 | 0 |
| B | 0 | 13797 | 0 |
| C | 0 | 14953 | 0 |
| D | 0 | 19779 | 0 |
| Mode M9 | |||
|---|---|---|---|
| Quadrant | BADHDUFLAG | Total packets | Discarded packets |
| A | 0 | 16 | 0 |
| B | 0 | 17 | 0 |
| C | 0 | 17 | 0 |
| D | 0 | 17 | 0 |
| Quadrant | Total seconds | Saturated seconds | Saturation percentage |
|---|---|---|---|
| A | 6621 | 38 | 0.573931% |
| B | 6621 | 47 | 0.709863% |
| C | 6621 | 191 | 2.884761% |
| D | 6621 | 153 | 2.310829% |
Noise dominated data is calculated using 1-second bins in cleaned event files. If a bin has >2000 counts, and if more than 50% of those come from <1% of pixels, then it is considered to be noise-dominated and hence unusable.
| Quadrant | # 1 sec bins | Bins with >0 counts | Bins with >2000 counts | High rate bins dominated by noise | Noise dominated (total time) | Noise dominated (detector-on time) | Marked lightcurve |
|---|---|---|---|---|---|---|---|
| A | 7611 | 6622 | 0 | 0 | 0.00% | 0.00% | 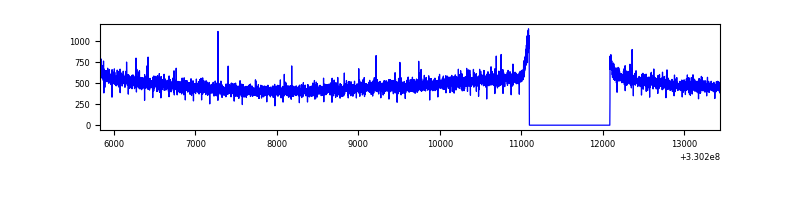 |
| B | 7611 | 6622 | 0 | 0 | 0.00% | 0.00% | 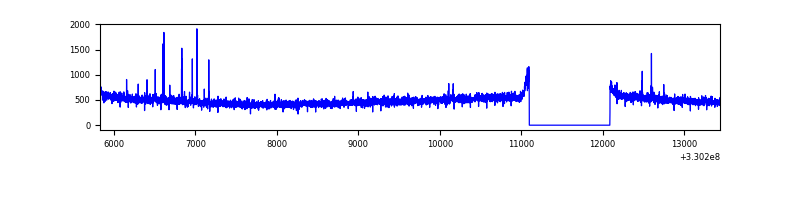 |
| C | 7611 | 6622 | 72 | 72 | 0.95% | 1.09% | 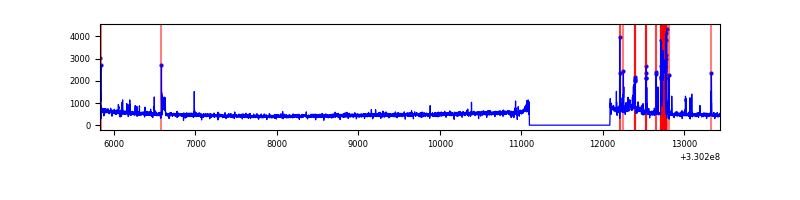 |
| D | 7611 | 6622 | 89 | 89 | 1.17% | 1.34% | 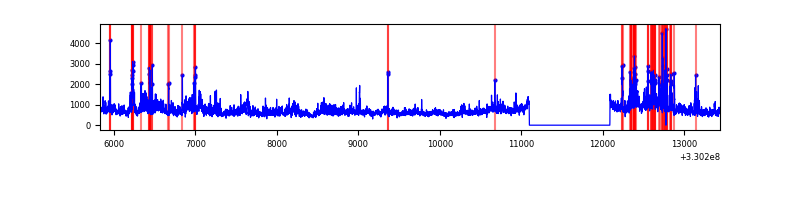 |
Top three noisy pixels from each quadrant. If the there are fewer than three noisy pixels in the level2.evt file, extra rows are filled as -1
| Pixel properties | Quadrant properties | ||||||
|---|---|---|---|---|---|---|---|
| Quadrant | DetID | PixID | Counts | Sigma | Mean | Median | Sigma |
| A | 13 | 254 | 10928 | 61.03 | 823 | 806 | 165.8 |
| A | 3 | 137 | 7794 | 42.14 | 823 | 806 | 165.8 |
| A | 0 | 226 | 7043 | 37.61 | 823 | 806 | 165.8 |
| B | 0 | 190 | 28663 | 177.65 | 817 | 797 | 156.9 |
| B | 12 | 111 | 19327 | 118.13 | 817 | 797 | 156.9 |
| B | 11 | 111 | 17192 | 104.52 | 817 | 797 | 156.9 |
| C | 2 | 16 | 389619 | 2106.31 | 779 | 784 | 184.6 |
| C | 14 | 238 | 124824 | 671.92 | 779 | 784 | 184.6 |
| C | 3 | 233 | 5292 | 24.42 | 779 | 784 | 184.6 |
| D | 8 | 195 | 1362757 | 6438.61 | 781 | 765 | 211.5 |
| D | 1 | 52 | 642755 | 3034.91 | 781 | 765 | 211.5 |
| D | 2 | 234 | 29632 | 136.46 | 781 | 765 | 211.5 |
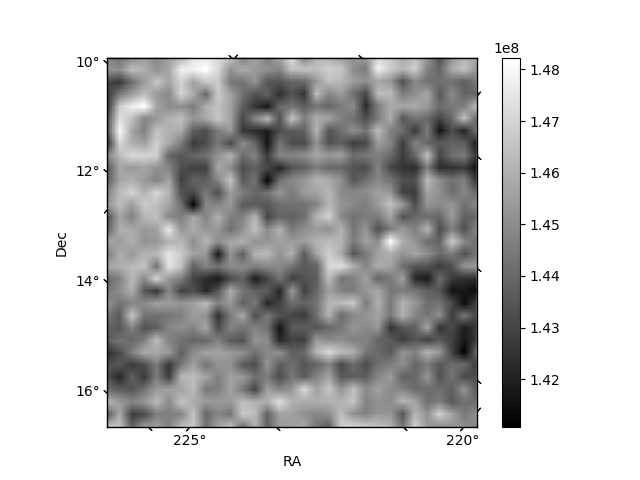
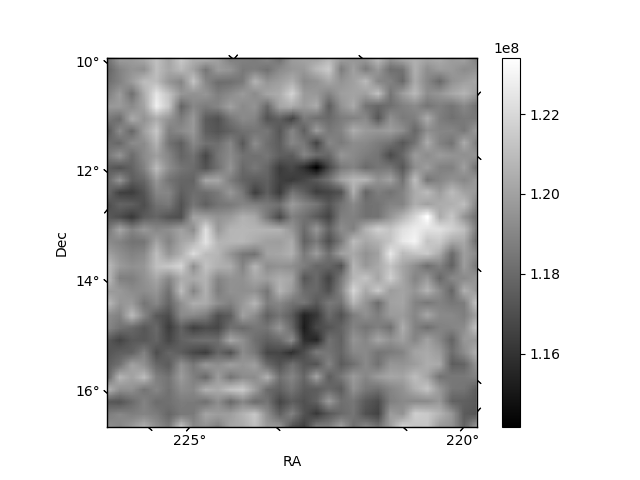
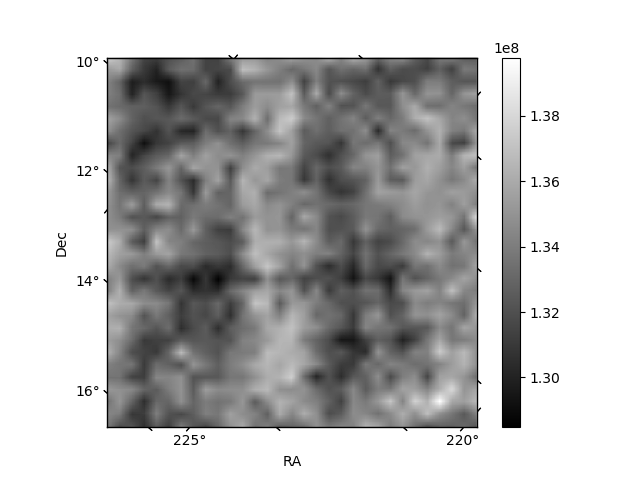
Histogram calculated using DETX and DETY for each event in the final _common_clean file
| Quadrant A | 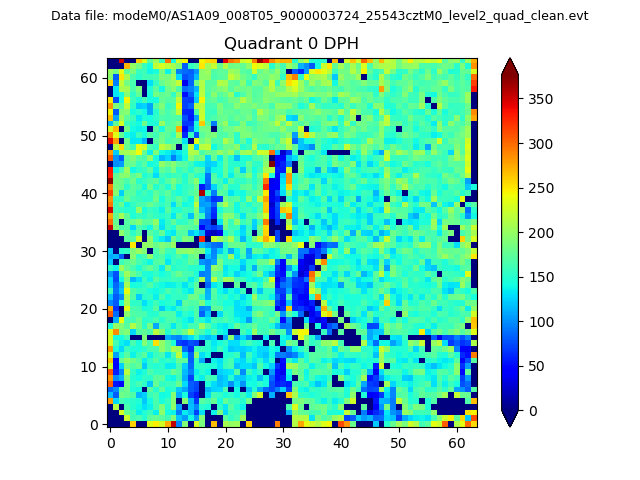 |
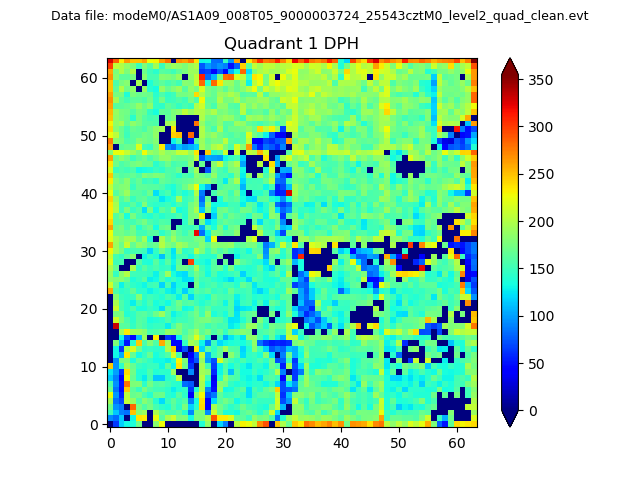 |
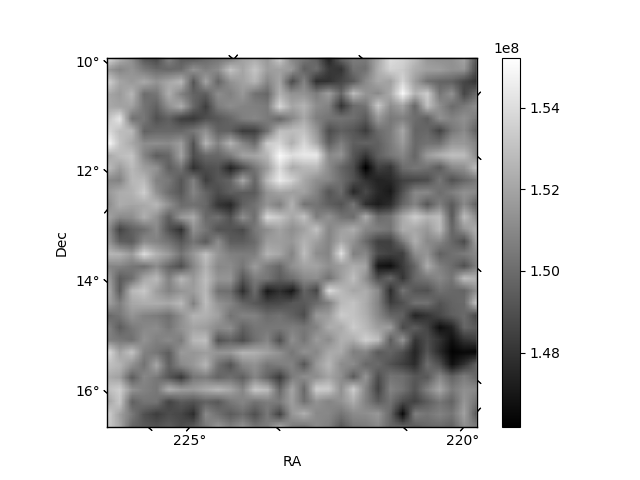
Quadrant B |
|---|---|---|---|
| Quadrant D | 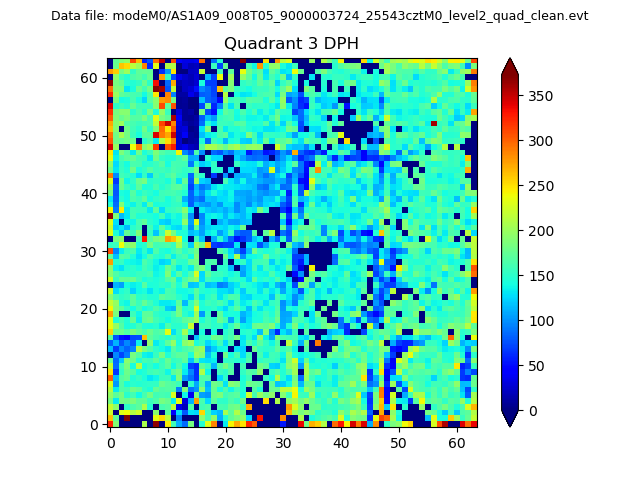 |
 |
Quadrant C |
| Plot type | Count rate plots | Images |
|---|---|---|
| Comparison with Poisson distribution Blue bars denote a histogram of data divided into 1 sec bins. Red curve is a Poisson curve with rate = median count rate of data. |
 |
 |
| Quadrant-wise count rates Data is divided into 100 sec bins |
 |
|
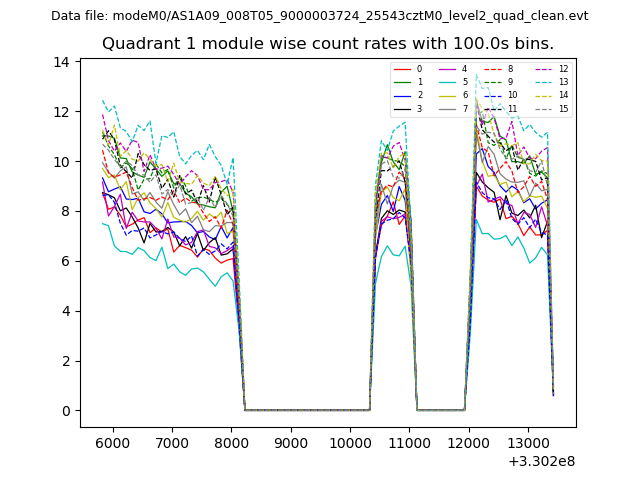
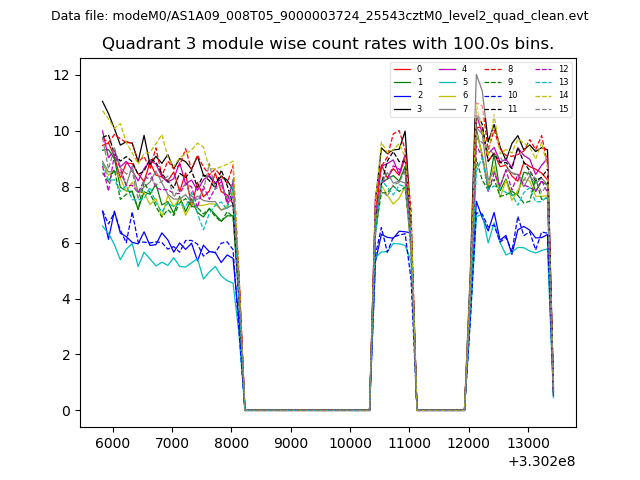
| Module-wise count rates for Quadrant A Data is divided into 100 sec bins |
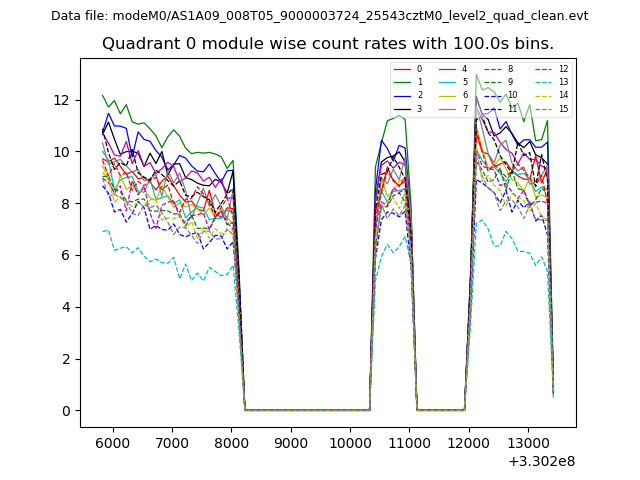 |
 |
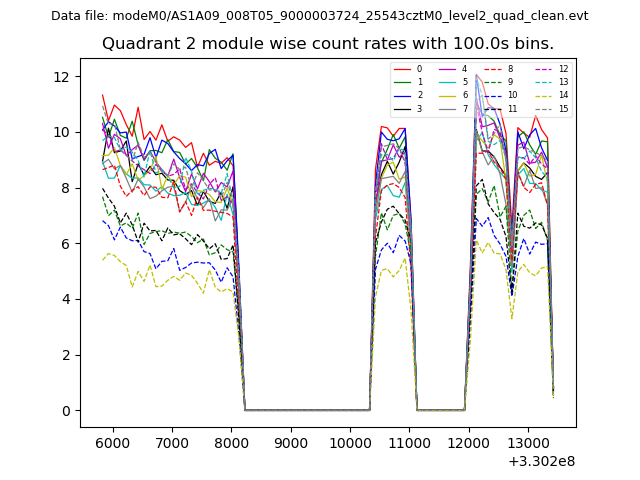
| Module-wise count rates for Quadrant B Data is divided into 100 sec bins |
 |
 |
| Module-wise count rates for Quadrant C Data is divided into 100 sec bins |
 |
 |
| Module-wise count rates for Quadrant D Data is divided into 100 sec bins |
 |
 |
| Parameter | Plot |
|---|---|
| CZT HV Monitor | 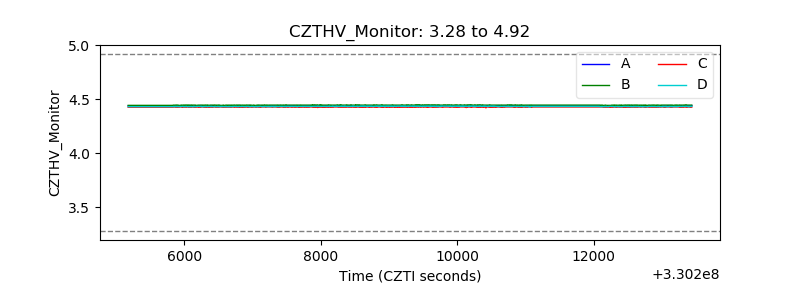 |
| D_VDD | 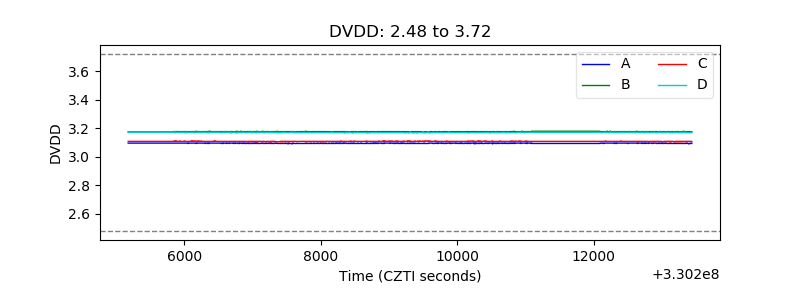 |
| Temperature 1 | 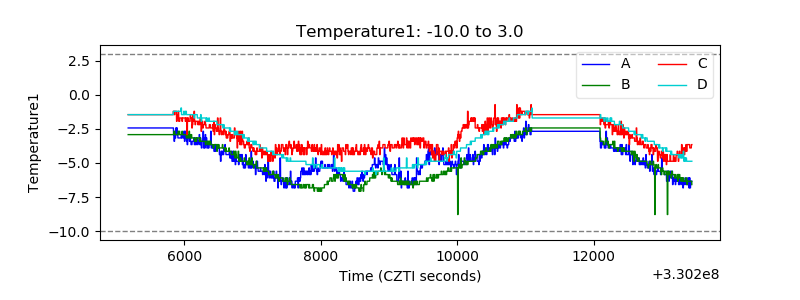 |
| Veto HV Monitor | 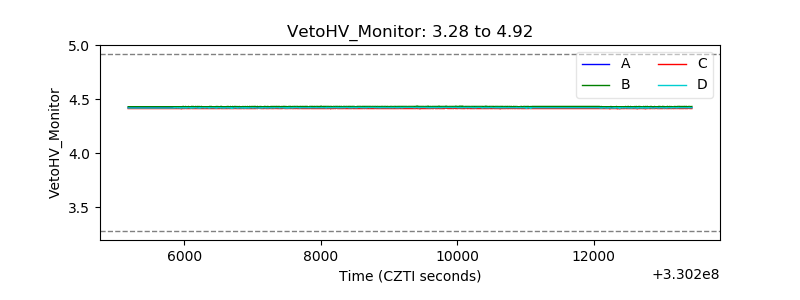 |
| Veto LLD | 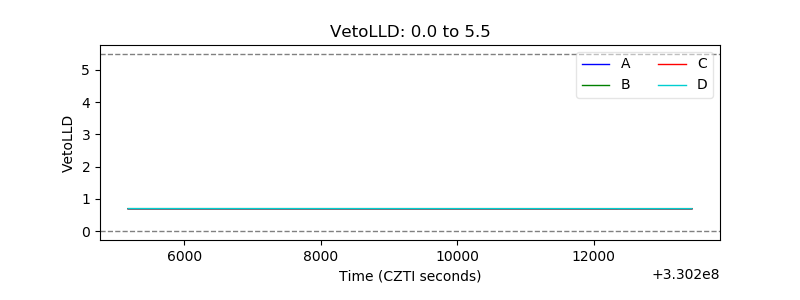 |
| Alpha Counter |  |
| _CPM_Rate | 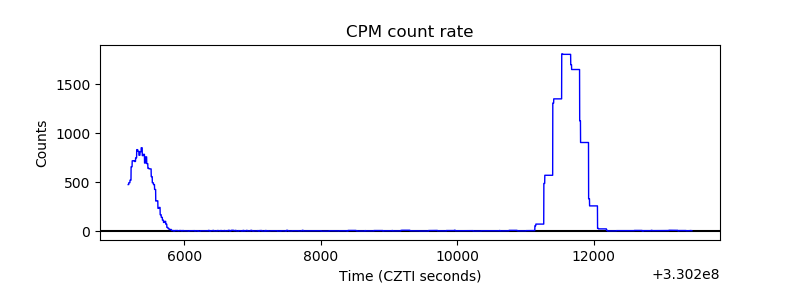 |
| CZT Counter | 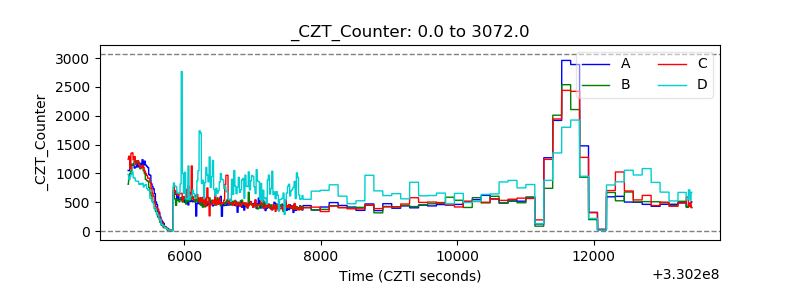 |
| +2.5 Volts monitor |  |
| +5 Volts monitor |  |
| _ROLL_ROT | 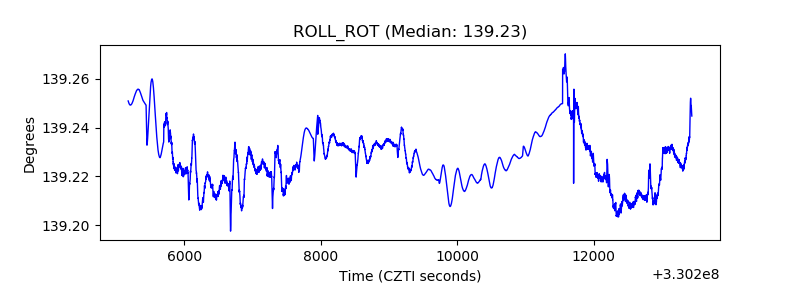 |
| _Roll_DEC | 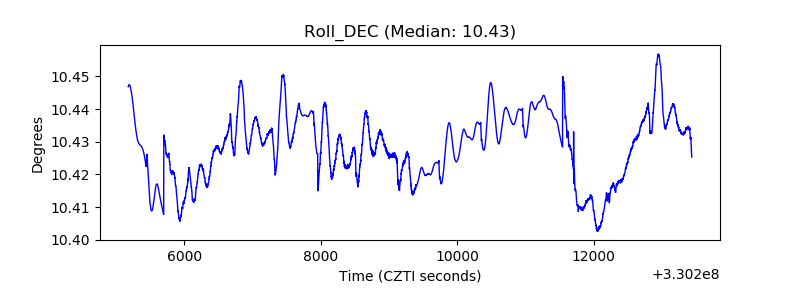 |
| _Roll_RA |  |
| Veto Counter | 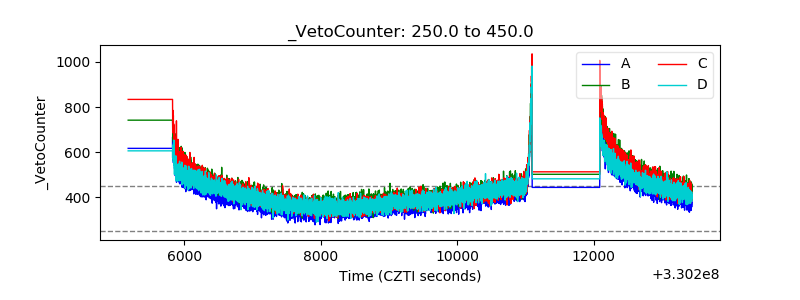 |