| Param | Original file | Final file |
|---|---|---|
| Filename | modeM0/AS1A09_008T05_9000003724_25545cztM0_level2.evt | modeM0/AS1A09_008T05_9000003724_25545cztM0_level2_quad_clean.evt |
| Size (bytes) | 605,963,520 | 92,540,160 |
| Size | 577.9 MB | 88.3 MB |
| Events in quadrant A | 3,124,583 | 617,056 |
| Events in quadrant B | 3,193,165 | 629,167 |
| Events in quadrant C | 6,320,357 | 546,622 |
| Events in quadrant D | 5,279,833 | 562,230 |
| Mode M0 | |||
|---|---|---|---|
| Quadrant | BADHDUFLAG | Total packets | Discarded packets |
| A | 0 | 13281 | 0 |
| B | 0 | 13421 | 0 |
| C | 0 | 23051 | 0 |
| D | 0 | 20334 | 0 |
| Mode M9 | |||
|---|---|---|---|
| Quadrant | BADHDUFLAG | Total packets | Discarded packets |
| A | 0 | 17 | 0 |
| B | 0 | 18 | 0 |
| C | 0 | 18 | 0 |
| D | 0 | 18 | 0 |
| Quadrant | Total seconds | Saturated seconds | Saturation percentage |
|---|---|---|---|
| A | 6414 | 11 | 0.171500% |
| B | 6414 | 19 | 0.296227% |
| C | 6413 | 1196 | 18.649618% |
| D | 6413 | 133 | 2.073912% |
Noise dominated data is calculated using 1-second bins in cleaned event files. If a bin has >2000 counts, and if more than 50% of those come from <1% of pixels, then it is considered to be noise-dominated and hence unusable.
| Quadrant | # 1 sec bins | Bins with >0 counts | Bins with >2000 counts | High rate bins dominated by noise | Noise dominated (total time) | Noise dominated (detector-on time) | Marked lightcurve |
|---|---|---|---|---|---|---|---|
| A | 7569 | 6415 | 0 | 0 | 0.00% | 0.00% | 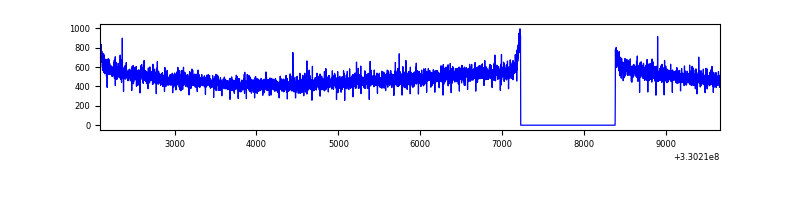 |
| B | 7569 | 6415 | 1 | 1 | 0.01% | 0.02% | 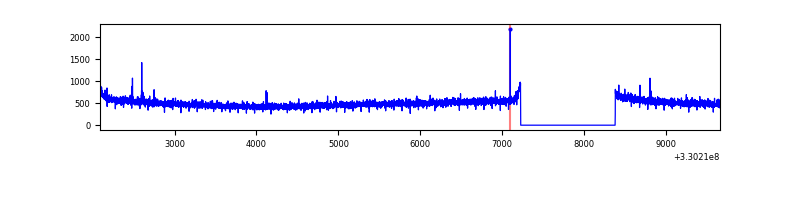 |
| C | 7568 | 6414 | 680 | 680 | 8.99% | 10.60% | 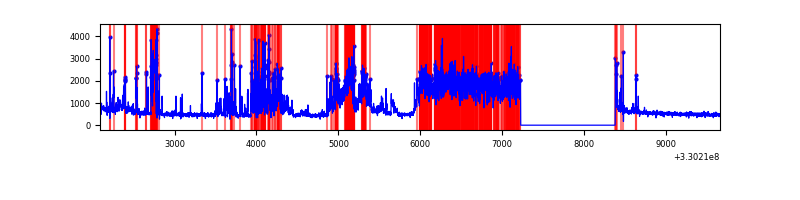 |
| D | 7568 | 6414 | 98 | 98 | 1.29% | 1.53% | 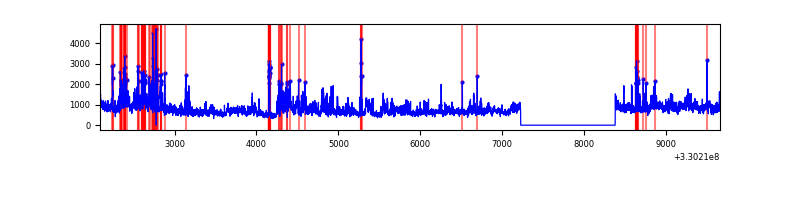 |
Top three noisy pixels from each quadrant. If the there are fewer than three noisy pixels in the level2.evt file, extra rows are filled as -1
| Pixel properties | Quadrant properties | ||||||
|---|---|---|---|---|---|---|---|
| Quadrant | DetID | PixID | Counts | Sigma | Mean | Median | Sigma |
| A | 13 | 254 | 9736 | 55.33 | 810 | 793 | 161.6 |
| A | 3 | 137 | 7407 | 40.92 | 810 | 793 | 161.6 |
| A | 0 | 226 | 7038 | 38.63 | 810 | 793 | 161.6 |
| B | 12 | 111 | 18565 | 115.26 | 811 | 792 | 154.2 |
| B | 11 | 111 | 16745 | 103.46 | 811 | 792 | 154.2 |
| B | 14 | 111 | 15698 | 96.67 | 811 | 792 | 154.2 |
| C | 2 | 16 | 3318522 | 19216.87 | 736 | 742 | 172.6 |
| C | 14 | 238 | 117904 | 678.61 | 736 | 742 | 172.6 |
| C | 3 | 233 | 8651 | 45.81 | 736 | 742 | 172.6 |
| D | 1 | 52 | 1200293 | 5873.14 | 766 | 750 | 204.2 |
| D | 8 | 195 | 1128693 | 5522.57 | 766 | 750 | 204.2 |
| D | 2 | 234 | 27274 | 129.87 | 766 | 750 | 204.2 |
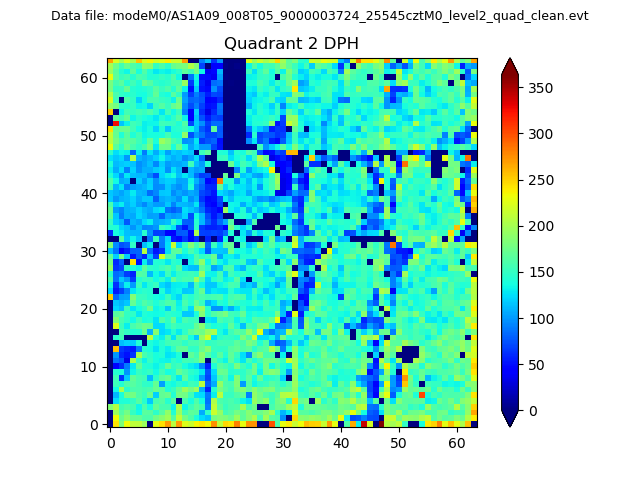
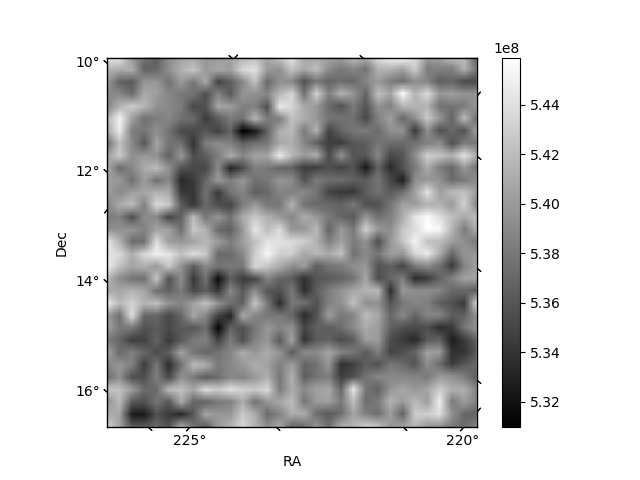
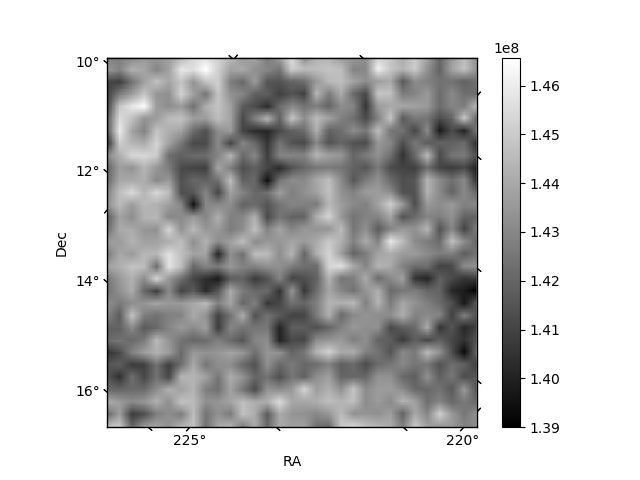
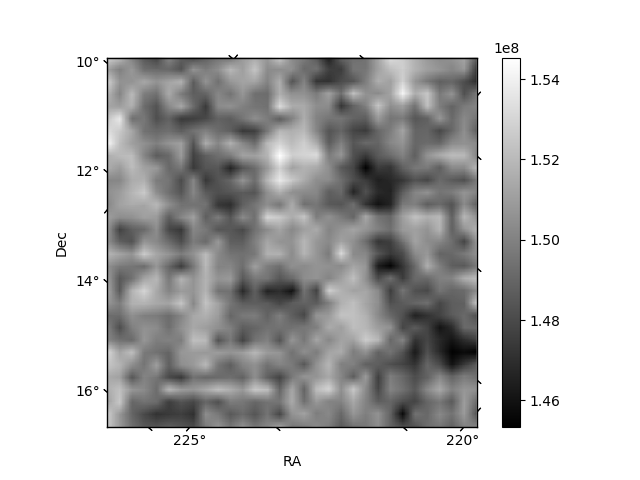
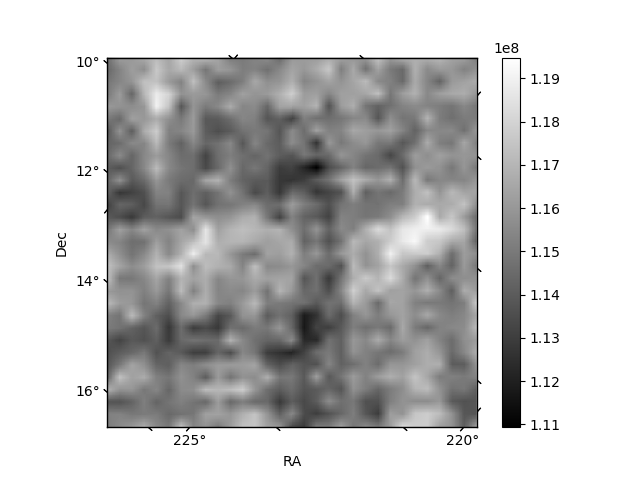
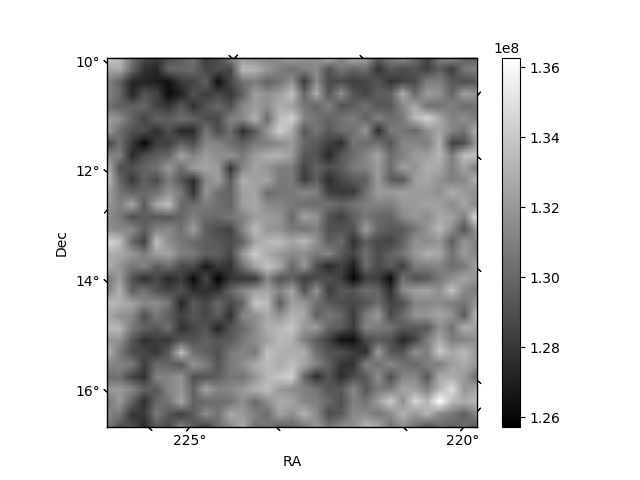
Histogram calculated using DETX and DETY for each event in the final _common_clean file
| Quadrant A | 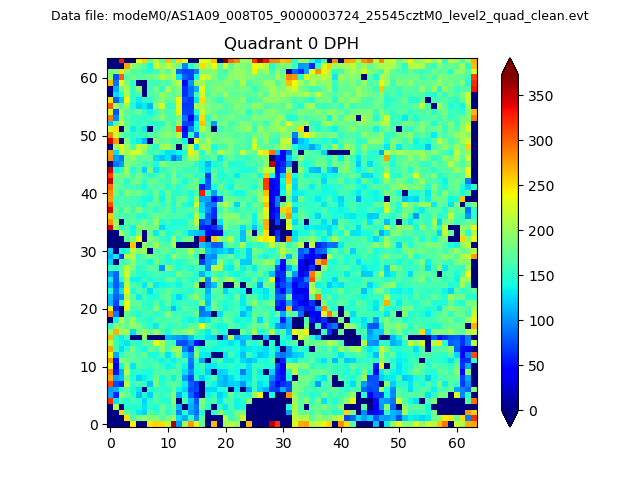 |
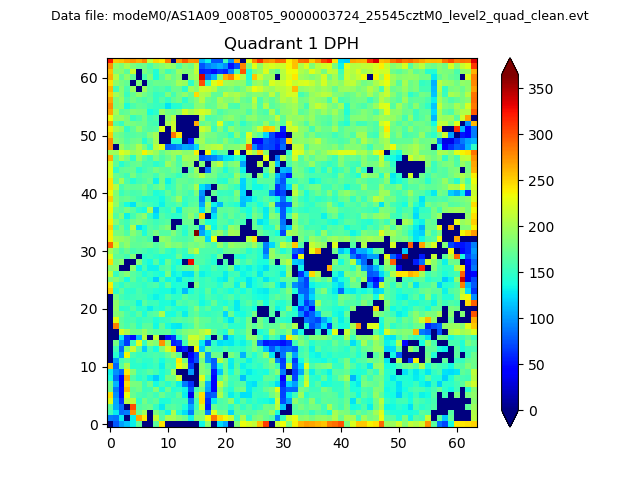 |
Quadrant B |
|---|---|---|---|
| Quadrant D | 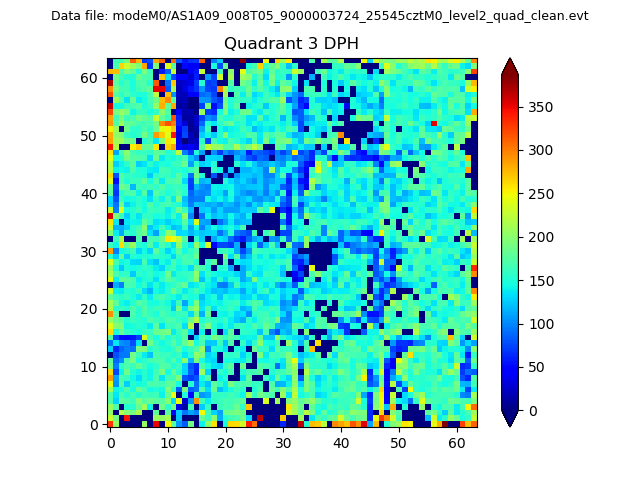 |
 |
Quadrant C |
| Plot type | Count rate plots | Images |
|---|---|---|
| Comparison with Poisson distribution Blue bars denote a histogram of data divided into 1 sec bins. Red curve is a Poisson curve with rate = median count rate of data. |
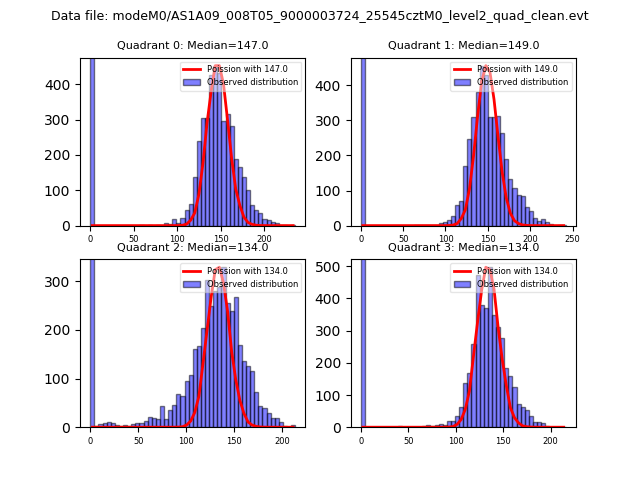 |
 |
| Quadrant-wise count rates Data is divided into 100 sec bins |
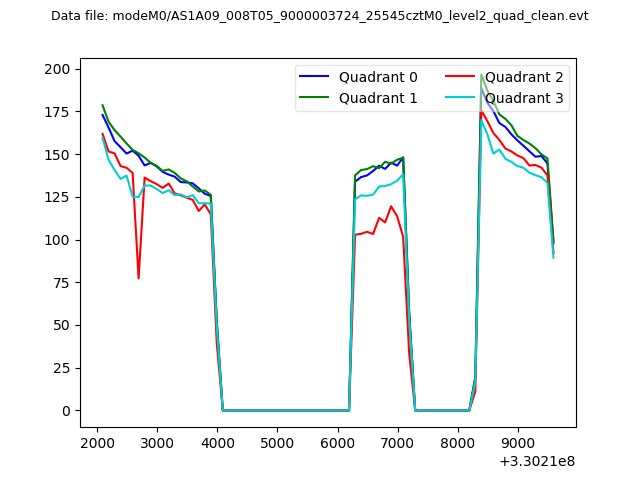 |
|
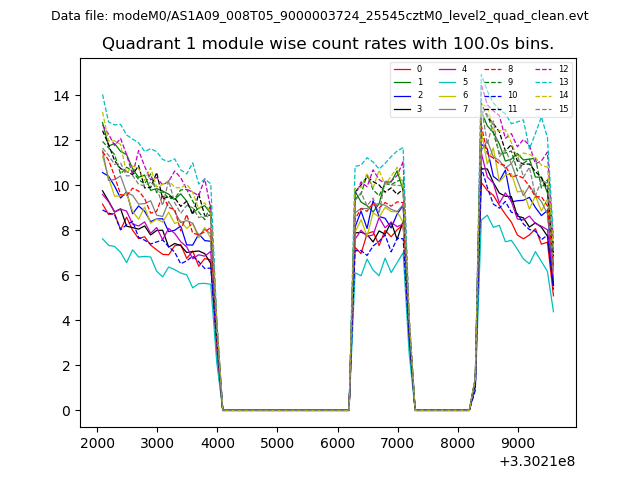
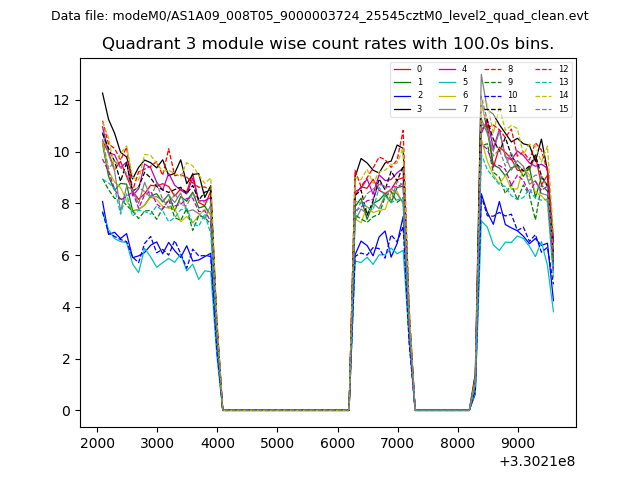
| Module-wise count rates for Quadrant A Data is divided into 100 sec bins |
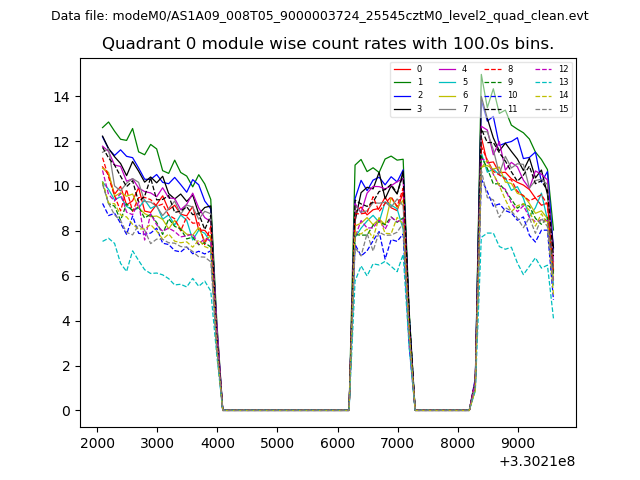 |
 |
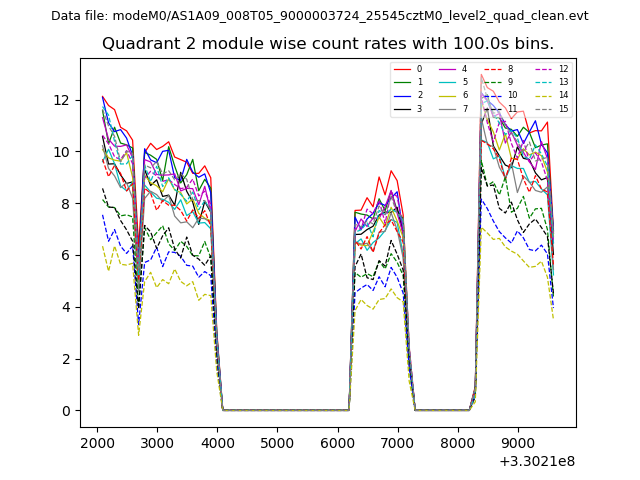
| Module-wise count rates for Quadrant B Data is divided into 100 sec bins |
 |
 |
| Module-wise count rates for Quadrant C Data is divided into 100 sec bins |
 |
 |
| Module-wise count rates for Quadrant D Data is divided into 100 sec bins |
 |
 |
| Parameter | Plot |
|---|---|
| CZT HV Monitor | 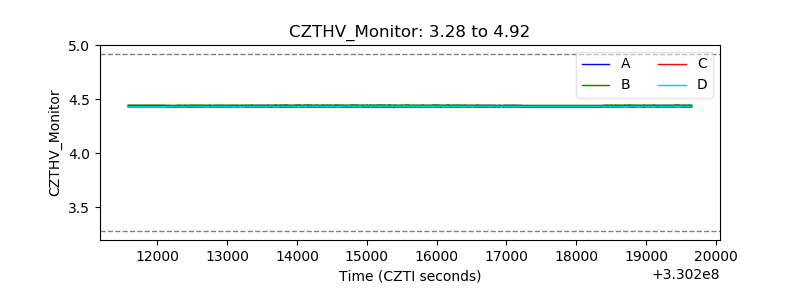 |
| D_VDD | 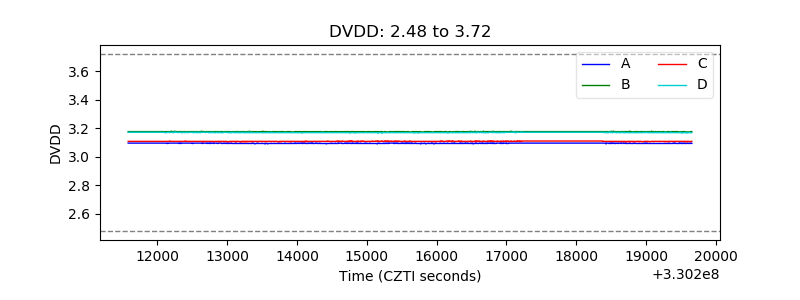 |
| Temperature 1 | 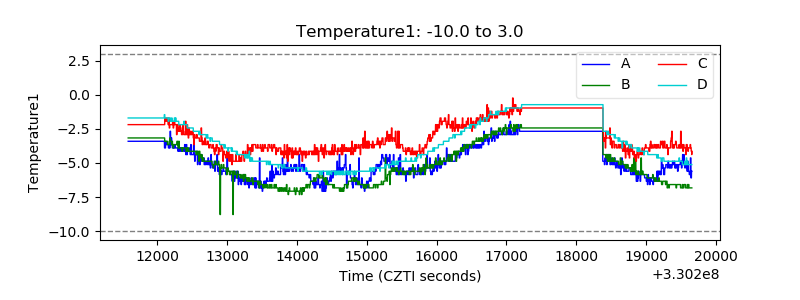 |
| Veto HV Monitor | 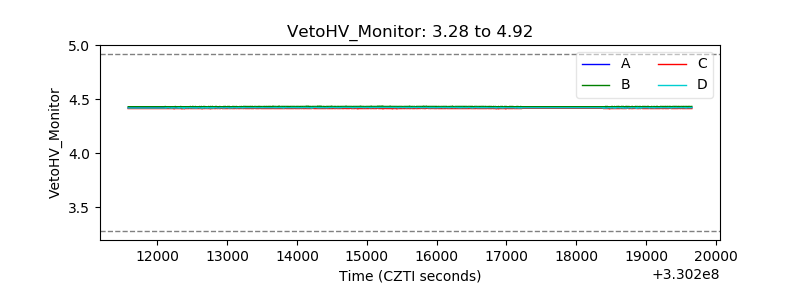 |
| Veto LLD | 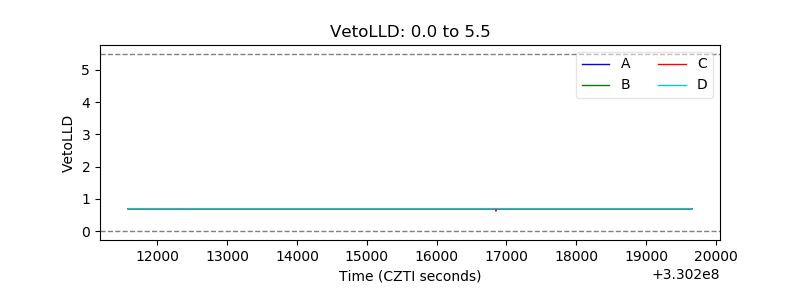 |
| Alpha Counter |  |
| _CPM_Rate | 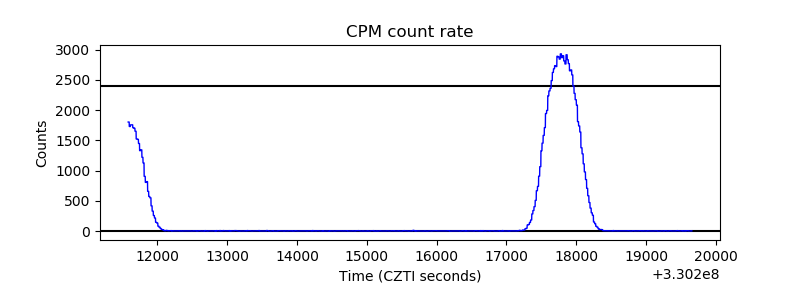 |
| CZT Counter |  |
| +2.5 Volts monitor |  |
| +5 Volts monitor |  |
| _ROLL_ROT | 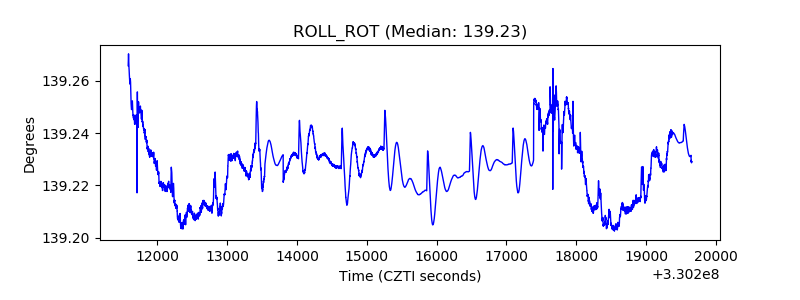 |
| _Roll_DEC | 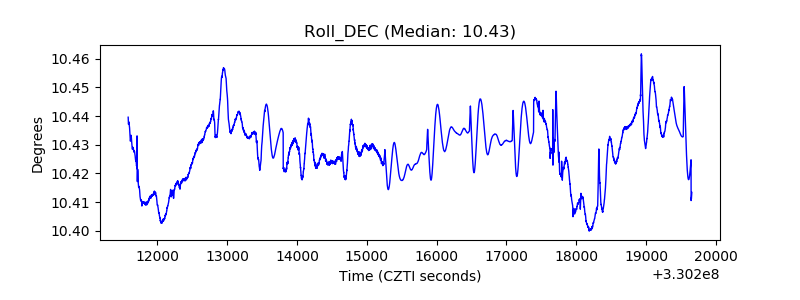 |
| _Roll_RA |  |
| Veto Counter | 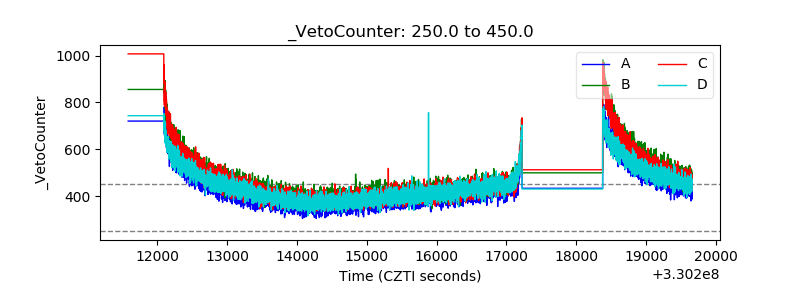 |