| Param | Original file | Final file |
|---|---|---|
| Filename | modeM0/AS1A09_008T05_9000003724_25546cztM0_level2.evt | modeM0/AS1A09_008T05_9000003724_25546cztM0_level2_quad_clean.evt |
| Size (bytes) | 504,803,520 | 92,393,280 |
| Size | 481.4 MB | 88.1 MB |
| Events in quadrant A | 3,298,250 | 606,061 |
| Events in quadrant B | 3,224,980 | 625,954 |
| Events in quadrant C | 3,431,028 | 576,128 |
| Events in quadrant D | 4,909,789 | 553,306 |
| Mode M0 | |||
|---|---|---|---|
| Quadrant | BADHDUFLAG | Total packets | Discarded packets |
| A | 0 | 13583 | 0 |
| B | 0 | 13280 | 0 |
| C | 0 | 13890 | 0 |
| D | 0 | 19191 | 0 |
| Mode M9 | |||
|---|---|---|---|
| Quadrant | BADHDUFLAG | Total packets | Discarded packets |
| A | 0 | 23 | 0 |
| B | 0 | 24 | 0 |
| C | 0 | 24 | 0 |
| D | 0 | 24 | 0 |
| Quadrant | Total seconds | Saturated seconds | Saturation percentage |
|---|---|---|---|
| A | 6252 | 65 | 1.039667% |
| B | 6252 | 26 | 0.415867% |
| C | 6252 | 83 | 1.327575% |
| D | 6251 | 124 | 1.983683% |
Noise dominated data is calculated using 1-second bins in cleaned event files. If a bin has >2000 counts, and if more than 50% of those come from <1% of pixels, then it is considered to be noise-dominated and hence unusable.
| Quadrant | # 1 sec bins | Bins with >0 counts | Bins with >2000 counts | High rate bins dominated by noise | Noise dominated (total time) | Noise dominated (detector-on time) | Marked lightcurve |
|---|---|---|---|---|---|---|---|
| A | 7507 | 6253 | 17 | 17 | 0.23% | 0.27% | 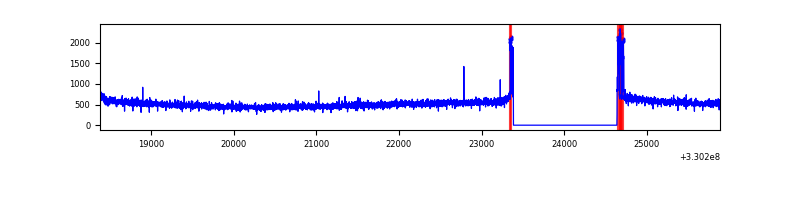 |
| B | 7507 | 6253 | 0 | 0 | 0.00% | 0.00% | 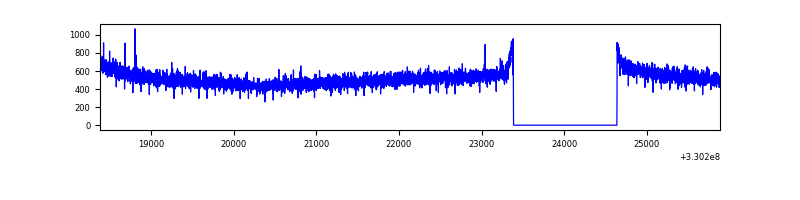 |
| C | 7507 | 6253 | 20 | 20 | 0.27% | 0.32% | 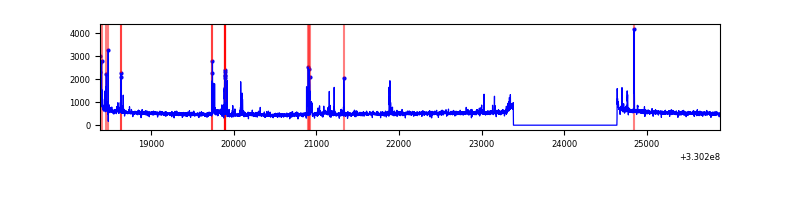 |
| D | 7506 | 6252 | 79 | 79 | 1.05% | 1.26% | 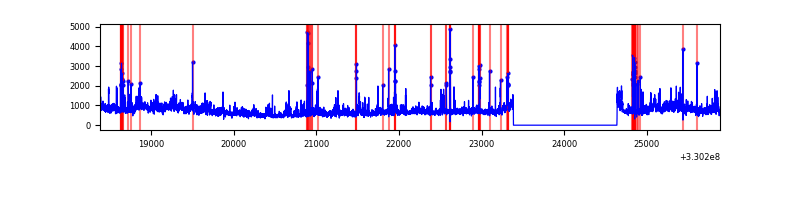 |
Top three noisy pixels from each quadrant. If the there are fewer than three noisy pixels in the level2.evt file, extra rows are filled as -1
| Pixel properties | Quadrant properties | ||||||
|---|---|---|---|---|---|---|---|
| Quadrant | DetID | PixID | Counts | Sigma | Mean | Median | Sigma |
| A | 6 | 16 | 137205 | 827.62 | 820 | 804 | 164.8 |
| A | 13 | 254 | 9211 | 51.01 | 820 | 804 | 164.8 |
| A | 3 | 137 | 7234 | 39.01 | 820 | 804 | 164.8 |
| B | 12 | 111 | 18405 | 114.03 | 823 | 805 | 154.3 |
| B | 11 | 111 | 16806 | 103.67 | 823 | 805 | 154.3 |
| B | 14 | 111 | 15712 | 96.58 | 823 | 805 | 154.3 |
| C | 2 | 16 | 240531 | 1311.61 | 782 | 788 | 182.8 |
| C | 14 | 238 | 127397 | 692.67 | 782 | 788 | 182.8 |
| C | 3 | 233 | 10067 | 50.76 | 782 | 788 | 182.8 |
| D | 1 | 52 | 977131 | 4755.0 | 770 | 755 | 205.3 |
| D | 8 | 195 | 965420 | 4697.97 | 770 | 755 | 205.3 |
| D | 2 | 234 | 25534 | 120.67 | 770 | 755 | 205.3 |
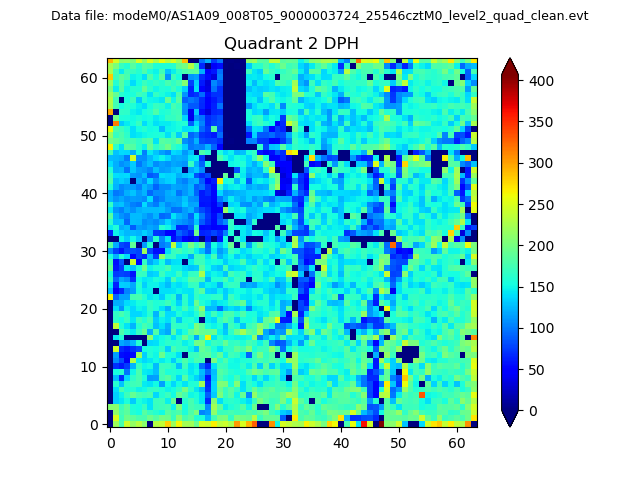
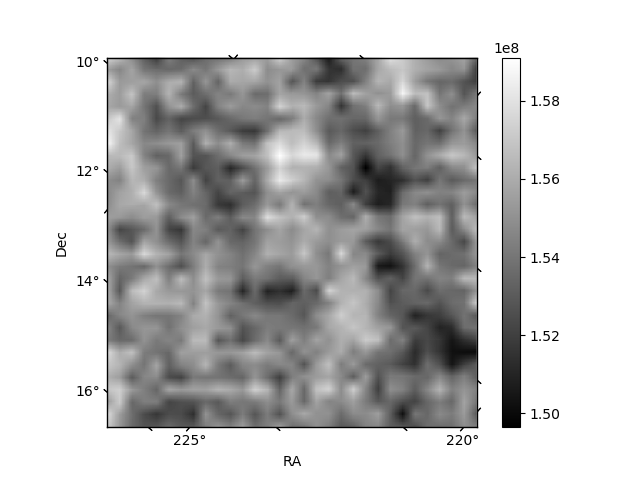
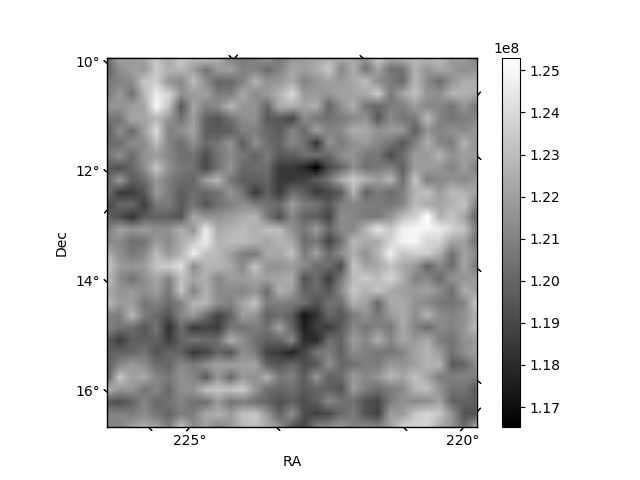
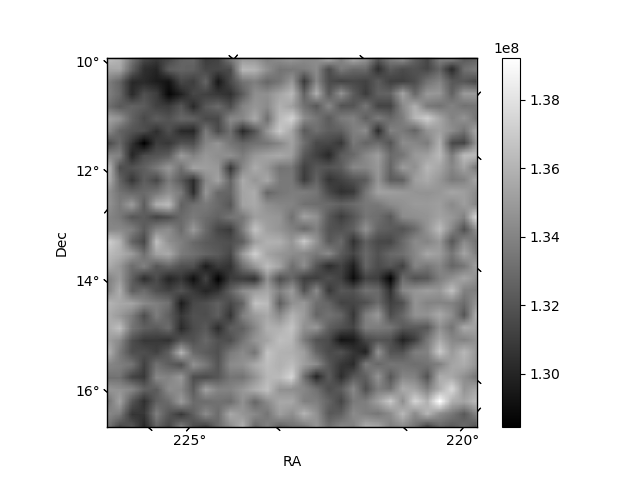
Histogram calculated using DETX and DETY for each event in the final _common_clean file
| Quadrant A | 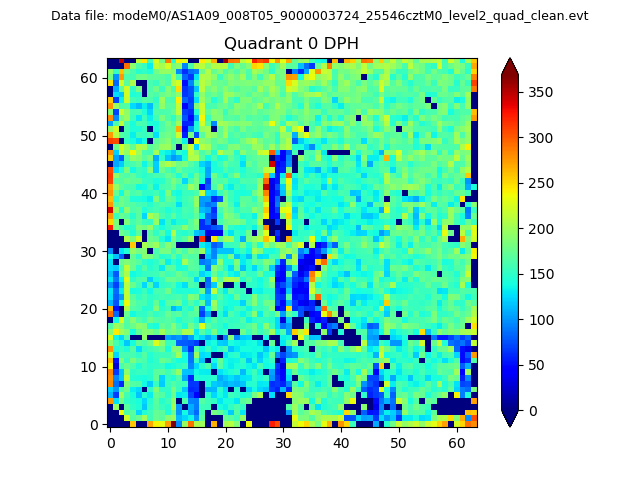 |
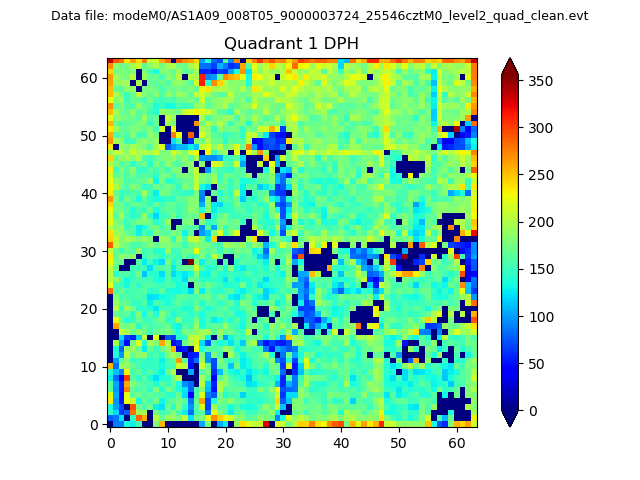 |
Quadrant B |
|---|---|---|---|
| Quadrant D | 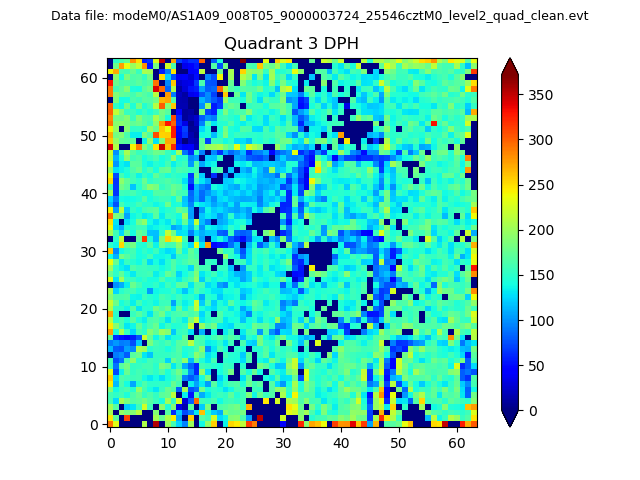 |
 |
Quadrant C |
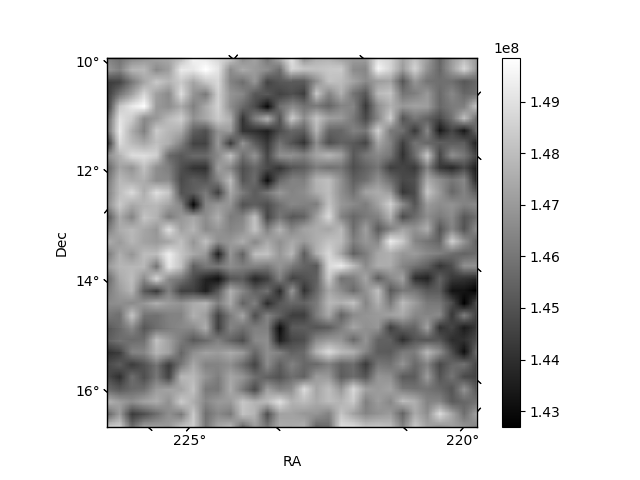
| Plot type | Count rate plots | Images |
|---|---|---|
| Comparison with Poisson distribution Blue bars denote a histogram of data divided into 1 sec bins. Red curve is a Poisson curve with rate = median count rate of data. |
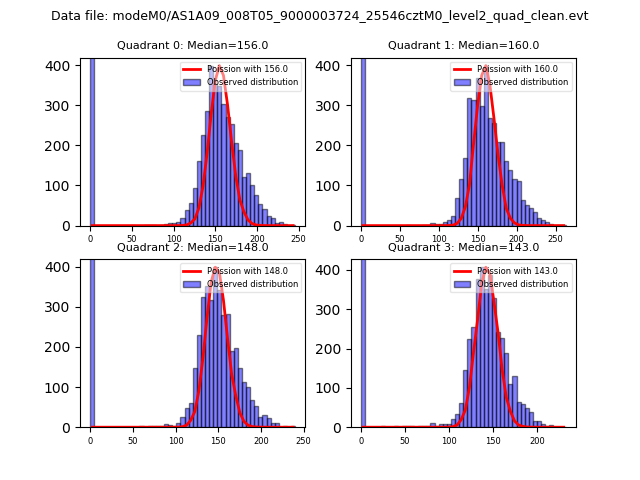 |
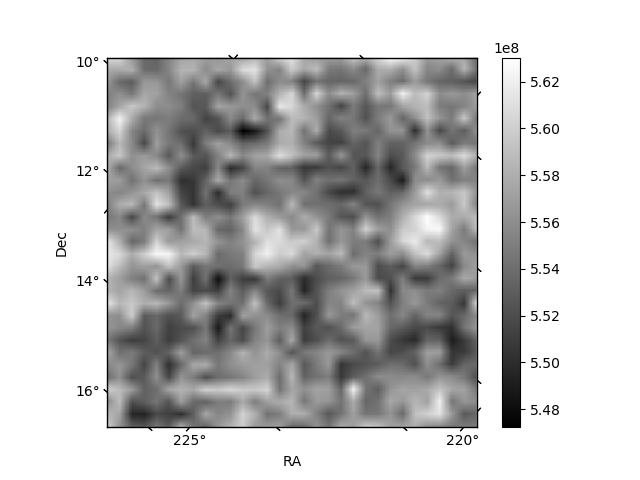 |
| Quadrant-wise count rates Data is divided into 100 sec bins |
 |
|
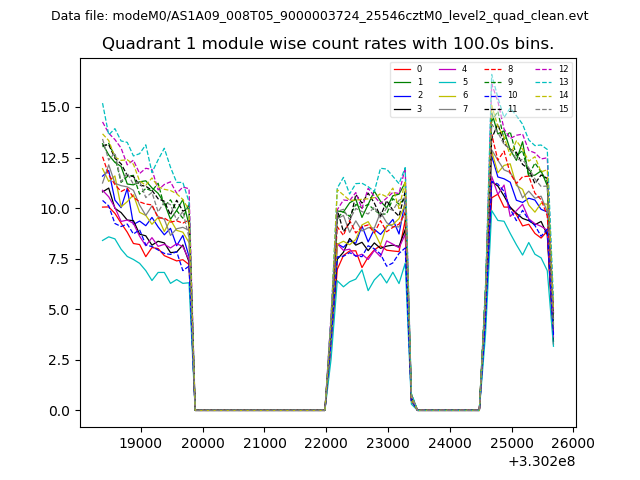
| Module-wise count rates for Quadrant A Data is divided into 100 sec bins |
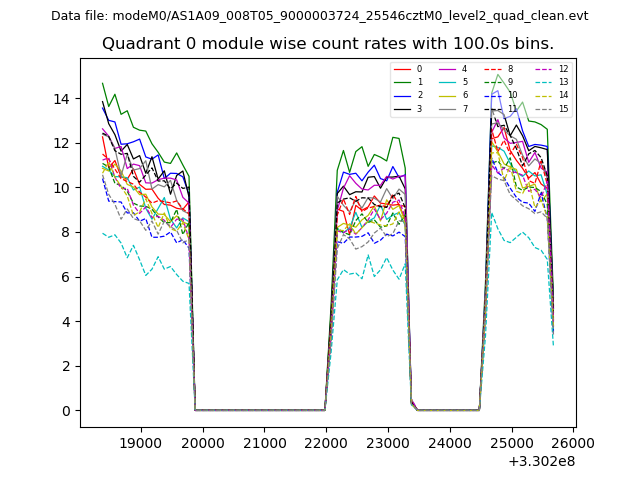 |
 |
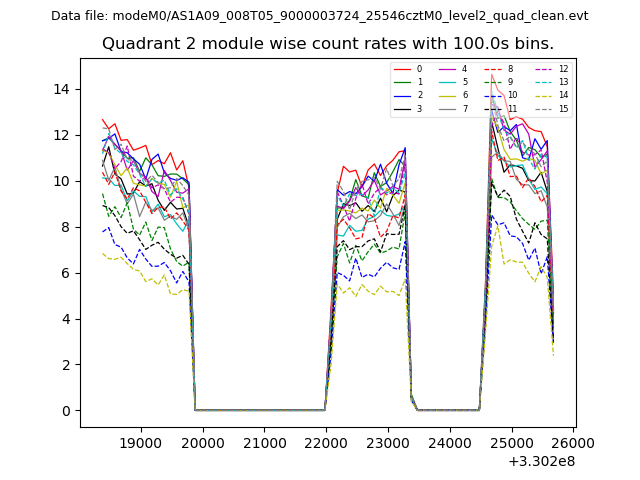
| Module-wise count rates for Quadrant B Data is divided into 100 sec bins |
 |
 |
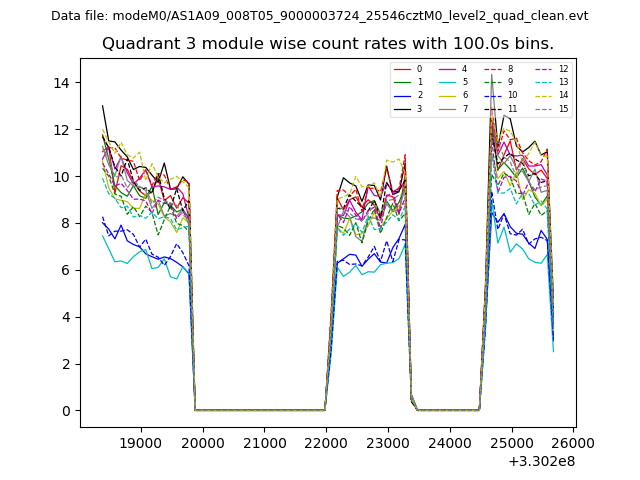
| Module-wise count rates for Quadrant C Data is divided into 100 sec bins |
 |
 |
| Module-wise count rates for Quadrant D Data is divided into 100 sec bins |
 |
 |
| Parameter | Plot |
|---|---|
| CZT HV Monitor | 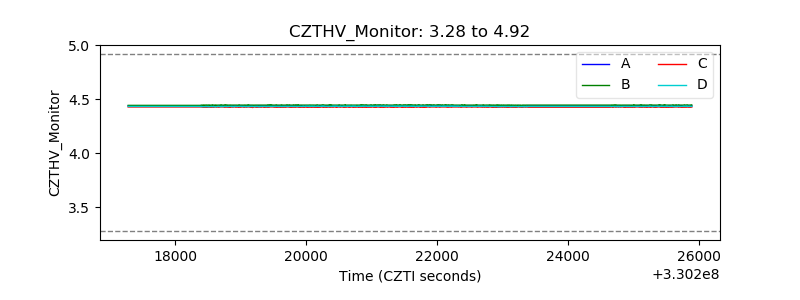 |
| D_VDD | 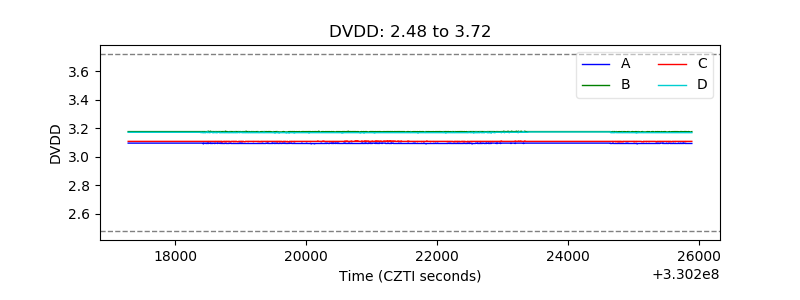 |
| Temperature 1 | 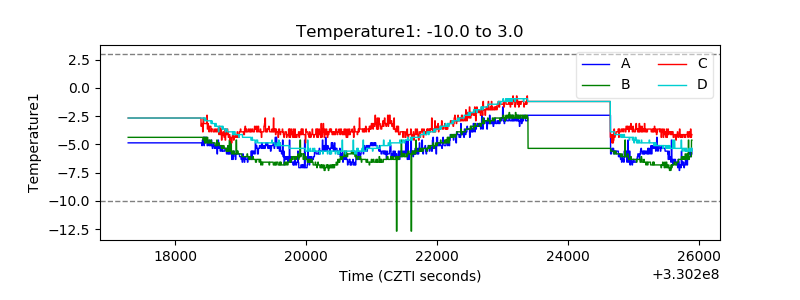 |
| Veto HV Monitor | 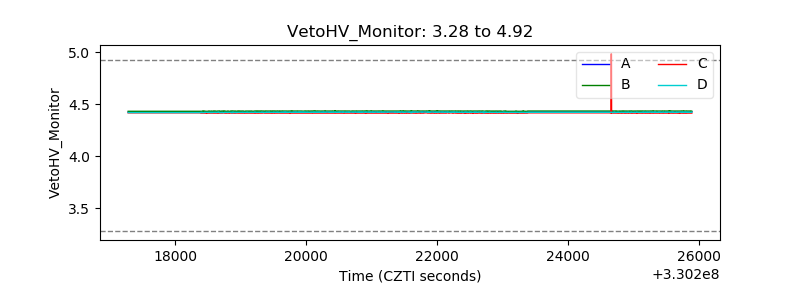 |
| Veto LLD | 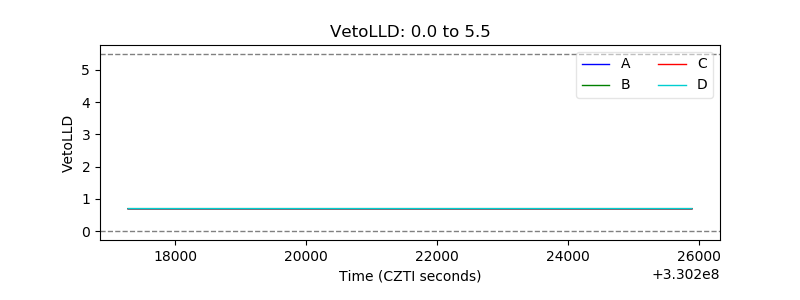 |
| Alpha Counter | 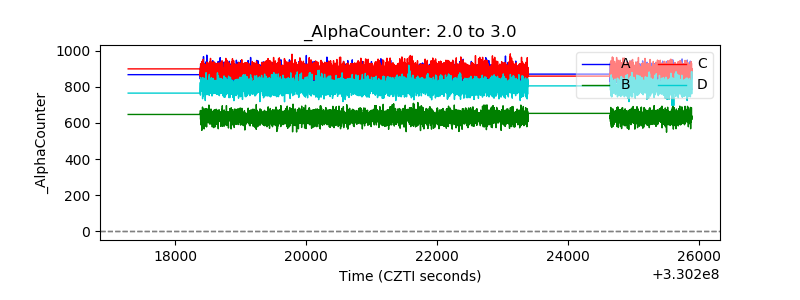 |
| _CPM_Rate | 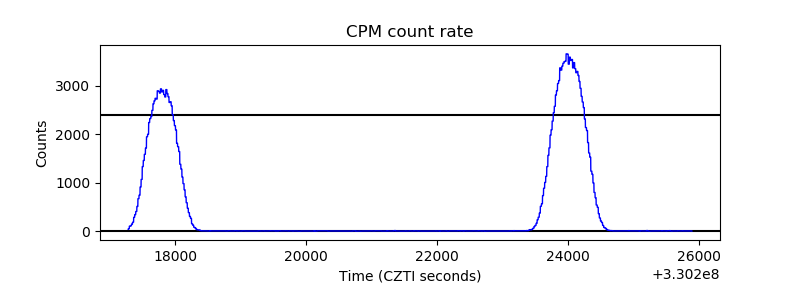 |
| CZT Counter | 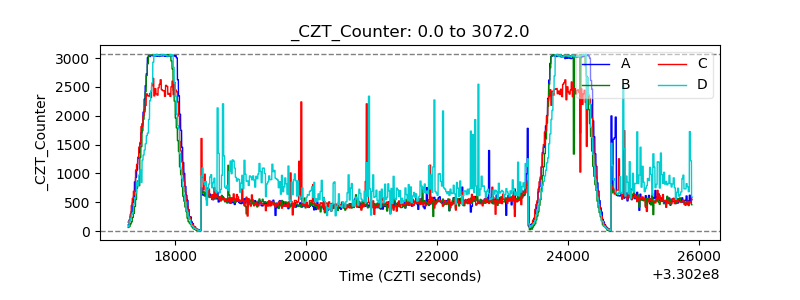 |
| +2.5 Volts monitor |  |
| +5 Volts monitor |  |
| _ROLL_ROT | 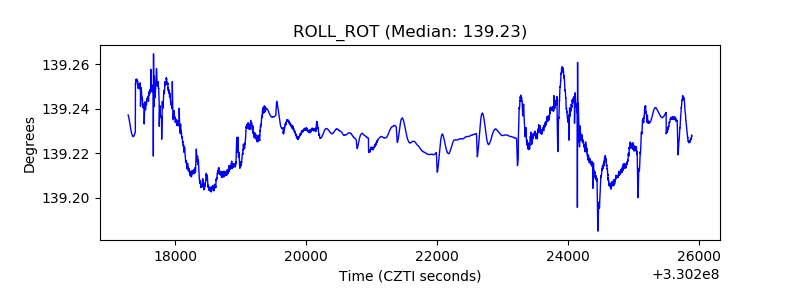 |
| _Roll_DEC | 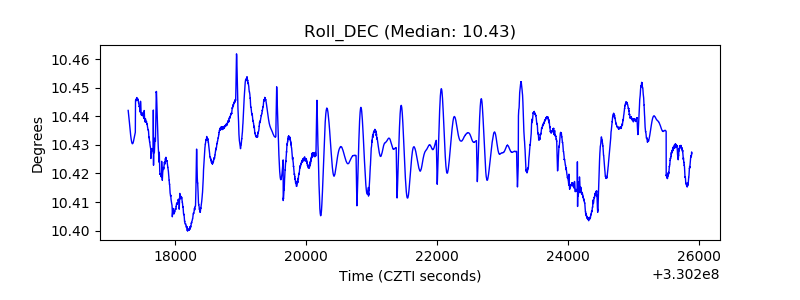 |
| _Roll_RA | 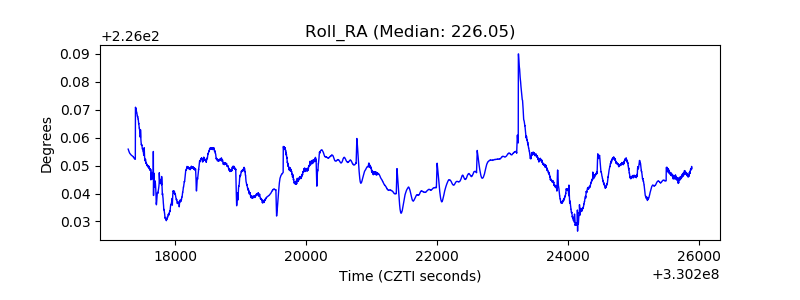 |
| Veto Counter | 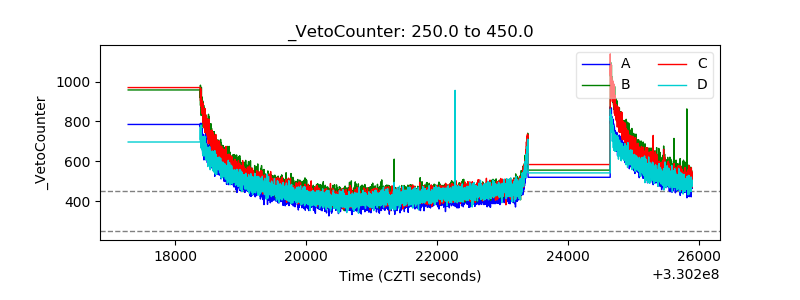 |