| Param | Original file | Final file |
|---|---|---|
| Filename | modeM0/AS1A09_008T05_9000003724_25547cztM0_level2.evt | modeM0/AS1A09_008T05_9000003724_25547cztM0_level2_quad_clean.evt |
| Size (bytes) | 506,226,240 | 87,690,240 |
| Size | 482.8 MB | 83.6 MB |
| Events in quadrant A | 3,622,065 | 569,197 |
| Events in quadrant B | 3,366,008 | 590,269 |
| Events in quadrant C | 3,356,582 | 540,241 |
| Events in quadrant D | 4,563,655 | 520,256 |
| Mode M0 | |||
|---|---|---|---|
| Quadrant | BADHDUFLAG | Total packets | Discarded packets |
| A | 0 | 14402 | 0 |
| B | 0 | 13613 | 0 |
| C | 0 | 13627 | 0 |
| D | 0 | 17889 | 0 |
| Mode M9 | |||
|---|---|---|---|
| Quadrant | BADHDUFLAG | Total packets | Discarded packets |
| A | 0 | 26 | 0 |
| B | 0 | 26 | 0 |
| C | 0 | 26 | 0 |
| D | 0 | 26 | 0 |
| Quadrant | Total seconds | Saturated seconds | Saturation percentage |
|---|---|---|---|
| A | 6242 | 116 | 1.858379% |
| B | 6243 | 55 | 0.880987% |
| C | 6243 | 85 | 1.361525% |
| D | 6242 | 117 | 1.874399% |
Noise dominated data is calculated using 1-second bins in cleaned event files. If a bin has >2000 counts, and if more than 50% of those come from <1% of pixels, then it is considered to be noise-dominated and hence unusable.
| Quadrant | # 1 sec bins | Bins with >0 counts | Bins with >2000 counts | High rate bins dominated by noise | Noise dominated (total time) | Noise dominated (detector-on time) | Marked lightcurve |
|---|---|---|---|---|---|---|---|
| A | 8817 | 6244 | 25 | 25 | 0.28% | 0.40% | 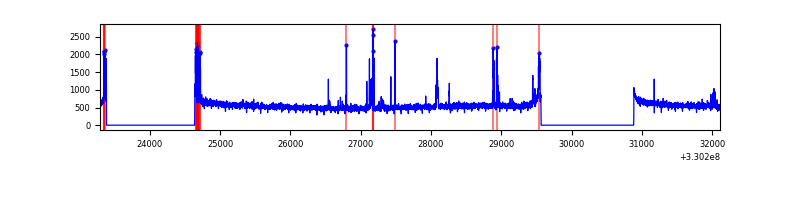 |
| B | 8818 | 6245 | 0 | 0 | 0.00% | 0.00% | 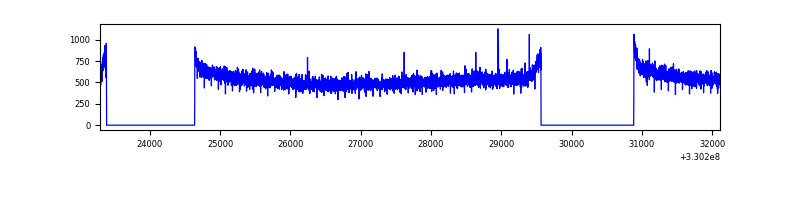 |
| C | 8818 | 6245 | 1 | 1 | 0.01% | 0.02% | 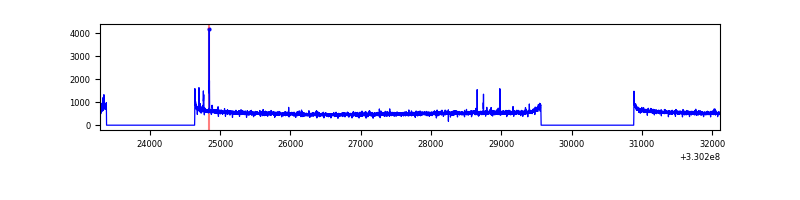 |
| D | 8817 | 6244 | 56 | 56 | 0.64% | 0.90% | 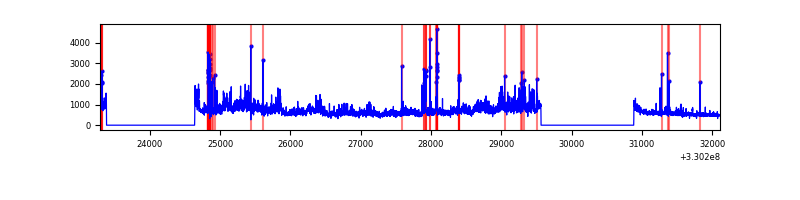 |
Top three noisy pixels from each quadrant. If the there are fewer than three noisy pixels in the level2.evt file, extra rows are filled as -1
| Pixel properties | Quadrant properties | ||||||
|---|---|---|---|---|---|---|---|
| Quadrant | DetID | PixID | Counts | Sigma | Mean | Median | Sigma |
| A | 6 | 16 | 317807 | 1861.65 | 858 | 844 | 170.3 |
| A | 13 | 254 | 9016 | 48.0 | 858 | 844 | 170.3 |
| A | 3 | 137 | 7298 | 37.91 | 858 | 844 | 170.3 |
| B | 12 | 111 | 19119 | 113.84 | 861 | 842 | 160.5 |
| B | 11 | 111 | 17240 | 102.14 | 861 | 842 | 160.5 |
| B | 14 | 111 | 16224 | 95.81 | 861 | 842 | 160.5 |
| C | 14 | 238 | 134240 | 705.14 | 815 | 823 | 189.2 |
| C | 2 | 16 | 37474 | 193.71 | 815 | 823 | 189.2 |
| C | 13 | 61 | 5548 | 24.97 | 815 | 823 | 189.2 |
| D | 8 | 195 | 823993 | 3777.04 | 804 | 788 | 217.9 |
| D | 1 | 52 | 583778 | 2674.88 | 804 | 788 | 217.9 |
| D | 12 | 217 | 44213 | 199.24 | 804 | 788 | 217.9 |
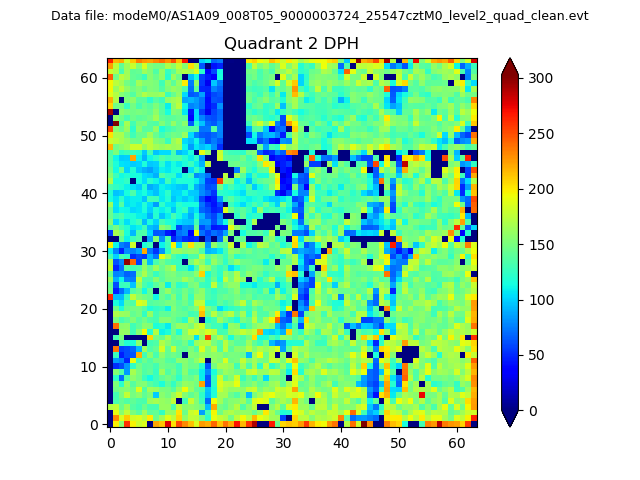
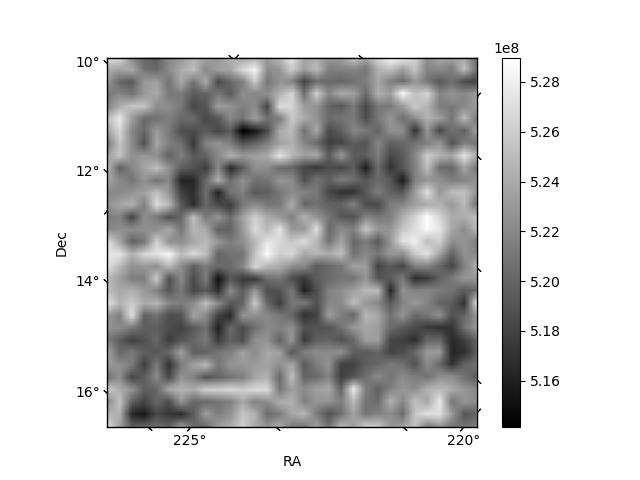
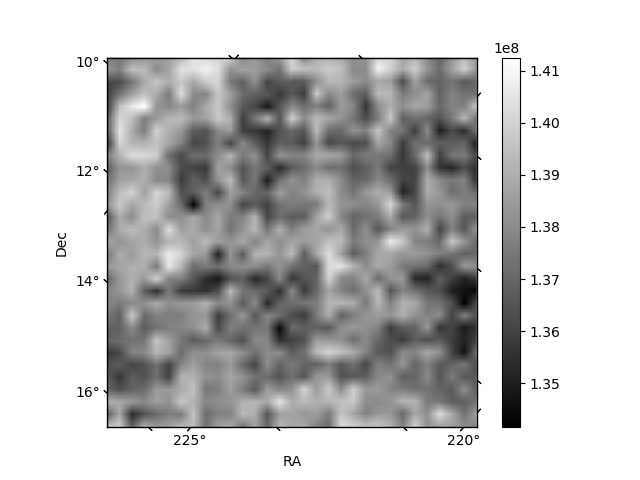
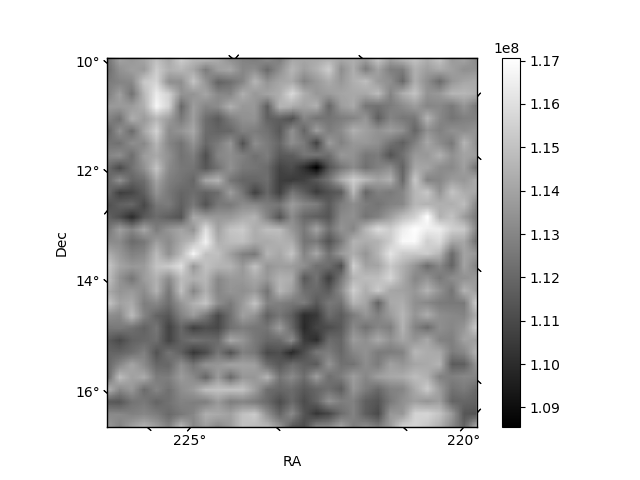
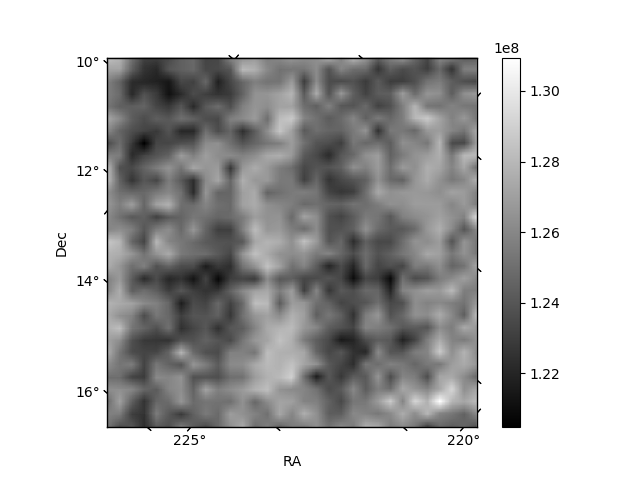
Histogram calculated using DETX and DETY for each event in the final _common_clean file
| Quadrant A | 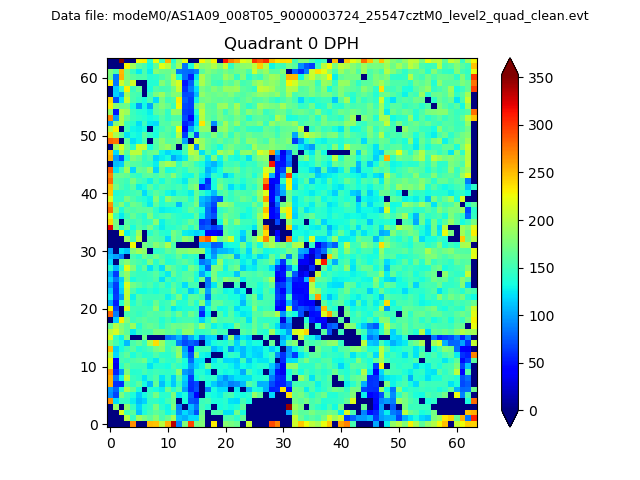 |
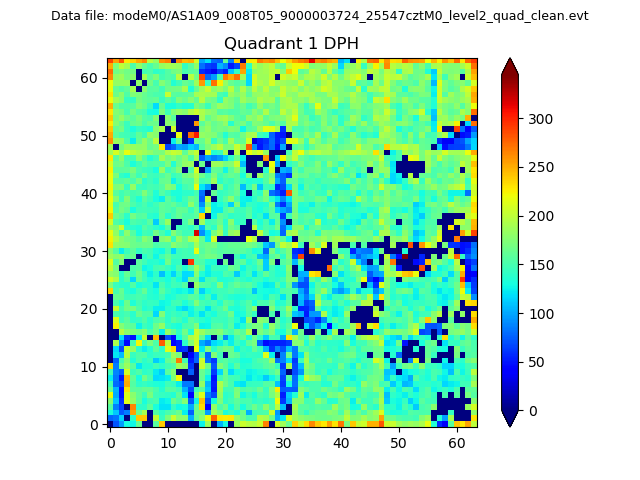 |
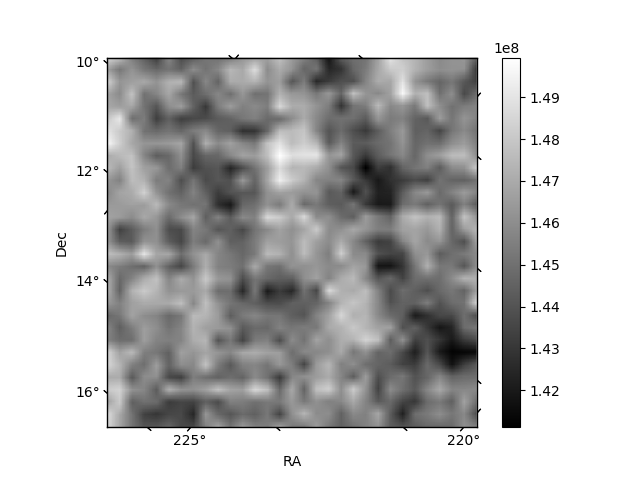
Quadrant B |
|---|---|---|---|
| Quadrant D | 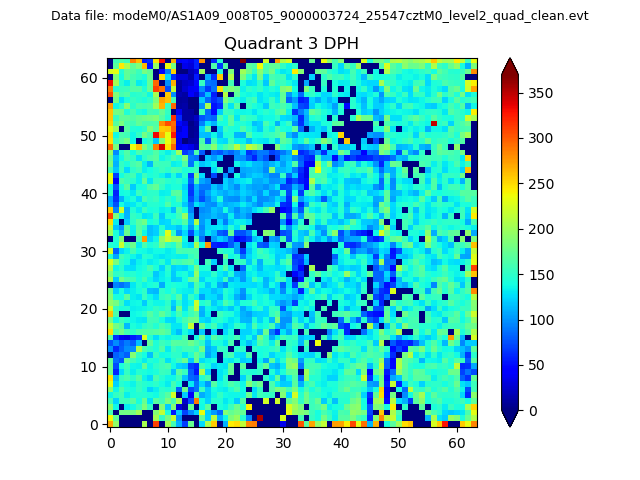 |
 |
Quadrant C |
| Plot type | Count rate plots | Images |
|---|---|---|
| Comparison with Poisson distribution Blue bars denote a histogram of data divided into 1 sec bins. Red curve is a Poisson curve with rate = median count rate of data. |
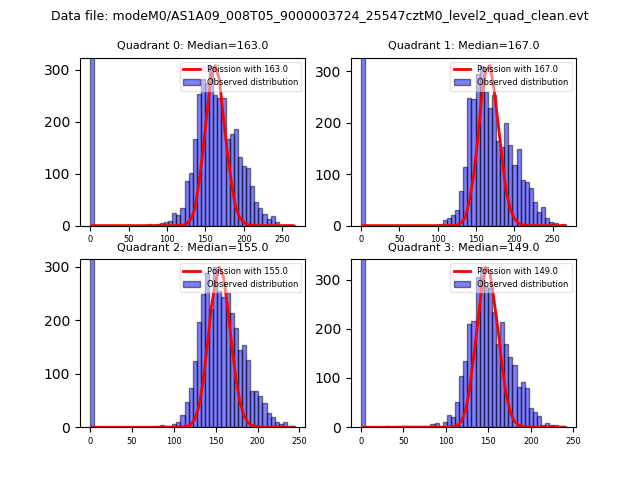 |
 |
| Quadrant-wise count rates Data is divided into 100 sec bins |
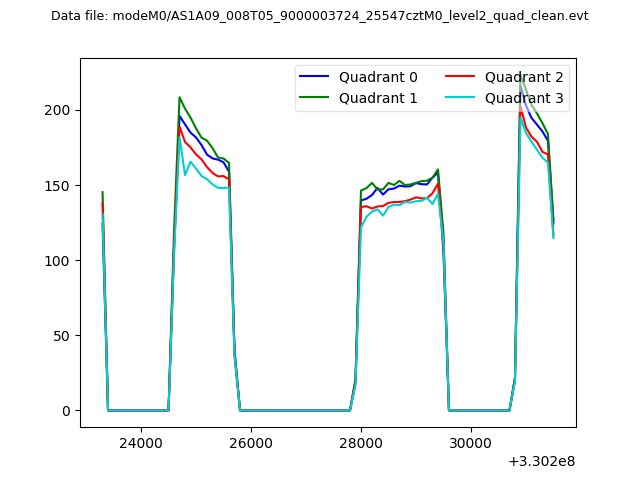 |
|
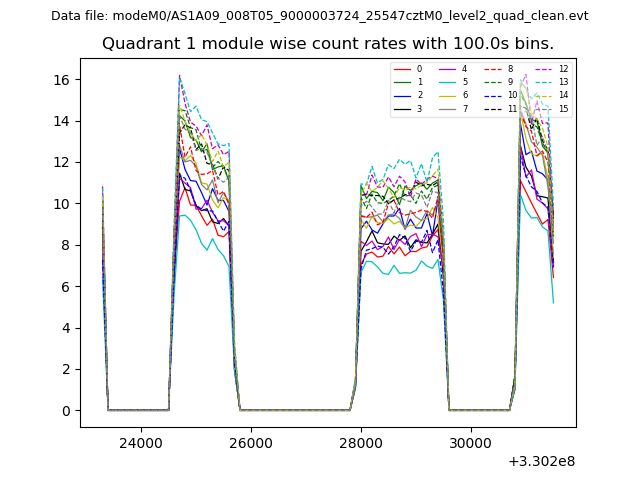
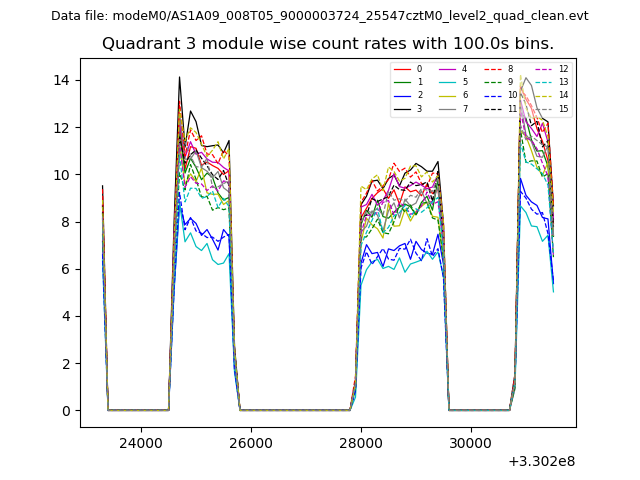
| Module-wise count rates for Quadrant A Data is divided into 100 sec bins |
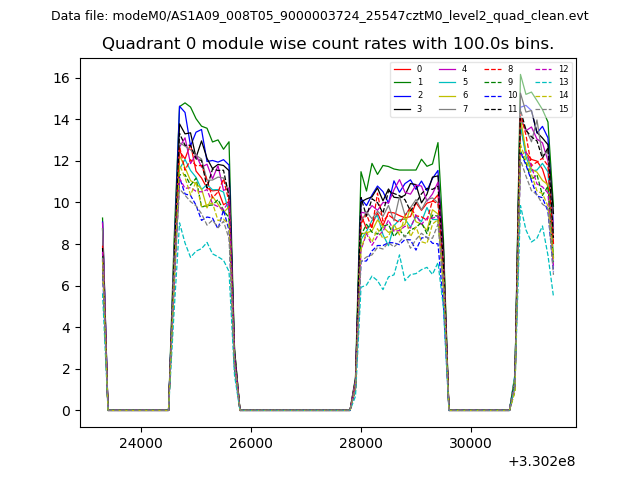 |
 |
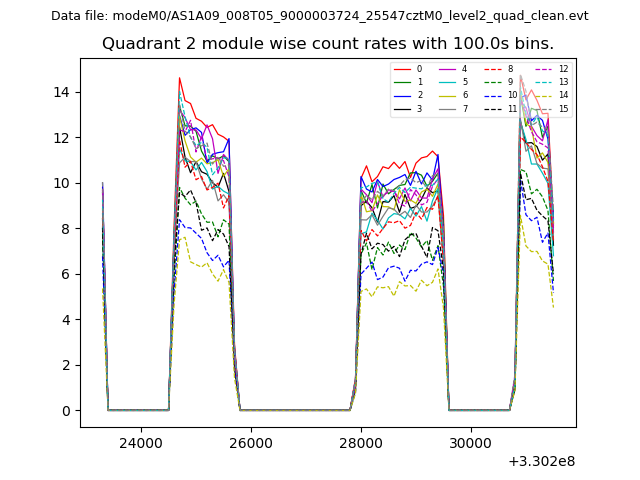
| Module-wise count rates for Quadrant B Data is divided into 100 sec bins |
 |
 |
| Module-wise count rates for Quadrant C Data is divided into 100 sec bins |
 |
 |
| Module-wise count rates for Quadrant D Data is divided into 100 sec bins |
 |
 |
| Parameter | Plot |
|---|---|
| CZT HV Monitor | 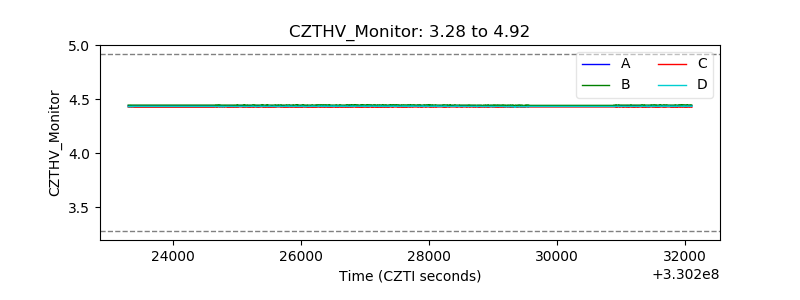 |
| D_VDD | 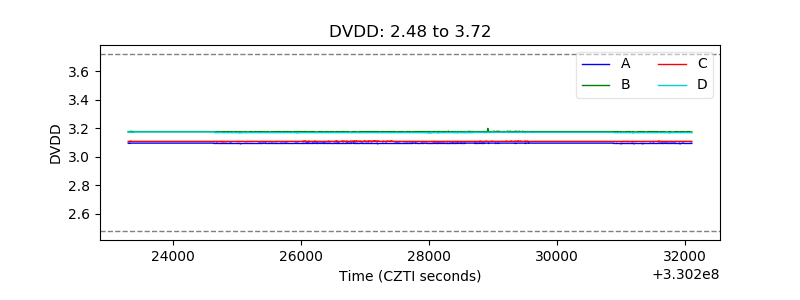 |
| Temperature 1 | 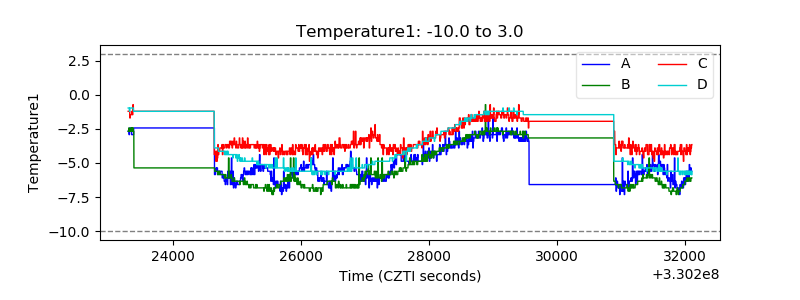 |
| Veto HV Monitor | 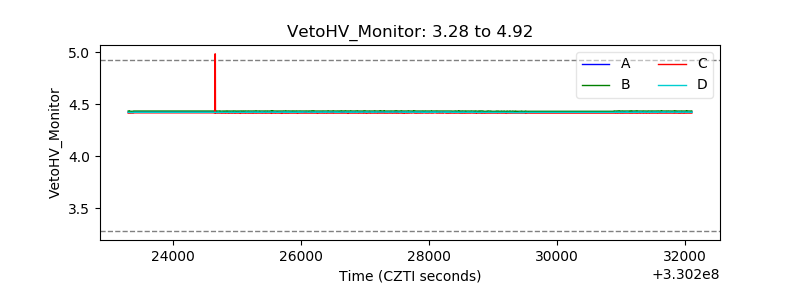 |
| Veto LLD | 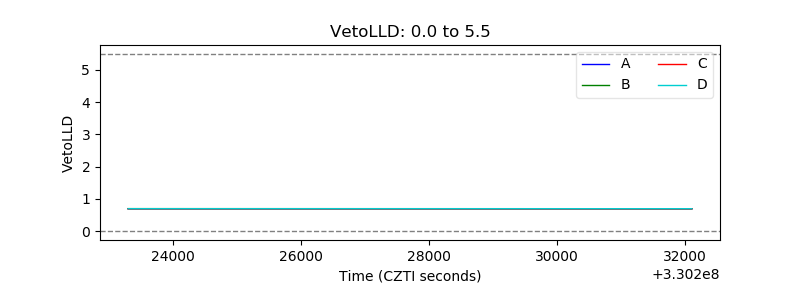 |
| Alpha Counter | 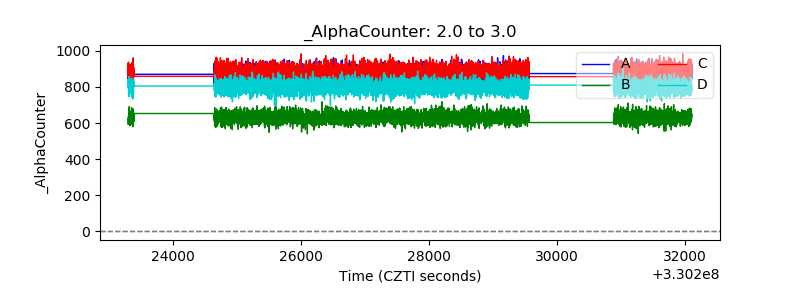 |
| _CPM_Rate | 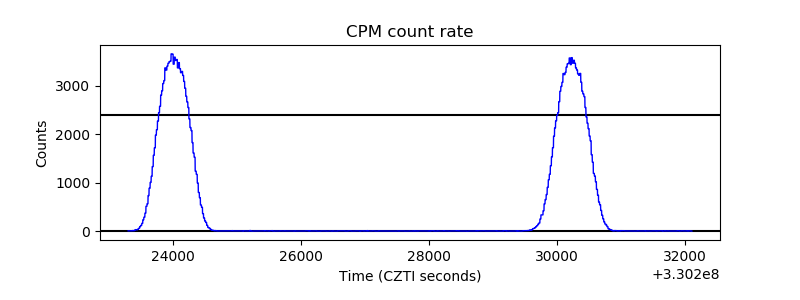 |
| CZT Counter | 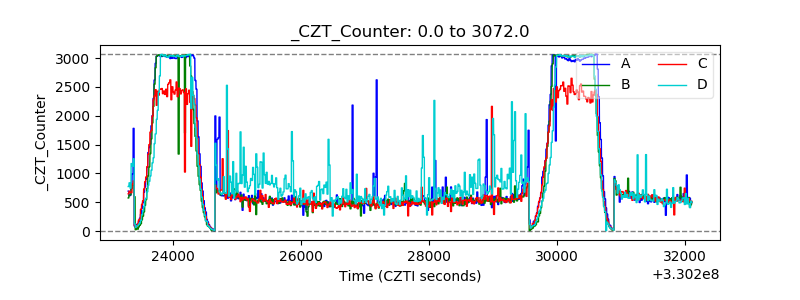 |
| +2.5 Volts monitor | 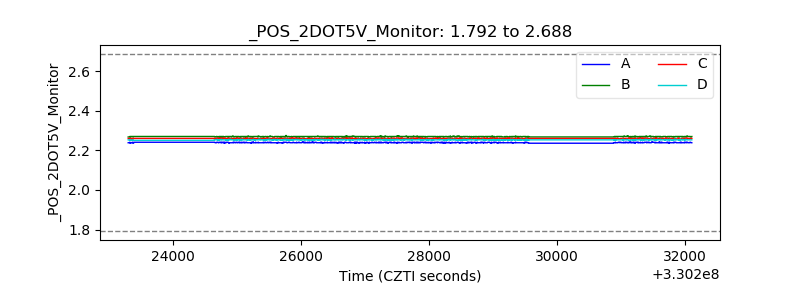 |
| +5 Volts monitor |  |
| _ROLL_ROT | 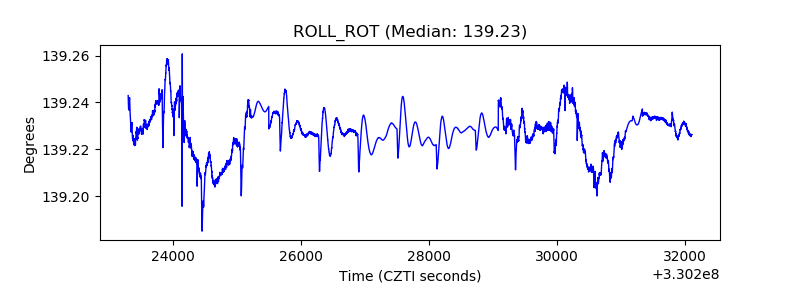 |
| _Roll_DEC | 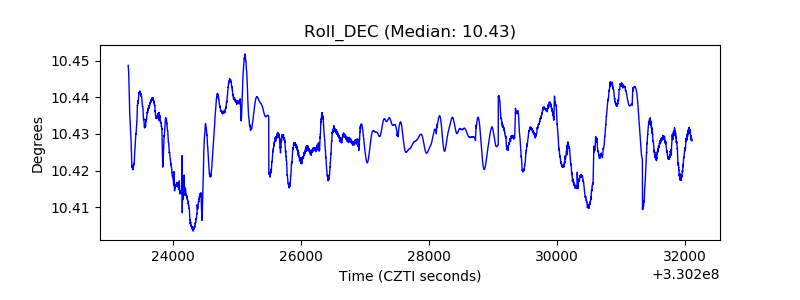 |
| _Roll_RA | 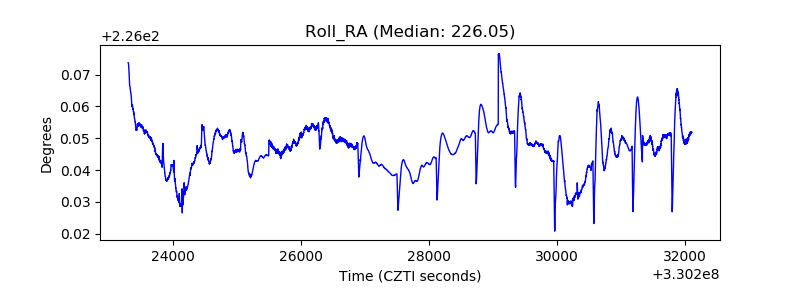 |
| Veto Counter | 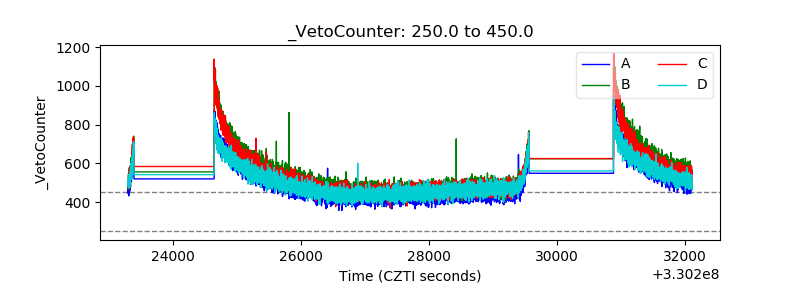 |