| Param | Original file | Final file |
|---|---|---|
| Filename | modeM0/AS1A09_008T05_9000003724_25548cztM0_level2.evt | modeM0/AS1A09_008T05_9000003724_25548cztM0_level2_quad_clean.evt |
| Size (bytes) | 471,594,240 | 75,286,080 |
| Size | 449.7 MB | 71.8 MB |
| Events in quadrant A | 3,531,421 | 478,928 |
| Events in quadrant B | 3,314,721 | 490,878 |
| Events in quadrant C | 3,260,160 | 448,395 |
| Events in quadrant D | 3,764,306 | 437,847 |
| Mode M0 | |||
|---|---|---|---|
| Quadrant | BADHDUFLAG | Total packets | Discarded packets |
| A | 0 | 13985 | 0 |
| B | 0 | 13278 | 0 |
| C | 0 | 13134 | 0 |
| D | 0 | 15041 | 0 |
| Mode M9 | |||
|---|---|---|---|
| Quadrant | BADHDUFLAG | Total packets | Discarded packets |
| A | 0 | 14 | 0 |
| B | 0 | 15 | 0 |
| C | 0 | 15 | 0 |
| D | 0 | 15 | 0 |
| Quadrant | Total seconds | Saturated seconds | Saturation percentage |
|---|---|---|---|
| A | 6073 | 40 | 0.658653% |
| B | 6073 | 45 | 0.740985% |
| C | 6073 | 63 | 1.037379% |
| D | 6072 | 69 | 1.136364% |
Noise dominated data is calculated using 1-second bins in cleaned event files. If a bin has >2000 counts, and if more than 50% of those come from <1% of pixels, then it is considered to be noise-dominated and hence unusable.
| Quadrant | # 1 sec bins | Bins with >0 counts | Bins with >2000 counts | High rate bins dominated by noise | Noise dominated (total time) | Noise dominated (detector-on time) | Marked lightcurve |
|---|---|---|---|---|---|---|---|
| A | 7449 | 6074 | 15 | 15 | 0.20% | 0.25% | 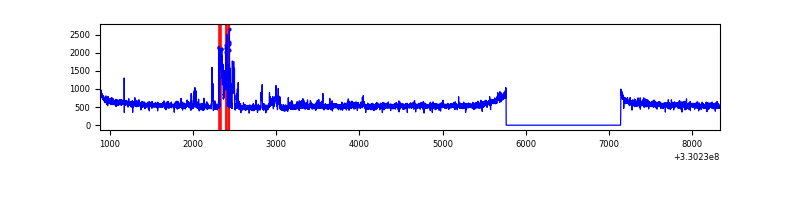 |
| B | 7449 | 6074 | 1 | 1 | 0.01% | 0.02% | 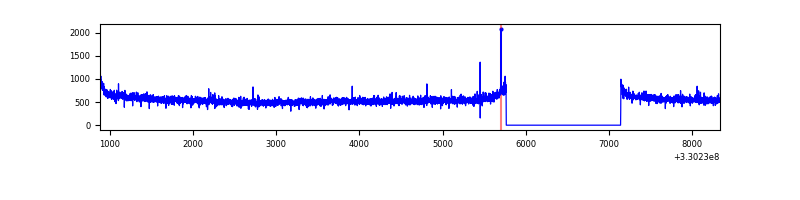 |
| C | 7449 | 6074 | 0 | 0 | 0.00% | 0.00% | 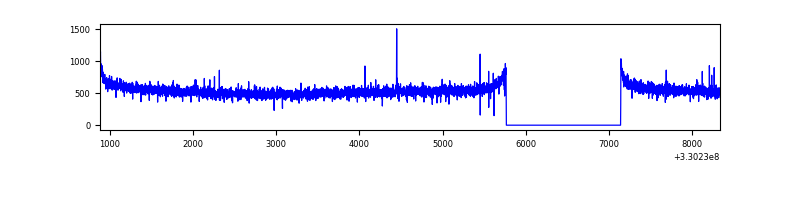 |
| D | 7448 | 6073 | 45 | 45 | 0.60% | 0.74% | 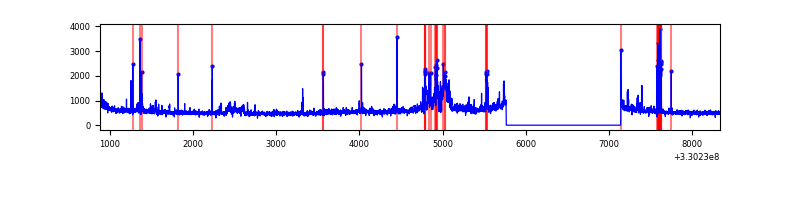 |
Top three noisy pixels from each quadrant. If the there are fewer than three noisy pixels in the level2.evt file, extra rows are filled as -1
| Pixel properties | Quadrant properties | ||||||
|---|---|---|---|---|---|---|---|
| Quadrant | DetID | PixID | Counts | Sigma | Mean | Median | Sigma |
| A | 6 | 16 | 246275 | 1470.9 | 849 | 838 | 166.9 |
| A | 5 | 203 | 12492 | 69.84 | 849 | 838 | 166.9 |
| A | 13 | 254 | 9202 | 50.13 | 849 | 838 | 166.9 |
| B | 12 | 111 | 18890 | 113.71 | 848 | 830 | 158.8 |
| B | 11 | 111 | 16841 | 100.81 | 848 | 830 | 158.8 |
| B | 14 | 111 | 16073 | 95.98 | 848 | 830 | 158.8 |
| C | 14 | 238 | 131146 | 703.61 | 796 | 803 | 185.2 |
| C | 3 | 233 | 10517 | 52.44 | 796 | 803 | 185.2 |
| C | 2 | 16 | 10163 | 50.53 | 796 | 803 | 185.2 |
| D | 1 | 52 | 471421 | 2231.06 | 793 | 777 | 211.0 |
| D | 8 | 195 | 192627 | 909.45 | 793 | 777 | 211.0 |
| D | 2 | 244 | 63116 | 295.51 | 793 | 777 | 211.0 |
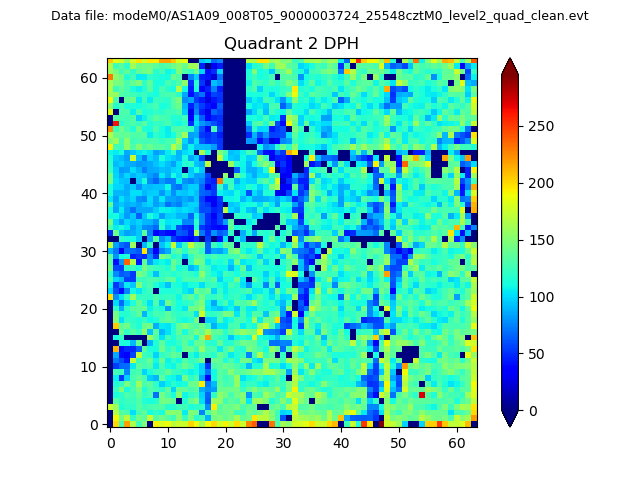
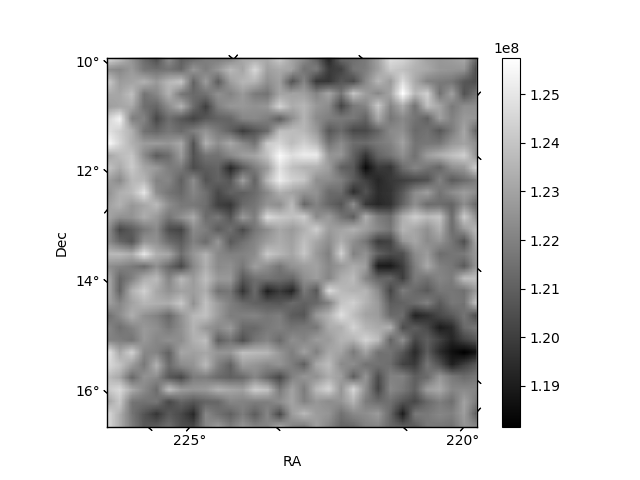
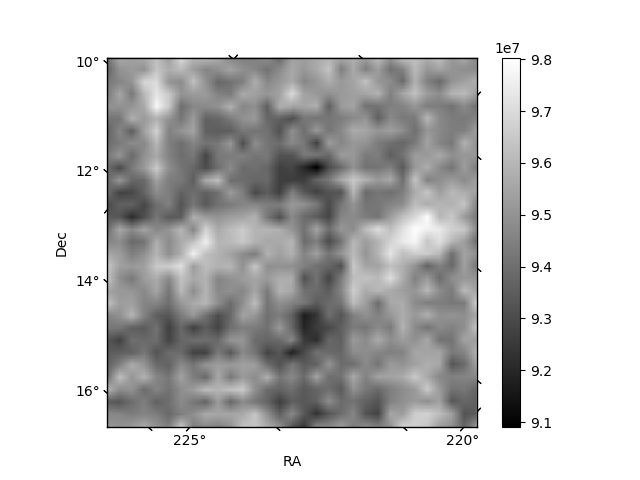
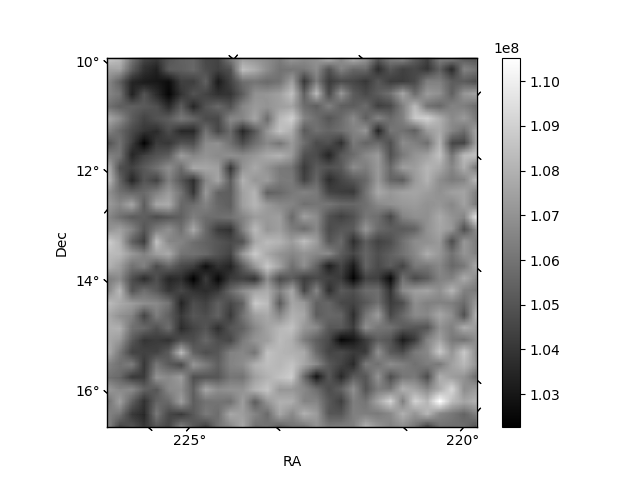
Histogram calculated using DETX and DETY for each event in the final _common_clean file
| Quadrant A | 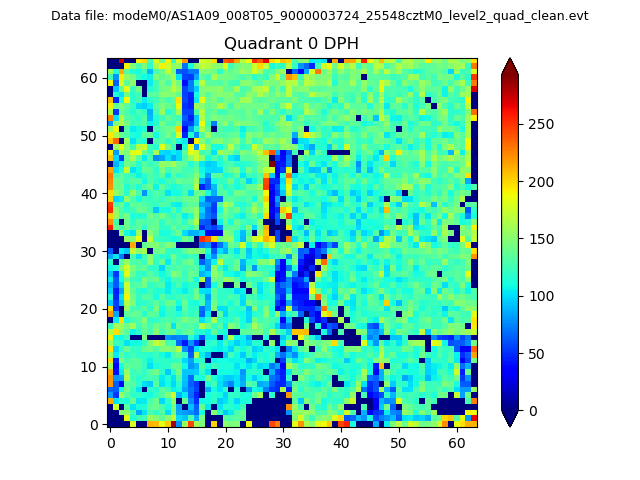 |
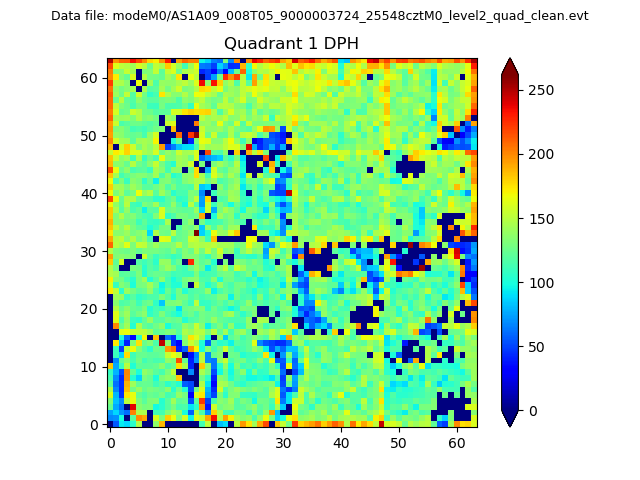 |
Quadrant B |
|---|---|---|---|
| Quadrant D | 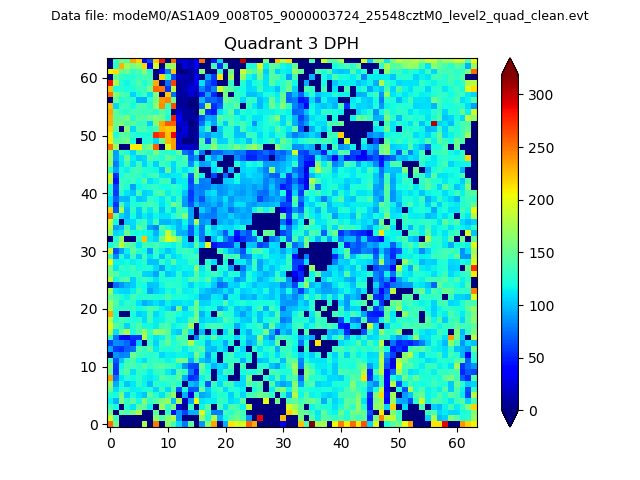 |
 |
Quadrant C |
| Plot type | Count rate plots | Images |
|---|---|---|
| Comparison with Poisson distribution Blue bars denote a histogram of data divided into 1 sec bins. Red curve is a Poisson curve with rate = median count rate of data. |
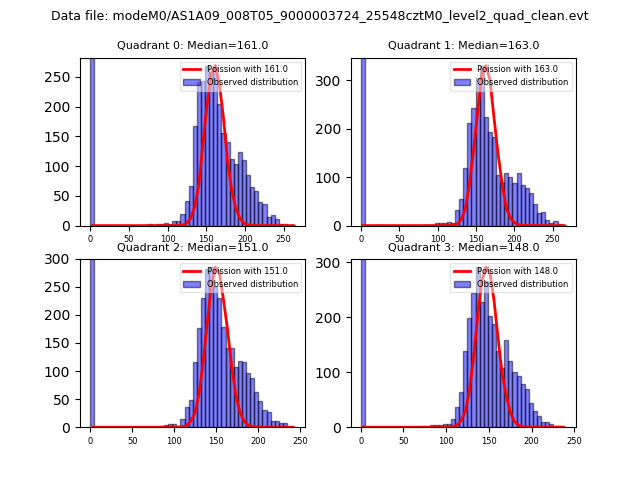 |
 |
| Quadrant-wise count rates Data is divided into 100 sec bins |
 |
|
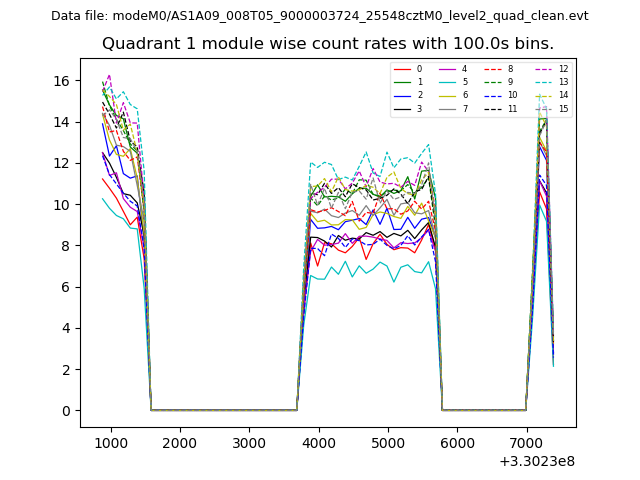
| Module-wise count rates for Quadrant A Data is divided into 100 sec bins |
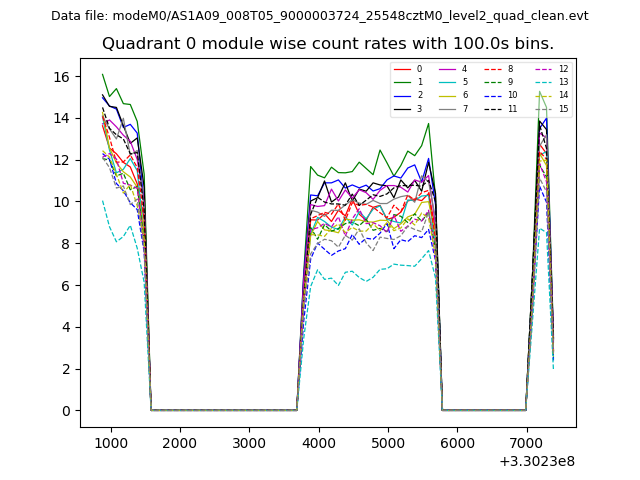 |
 |
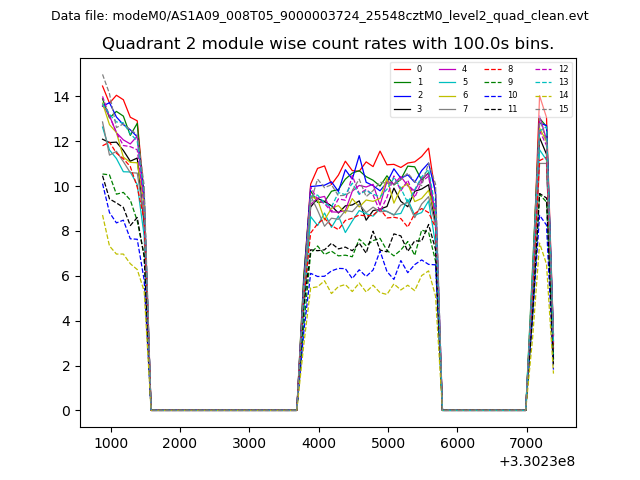
| Module-wise count rates for Quadrant B Data is divided into 100 sec bins |
 |
 |
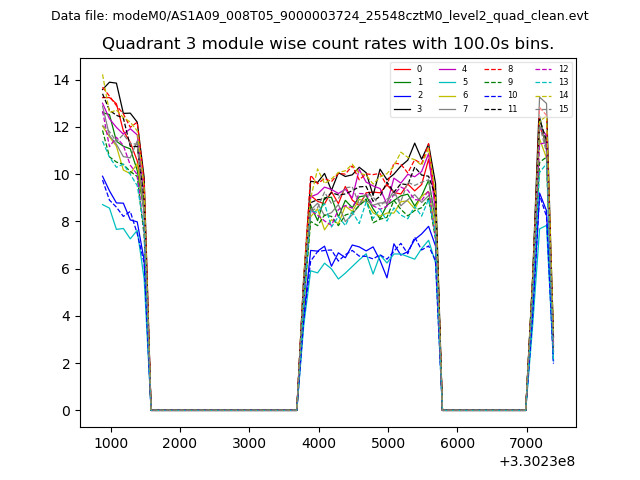
| Module-wise count rates for Quadrant C Data is divided into 100 sec bins |
 |
 |
| Module-wise count rates for Quadrant D Data is divided into 100 sec bins |
 |
 |
| Parameter | Plot |
|---|---|
| CZT HV Monitor | 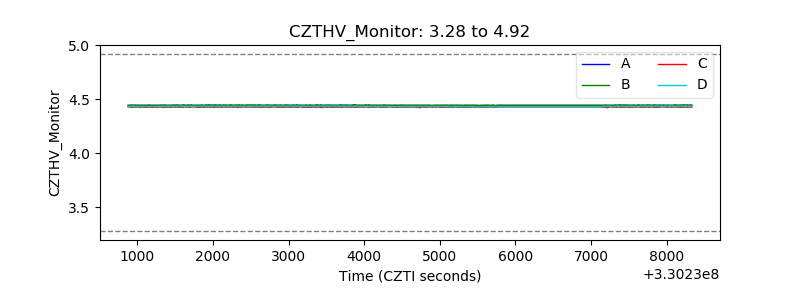 |
| D_VDD |  |
| Temperature 1 | 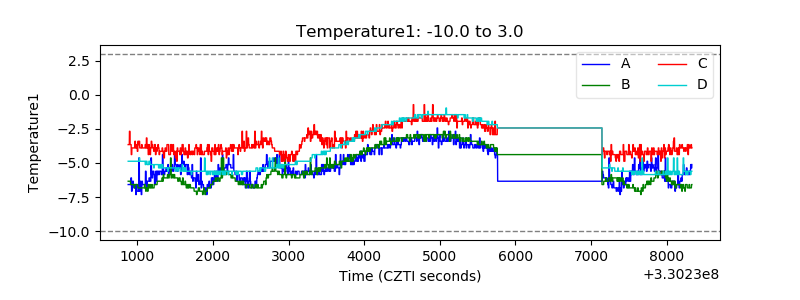 |
| Veto HV Monitor | 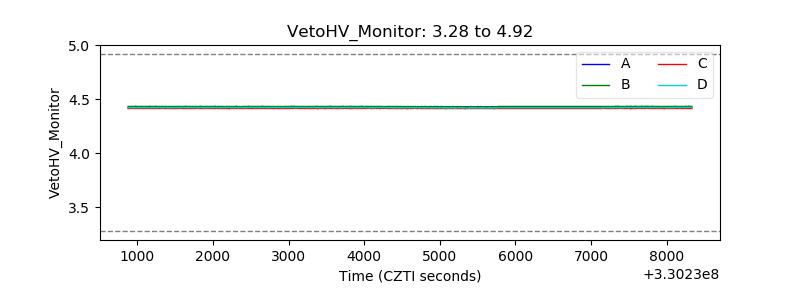 |
| Veto LLD | 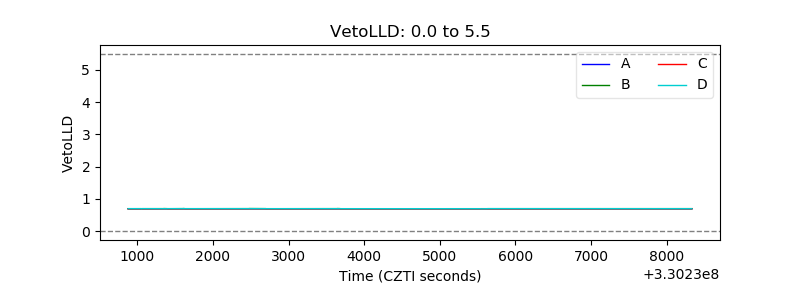 |
| Alpha Counter |  |
| _CPM_Rate | 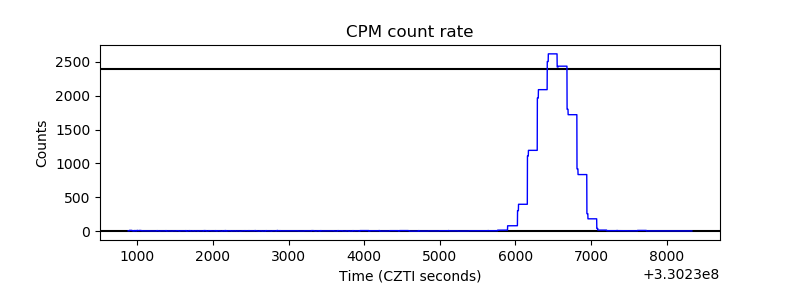 |
| CZT Counter | 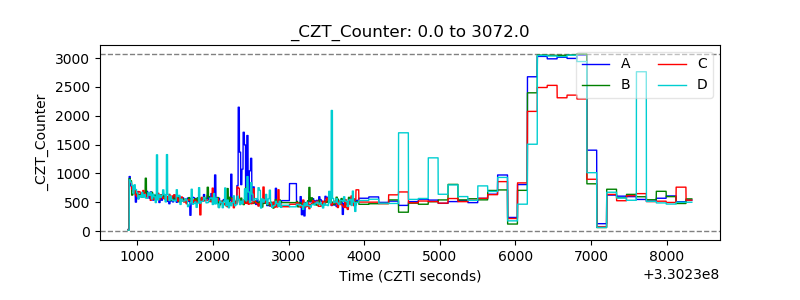 |
| +2.5 Volts monitor |  |
| +5 Volts monitor |  |
| _ROLL_ROT | 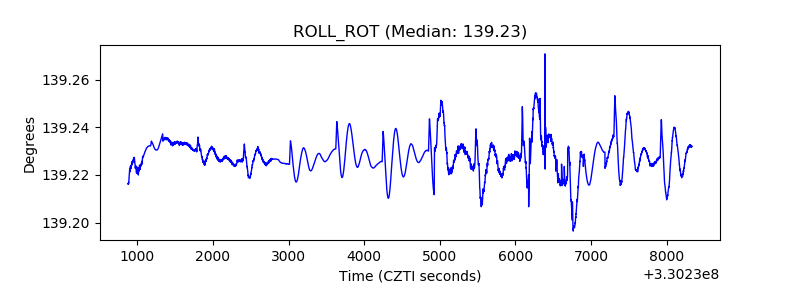 |
| _Roll_DEC | 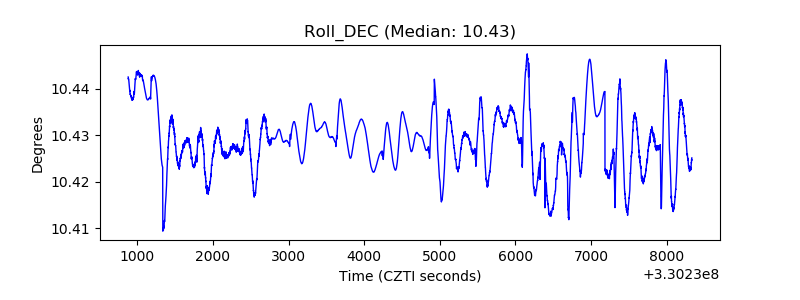 |
| _Roll_RA | 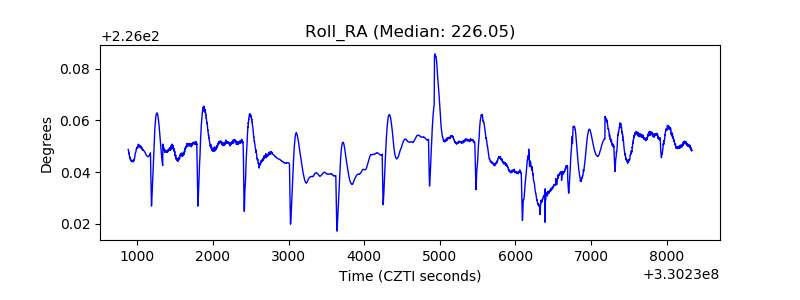 |
| Veto Counter | 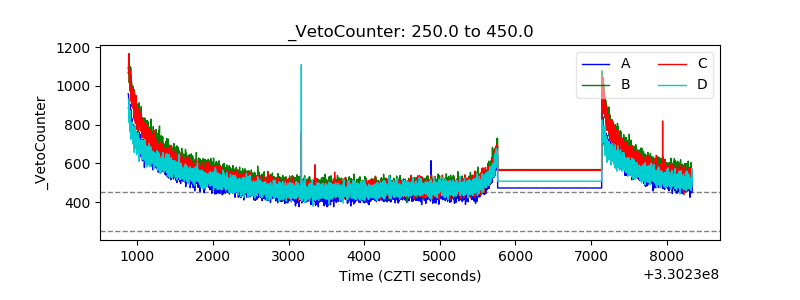 |