| Param | Original file | Final file |
|---|---|---|
| Filename | modeM0/AS1A09_008T05_9000003724_25549cztM0_level2.evt | modeM0/AS1A09_008T05_9000003724_25549cztM0_level2_quad_clean.evt |
| Size (bytes) | 474,151,680 | 67,489,920 |
| Size | 452.2 MB | 64.4 MB |
| Events in quadrant A | 3,342,614 | 417,725 |
| Events in quadrant B | 3,348,925 | 424,956 |
| Events in quadrant C | 3,548,732 | 386,729 |
| Events in quadrant D | 3,698,493 | 380,976 |
| Mode M0 | |||
|---|---|---|---|
| Quadrant | BADHDUFLAG | Total packets | Discarded packets |
| A | 0 | 13315 | 0 |
| B | 0 | 13383 | 0 |
| C | 0 | 14107 | 0 |
| D | 0 | 14861 | 0 |
| Mode M9 | |||
|---|---|---|---|
| Quadrant | BADHDUFLAG | Total packets | Discarded packets |
| A | 0 | 13 | 0 |
| B | 0 | 14 | 0 |
| C | 0 | 14 | 0 |
| D | 0 | 14 | 0 |
| Quadrant | Total seconds | Saturated seconds | Saturation percentage |
|---|---|---|---|
| A | 6195 | 58 | 0.936239% |
| B | 6195 | 84 | 1.355932% |
| C | 6195 | 140 | 2.259887% |
| D | 6195 | 78 | 1.259080% |
Noise dominated data is calculated using 1-second bins in cleaned event files. If a bin has >2000 counts, and if more than 50% of those come from <1% of pixels, then it is considered to be noise-dominated and hence unusable.
| Quadrant | # 1 sec bins | Bins with >0 counts | Bins with >2000 counts | High rate bins dominated by noise | Noise dominated (total time) | Noise dominated (detector-on time) | Marked lightcurve |
|---|---|---|---|---|---|---|---|
| A | 7480 | 6196 | 0 | 0 | 0.00% | 0.00% | 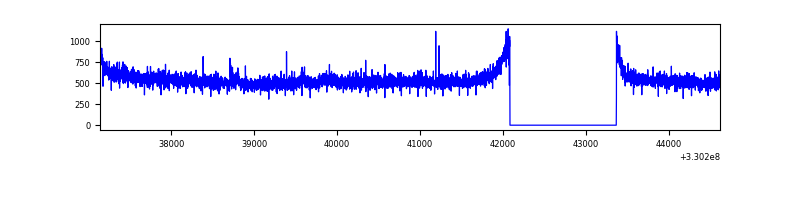 |
| B | 7480 | 6196 | 1 | 1 | 0.01% | 0.02% | 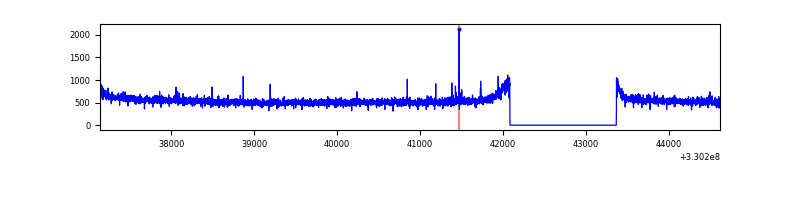 |
| C | 7480 | 6196 | 10 | 10 | 0.13% | 0.16% | 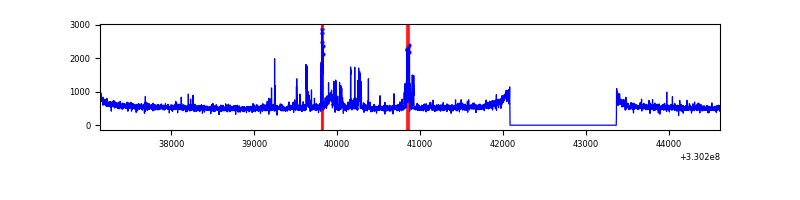 |
| D | 7480 | 6196 | 31 | 31 | 0.41% | 0.50% | 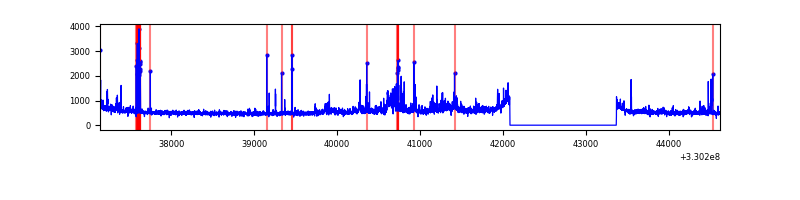 |
Top three noisy pixels from each quadrant. If the there are fewer than three noisy pixels in the level2.evt file, extra rows are filled as -1
| Pixel properties | Quadrant properties | ||||||
|---|---|---|---|---|---|---|---|
| Quadrant | DetID | PixID | Counts | Sigma | Mean | Median | Sigma |
| A | 6 | 16 | 22720 | 129.29 | 861 | 849 | 169.2 |
| A | 13 | 254 | 9756 | 52.65 | 861 | 849 | 169.2 |
| A | 3 | 137 | 7492 | 39.27 | 861 | 849 | 169.2 |
| B | 12 | 111 | 19188 | 113.37 | 854 | 834 | 161.9 |
| B | 11 | 111 | 17323 | 101.85 | 854 | 834 | 161.9 |
| B | 14 | 111 | 16380 | 96.02 | 854 | 834 | 161.9 |
| C | 2 | 16 | 228454 | 1207.84 | 806 | 812 | 188.5 |
| C | 14 | 238 | 133135 | 702.09 | 806 | 812 | 188.5 |
| C | 3 | 233 | 28739 | 148.18 | 806 | 812 | 188.5 |
| D | 1 | 52 | 309143 | 1574.04 | 811 | 791 | 195.9 |
| D | 8 | 195 | 272779 | 1388.41 | 811 | 791 | 195.9 |
| D | 2 | 234 | 22703 | 111.85 | 811 | 791 | 195.9 |
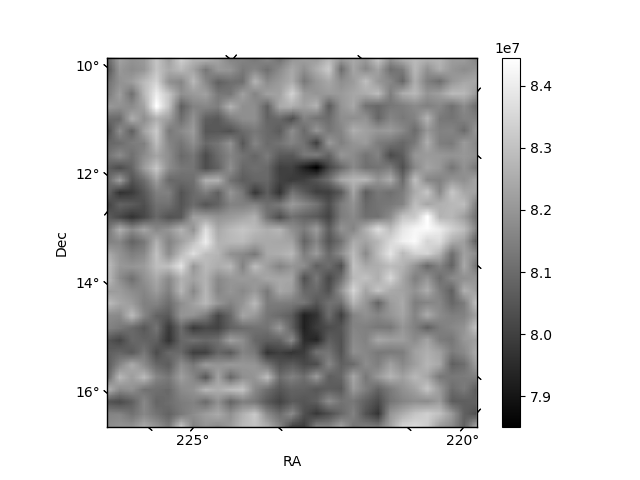
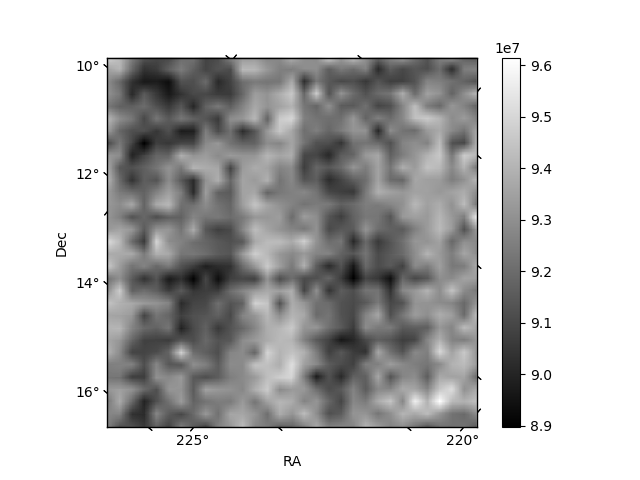
Histogram calculated using DETX and DETY for each event in the final _common_clean file
| Quadrant A | 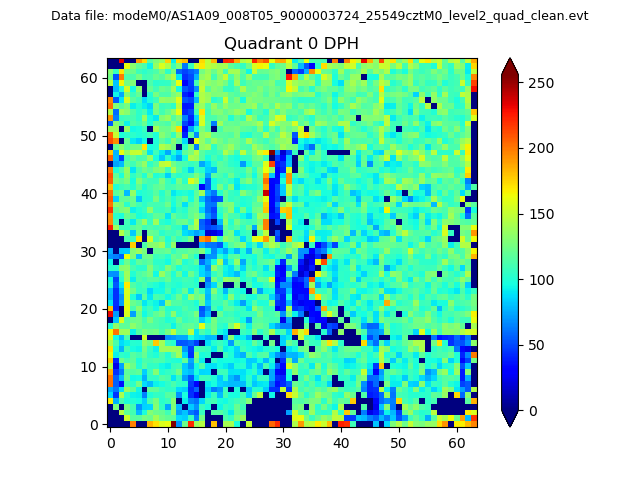 |
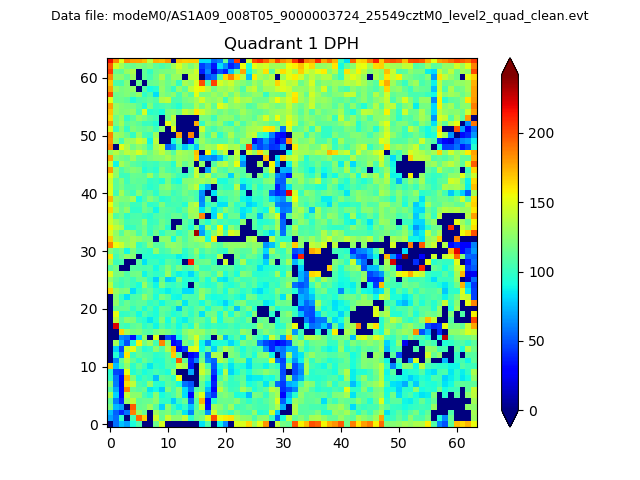 |
Quadrant B |
|---|---|---|---|
| Quadrant D | 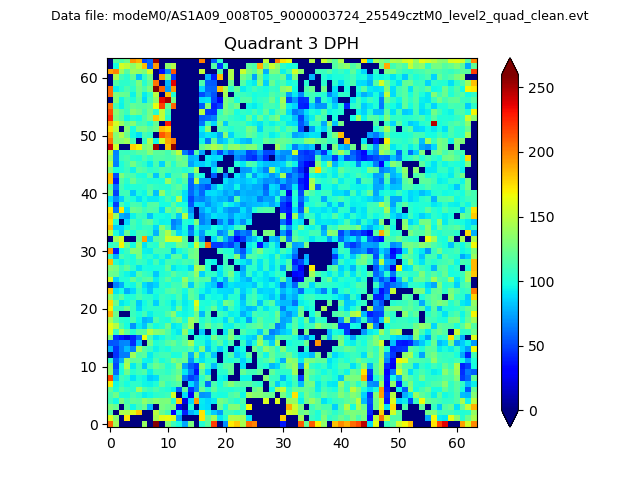 |
 |
Quadrant C |
| Plot type | Count rate plots | Images |
|---|---|---|
| Comparison with Poisson distribution Blue bars denote a histogram of data divided into 1 sec bins. Red curve is a Poisson curve with rate = median count rate of data. |
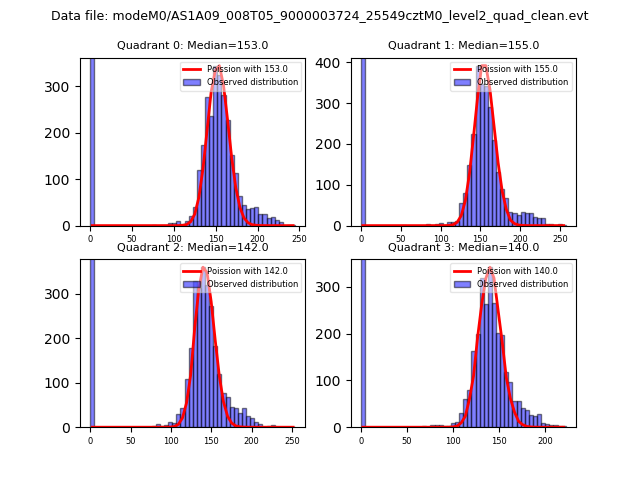 |
 |
| Quadrant-wise count rates Data is divided into 100 sec bins |
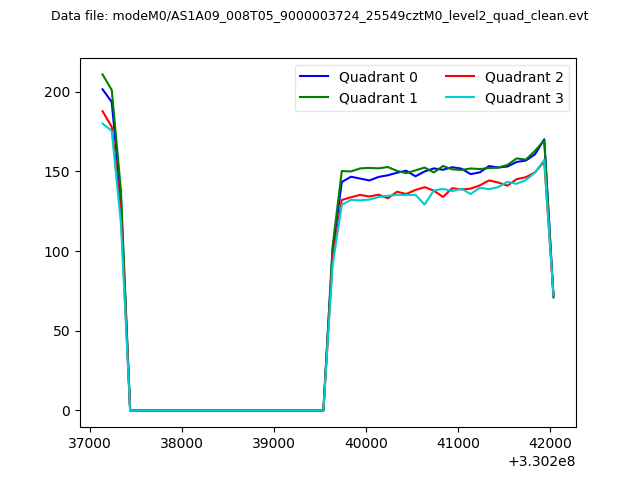 |
|
| Module-wise count rates for Quadrant A Data is divided into 100 sec bins |
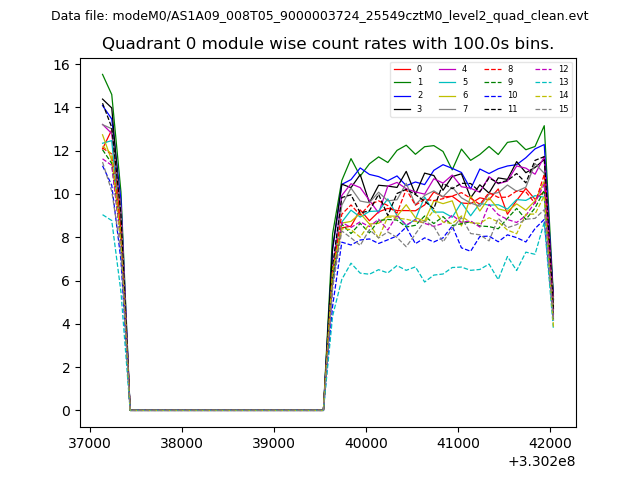 |
 |
| Module-wise count rates for Quadrant B Data is divided into 100 sec bins |
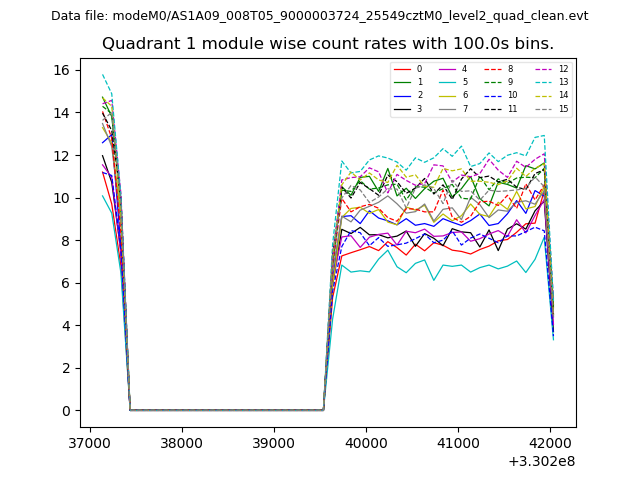 |
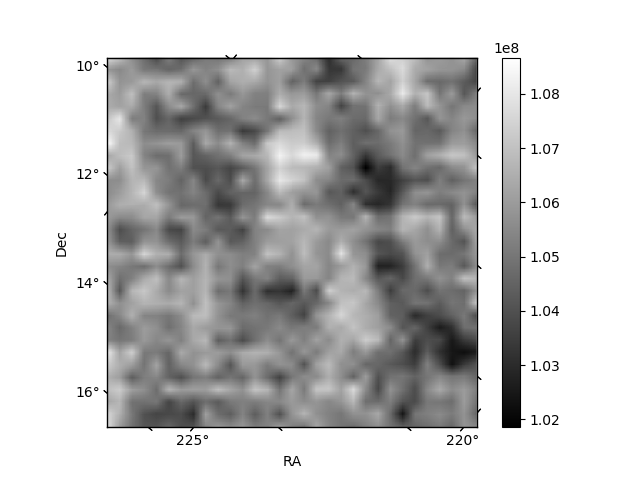 |
| Module-wise count rates for Quadrant C Data is divided into 100 sec bins |
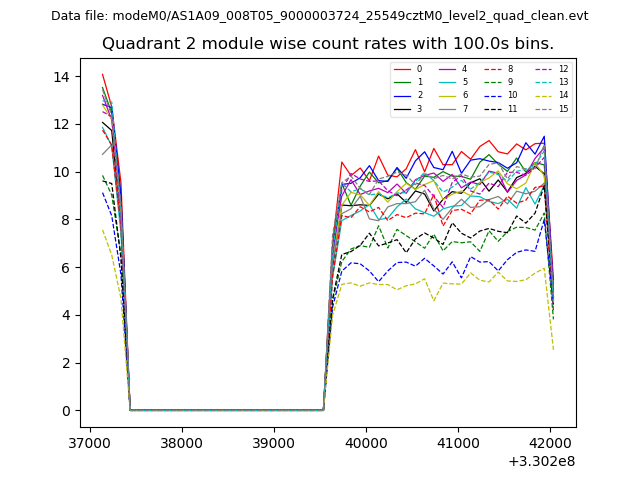 |
 |
| Module-wise count rates for Quadrant D Data is divided into 100 sec bins |
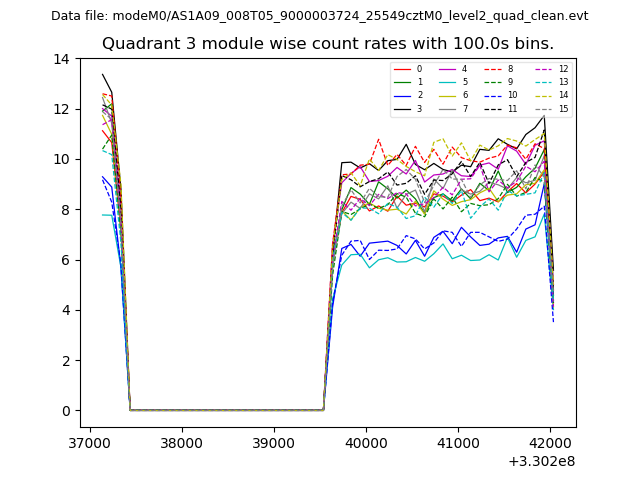 |
 |
| Parameter | Plot |
|---|---|
| CZT HV Monitor | 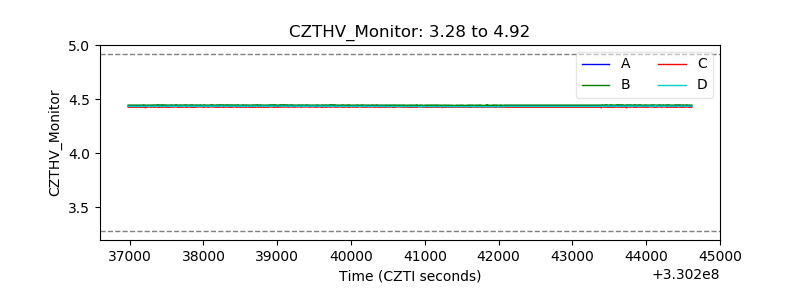 |
| D_VDD | 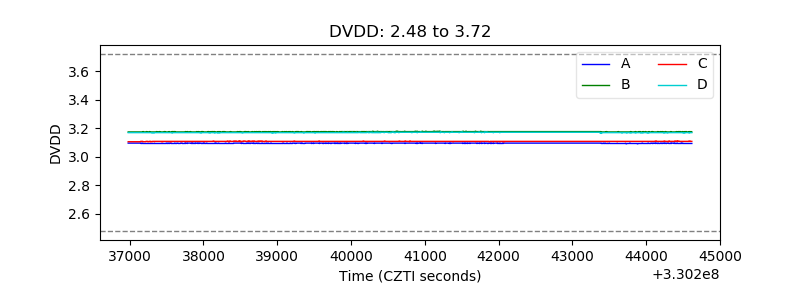 |
| Temperature 1 | 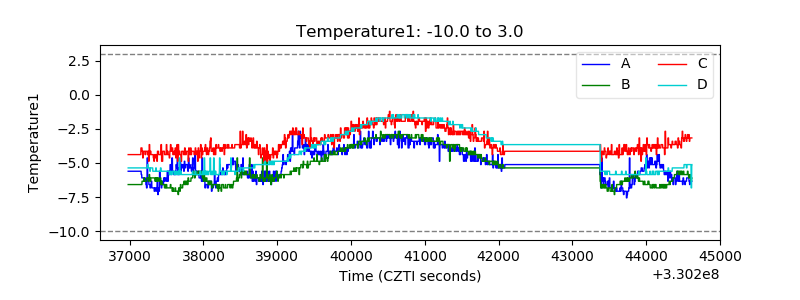 |
| Veto HV Monitor | 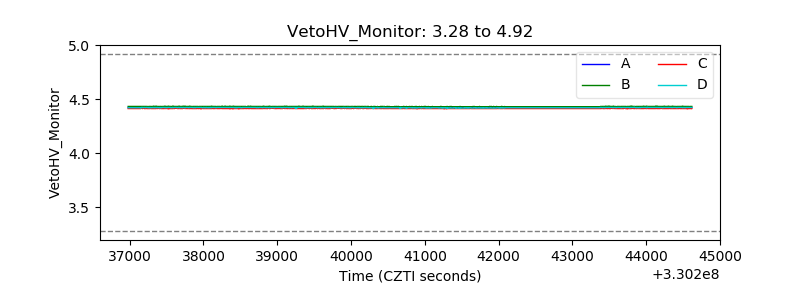 |
| Veto LLD | 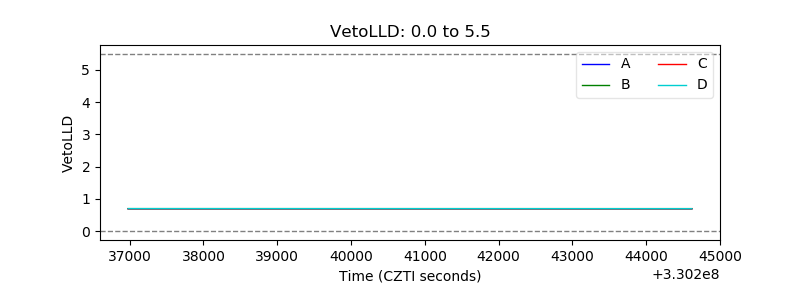 |
| Alpha Counter | 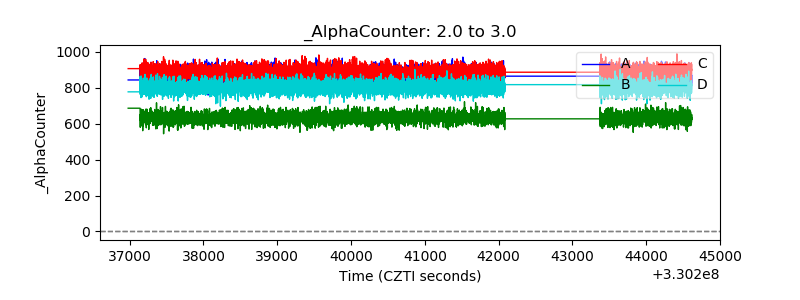 |
| _CPM_Rate | 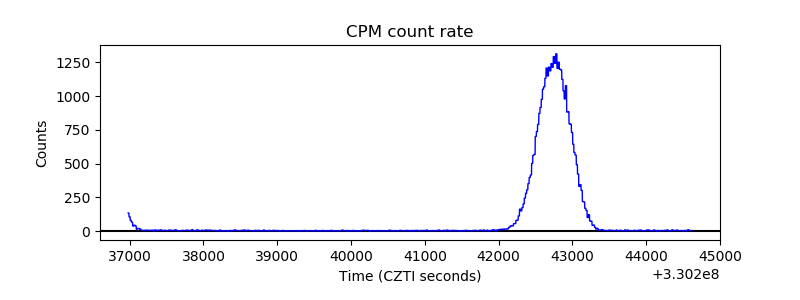 |
| CZT Counter |  |
| +2.5 Volts monitor |  |
| +5 Volts monitor | 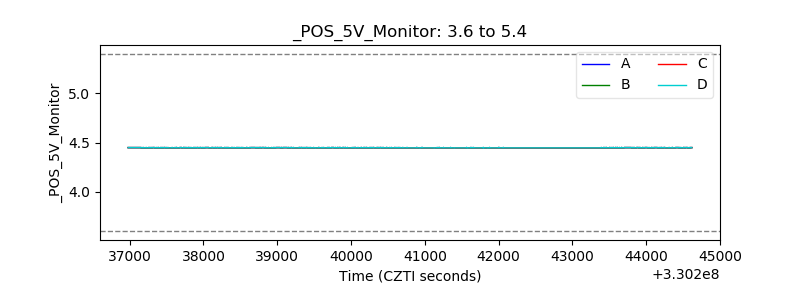 |
| _ROLL_ROT | 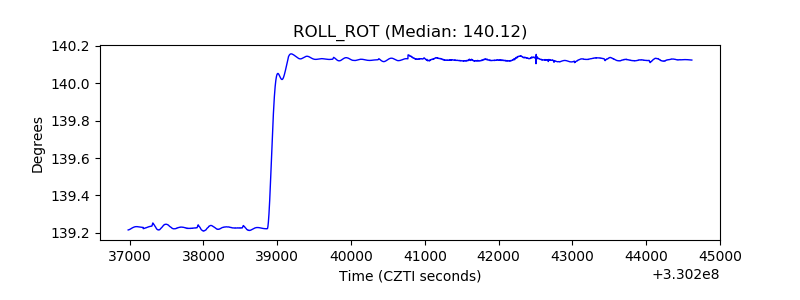 |
| _Roll_DEC | 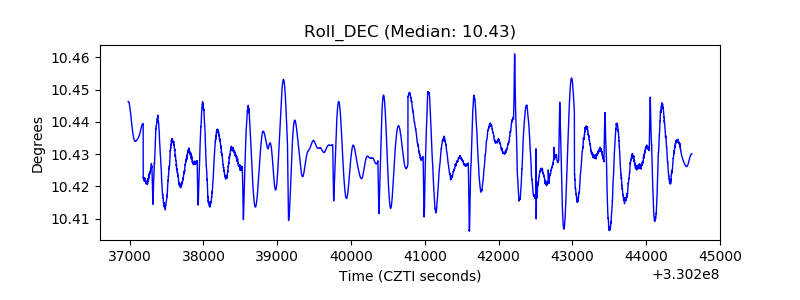 |
| _Roll_RA | 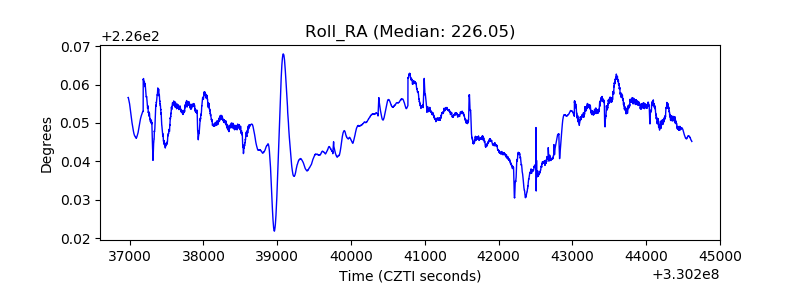 |
| Veto Counter | 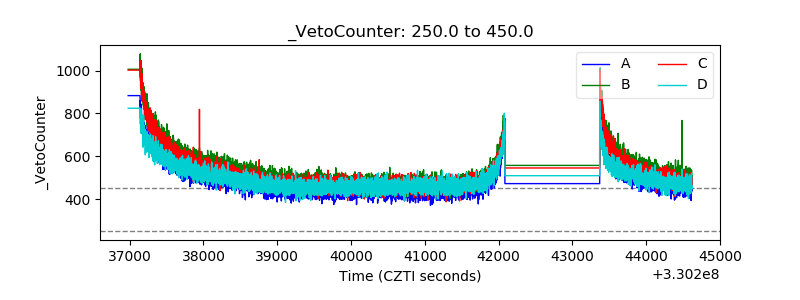 |