| Param | Original file | Final file |
|---|---|---|
| Filename | modeM0/AS1A09_008T05_9000003724_25550cztM0_level2.evt | modeM0/AS1A09_008T05_9000003724_25550cztM0_level2_quad_clean.evt |
| Size (bytes) | 475,485,120 | 71,985,600 |
| Size | 453.5 MB | 68.7 MB |
| Events in quadrant A | 3,397,787 | 444,170 |
| Events in quadrant B | 3,408,804 | 447,741 |
| Events in quadrant C | 3,385,682 | 417,636 |
| Events in quadrant D | 3,761,224 | 411,503 |
| Mode M0 | |||
|---|---|---|---|
| Quadrant | BADHDUFLAG | Total packets | Discarded packets |
| A | 0 | 13746 | 0 |
| B | 0 | 13806 | 0 |
| C | 0 | 13830 | 0 |
| D | 0 | 15067 | 0 |
| Mode M9 | |||
|---|---|---|---|
| Quadrant | BADHDUFLAG | Total packets | Discarded packets |
| A | 0 | 13 | 0 |
| B | 0 | 14 | 0 |
| C | 0 | 14 | 0 |
| D | 0 | 14 | 0 |
| Quadrant | Total seconds | Saturated seconds | Saturation percentage |
|---|---|---|---|
| A | 6574 | 83 | 1.262549% |
| B | 6573 | 115 | 1.749582% |
| C | 6573 | 134 | 2.038643% |
| D | 6573 | 88 | 1.338810% |
Noise dominated data is calculated using 1-second bins in cleaned event files. If a bin has >2000 counts, and if more than 50% of those come from <1% of pixels, then it is considered to be noise-dominated and hence unusable.
| Quadrant | # 1 sec bins | Bins with >0 counts | Bins with >2000 counts | High rate bins dominated by noise | Noise dominated (total time) | Noise dominated (detector-on time) | Marked lightcurve |
|---|---|---|---|---|---|---|---|
| A | 7629 | 6575 | 0 | 0 | 0.00% | 0.00% | 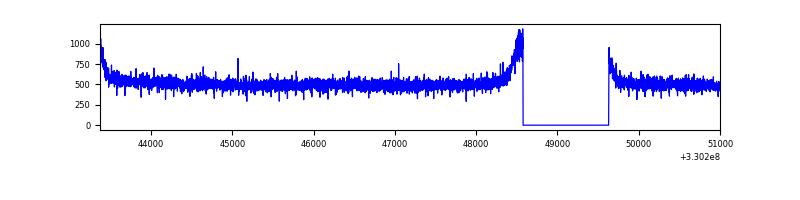 |
| B | 7628 | 6574 | 0 | 0 | 0.00% | 0.00% | 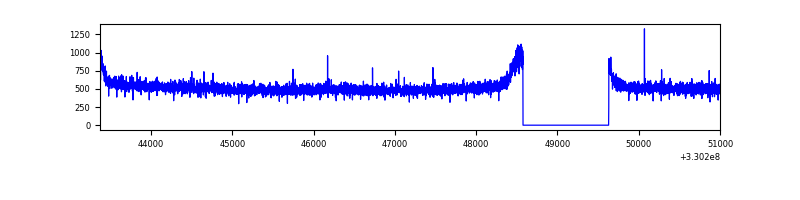 |
| C | 7628 | 6574 | 0 | 0 | 0.00% | 0.00% | 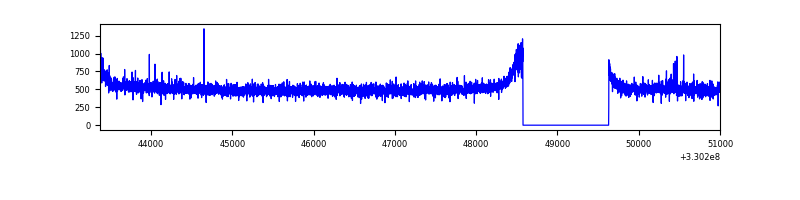 |
| D | 7628 | 6574 | 16 | 16 | 0.21% | 0.24% | 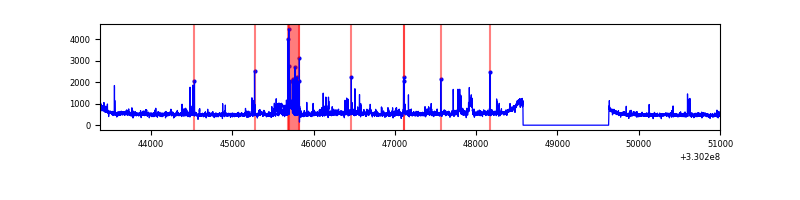 |
Top three noisy pixels from each quadrant. If the there are fewer than three noisy pixels in the level2.evt file, extra rows are filled as -1
| Pixel properties | Quadrant properties | ||||||
|---|---|---|---|---|---|---|---|
| Quadrant | DetID | PixID | Counts | Sigma | Mean | Median | Sigma |
| A | 13 | 254 | 9506 | 49.1 | 880 | 865 | 176.0 |
| A | 3 | 137 | 8018 | 40.65 | 880 | 865 | 176.0 |
| A | 0 | 226 | 7525 | 37.84 | 880 | 865 | 176.0 |
| B | 12 | 111 | 20504 | 118.16 | 871 | 850 | 166.3 |
| B | 11 | 111 | 18461 | 105.88 | 871 | 850 | 166.3 |
| B | 14 | 111 | 17599 | 100.69 | 871 | 850 | 166.3 |
| C | 14 | 238 | 133933 | 685.64 | 829 | 836 | 194.1 |
| C | 2 | 16 | 17635 | 86.54 | 829 | 836 | 194.1 |
| C | 13 | 61 | 5776 | 25.45 | 829 | 836 | 194.1 |
| D | 1 | 52 | 430207 | 2093.73 | 840 | 818 | 205.1 |
| D | 8 | 195 | 119050 | 576.51 | 840 | 818 | 205.1 |
| D | 2 | 234 | 23826 | 112.19 | 840 | 818 | 205.1 |
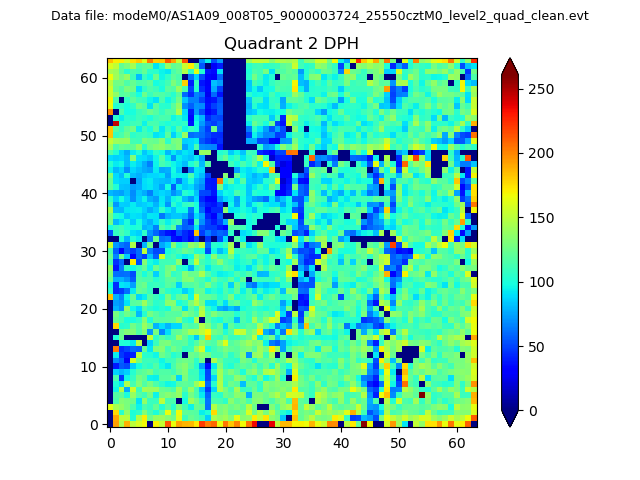
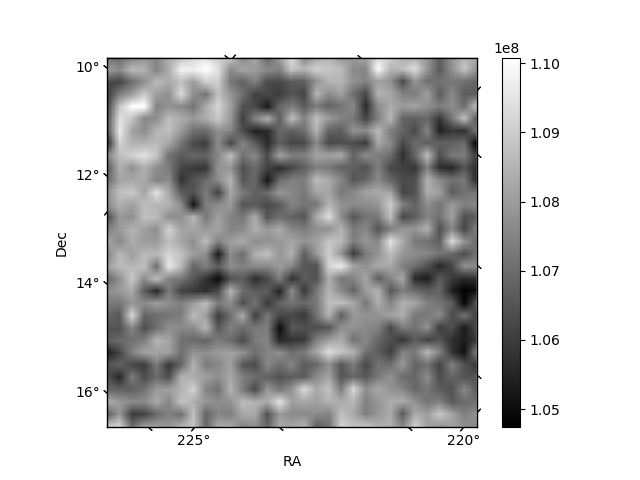
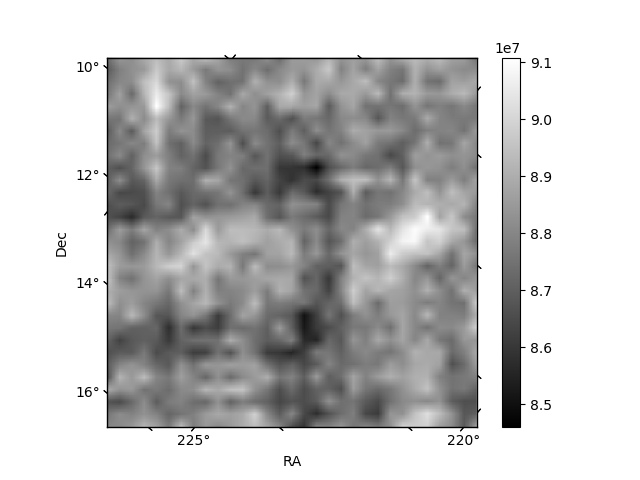
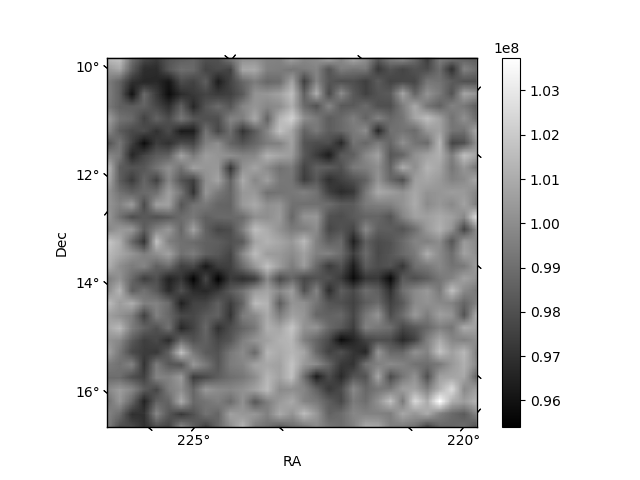
Histogram calculated using DETX and DETY for each event in the final _common_clean file
| Quadrant A | 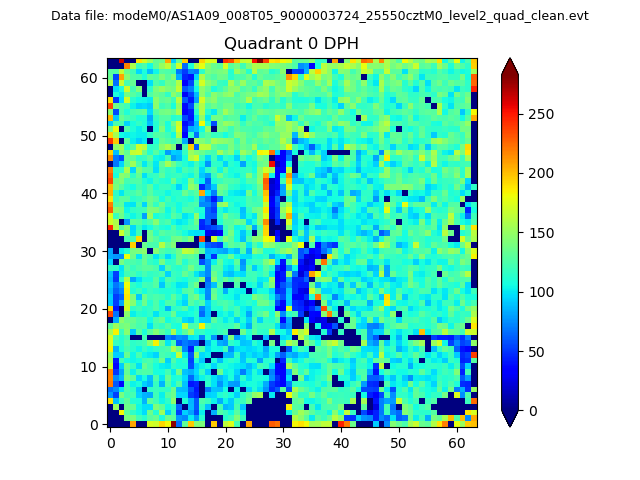 |
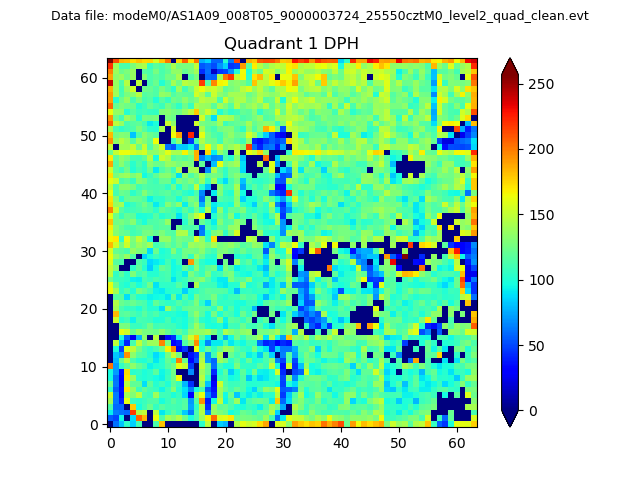 |
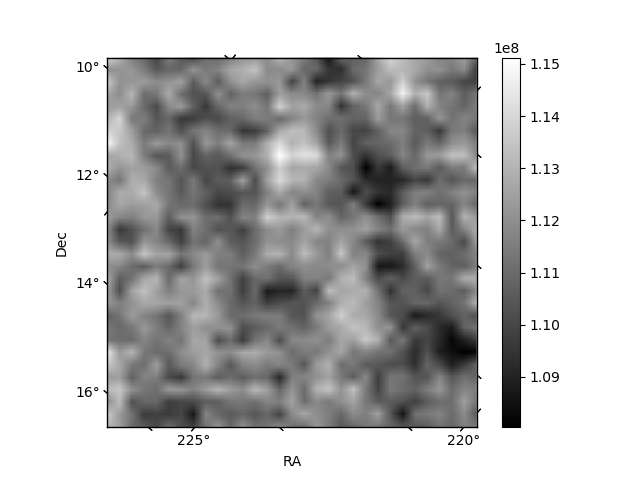
Quadrant B |
|---|---|---|---|
| Quadrant D | 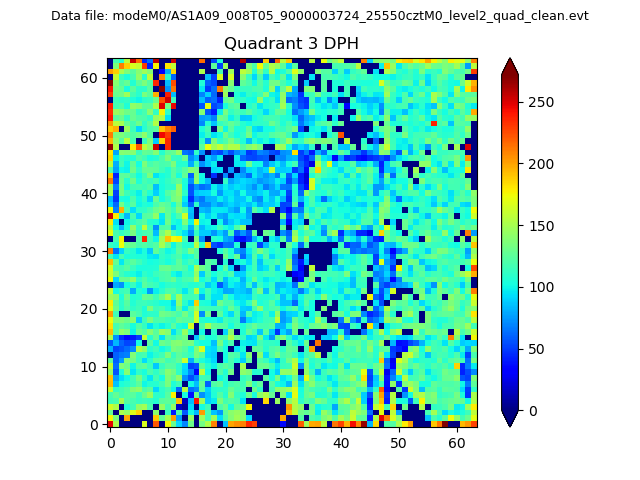 |
 |
Quadrant C |
| Plot type | Count rate plots | Images |
|---|---|---|
| Comparison with Poisson distribution Blue bars denote a histogram of data divided into 1 sec bins. Red curve is a Poisson curve with rate = median count rate of data. |
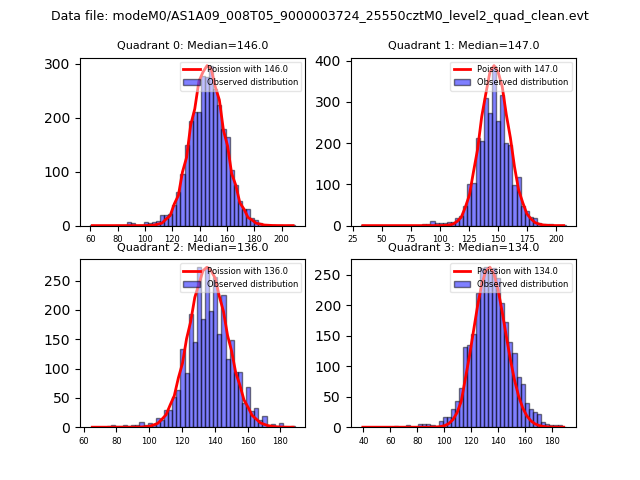 |
 |
| Quadrant-wise count rates Data is divided into 100 sec bins |
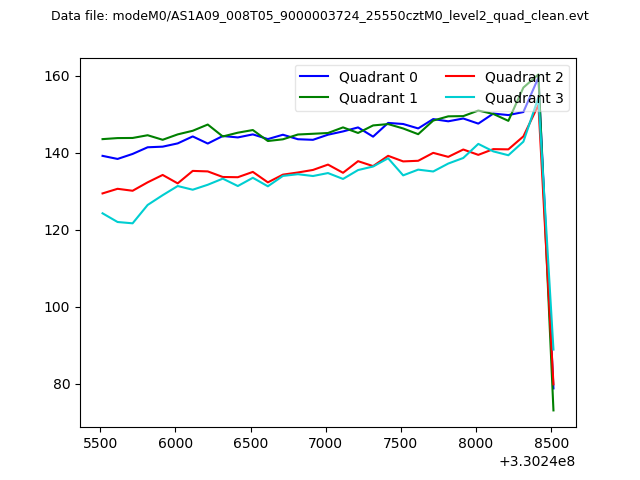 |
|
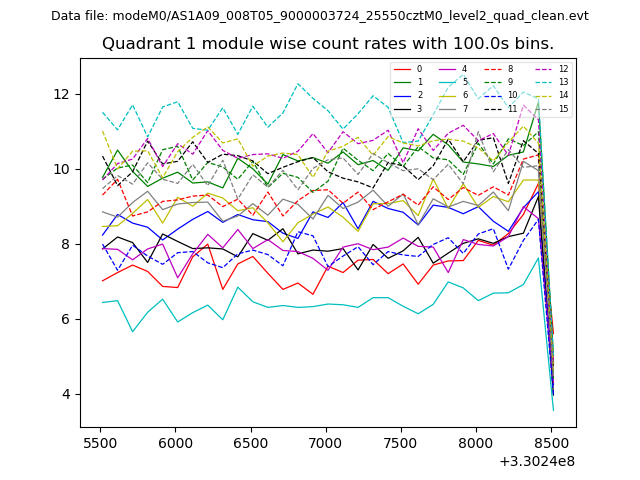
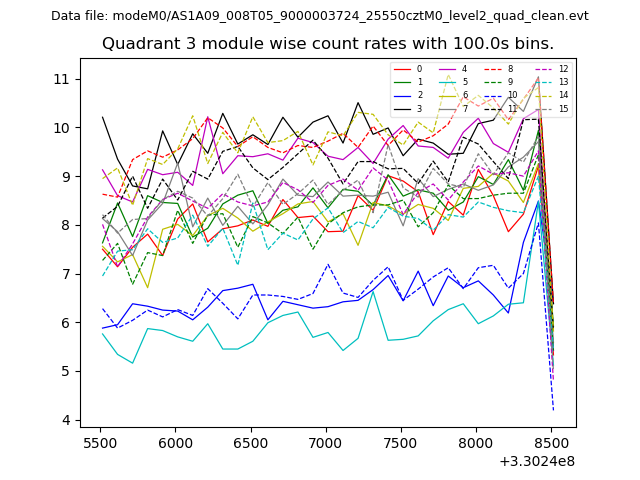
| Module-wise count rates for Quadrant A Data is divided into 100 sec bins |
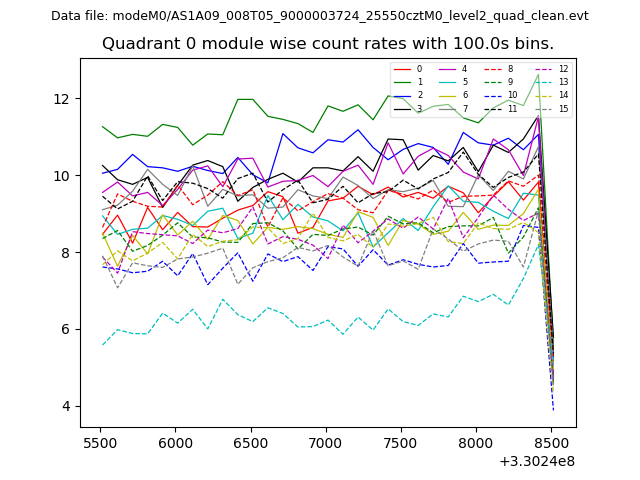 |
 |
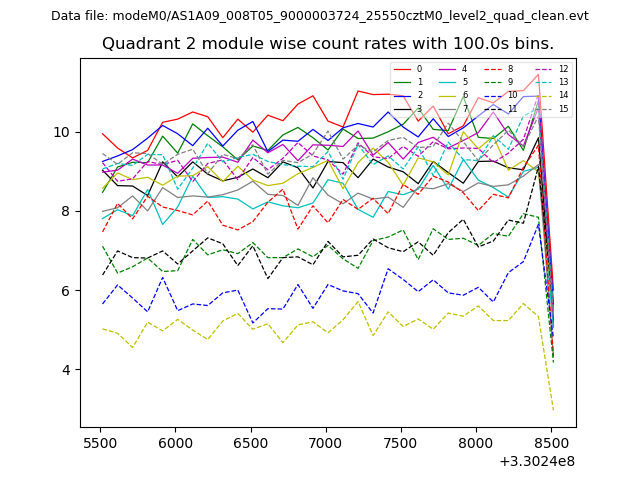
| Module-wise count rates for Quadrant B Data is divided into 100 sec bins |
 |
 |
| Module-wise count rates for Quadrant C Data is divided into 100 sec bins |
 |
 |
| Module-wise count rates for Quadrant D Data is divided into 100 sec bins |
 |
 |
| Parameter | Plot |
|---|---|
| CZT HV Monitor | 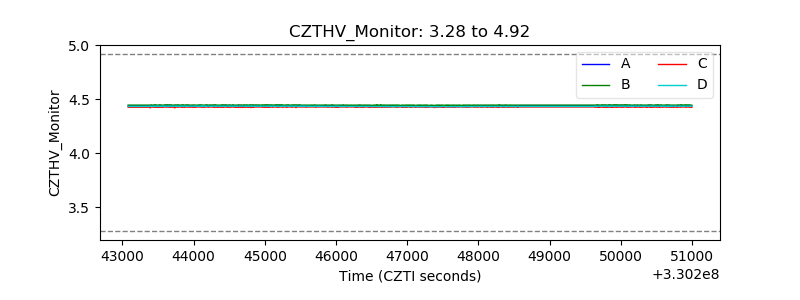 |
| D_VDD | 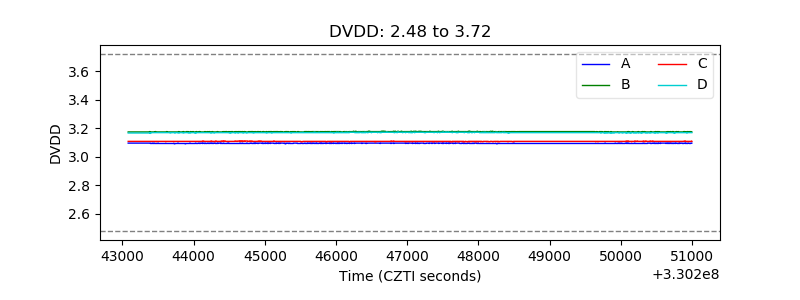 |
| Temperature 1 | 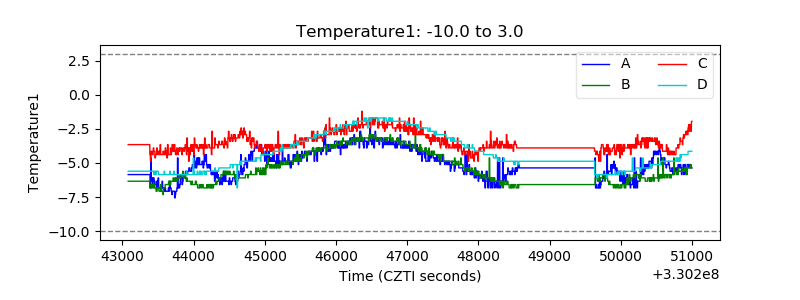 |
| Veto HV Monitor | 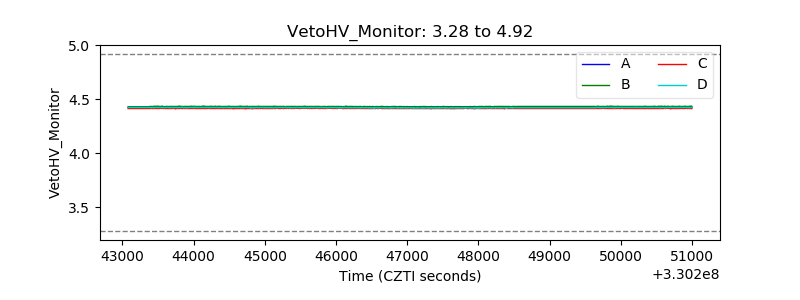 |
| Veto LLD | 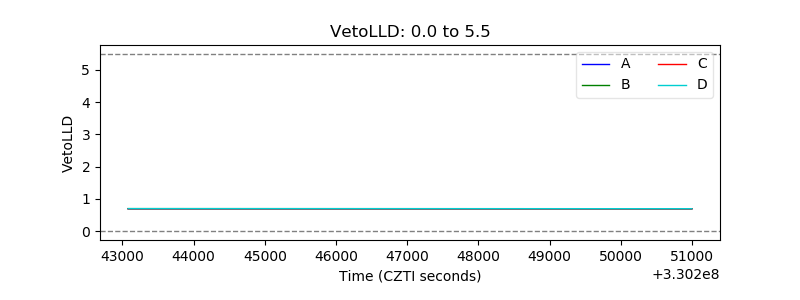 |
| Alpha Counter | 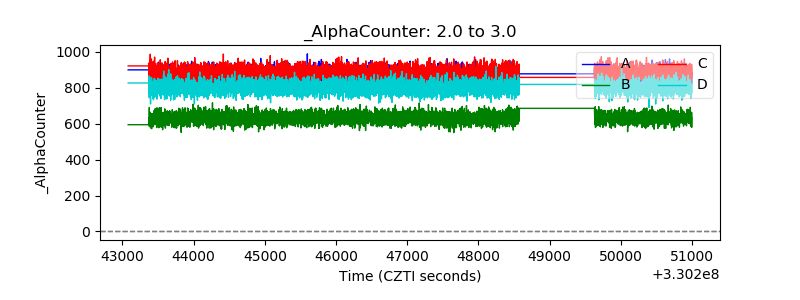 |
| _CPM_Rate | 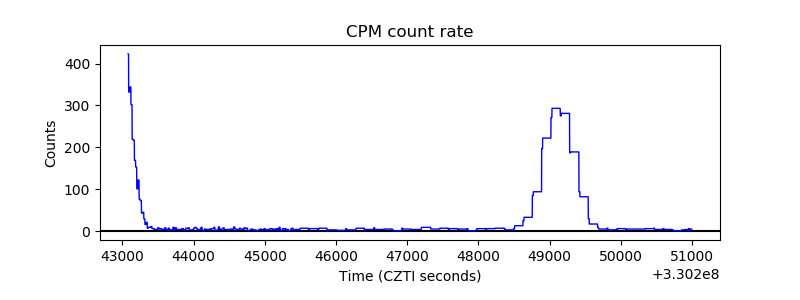 |
| CZT Counter | 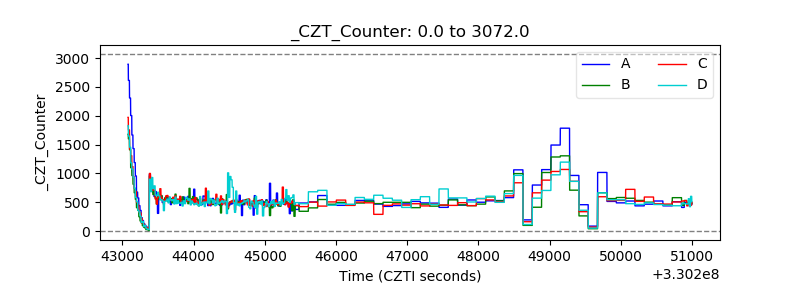 |
| +2.5 Volts monitor |  |
| +5 Volts monitor |  |
| _ROLL_ROT | 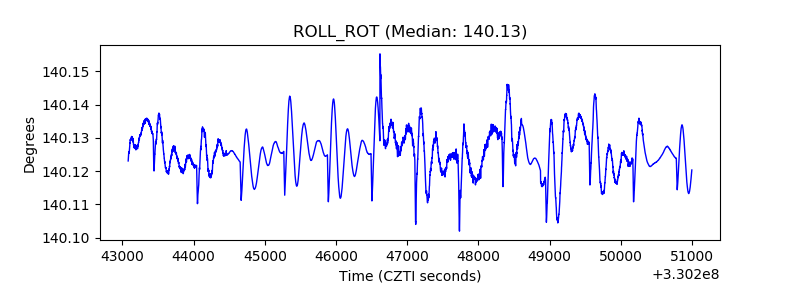 |
| _Roll_DEC | 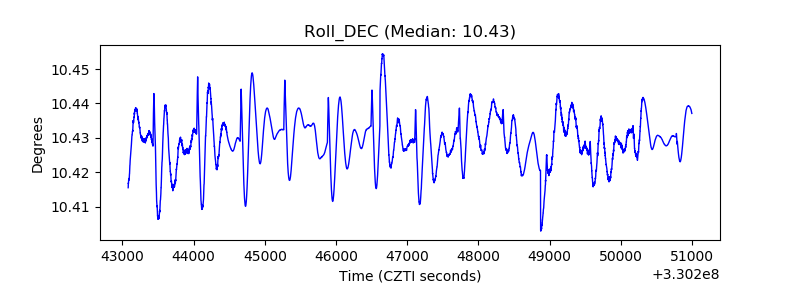 |
| _Roll_RA | 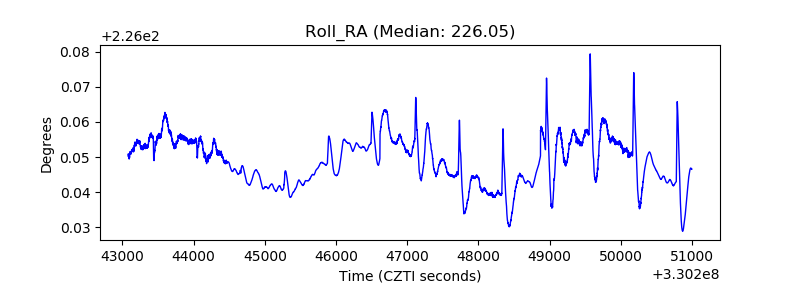 |
| Veto Counter | 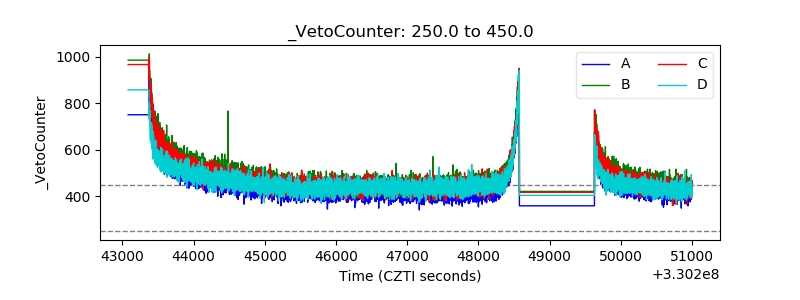 |