| Param | Original file | Final file |
|---|---|---|
| Filename | modeM0/AS1A09_008T05_9000003724_25551cztM0_level2.evt | modeM0/AS1A09_008T05_9000003724_25551cztM0_level2_quad_clean.evt |
| Size (bytes) | 494,481,600 | 81,348,480 |
| Size | 471.6 MB | 77.6 MB |
| Events in quadrant A | 3,581,466 | 509,053 |
| Events in quadrant B | 3,484,138 | 513,811 |
| Events in quadrant C | 3,466,831 | 479,737 |
| Events in quadrant D | 3,966,238 | 471,963 |
| Mode M0 | |||
|---|---|---|---|
| Quadrant | BADHDUFLAG | Total packets | Discarded packets |
| A | 0 | 14790 | 0 |
| B | 0 | 14463 | 0 |
| C | 0 | 14487 | 0 |
| D | 0 | 16079 | 0 |
| Mode M9 | |||
|---|---|---|---|
| Quadrant | BADHDUFLAG | Total packets | Discarded packets |
| A | 0 | 8 | 0 |
| B | 0 | 9 | 0 |
| C | 0 | 9 | 0 |
| D | 0 | 9 | 0 |
| Quadrant | Total seconds | Saturated seconds | Saturation percentage |
|---|---|---|---|
| A | 7019 | 94 | 1.339222% |
| B | 7019 | 115 | 1.638410% |
| C | 7019 | 125 | 1.780880% |
| D | 7019 | 137 | 1.951845% |
Noise dominated data is calculated using 1-second bins in cleaned event files. If a bin has >2000 counts, and if more than 50% of those come from <1% of pixels, then it is considered to be noise-dominated and hence unusable.
| Quadrant | # 1 sec bins | Bins with >0 counts | Bins with >2000 counts | High rate bins dominated by noise | Noise dominated (total time) | Noise dominated (detector-on time) | Marked lightcurve |
|---|---|---|---|---|---|---|---|
| A | 7704 | 7020 | 0 | 0 | 0.00% | 0.00% | 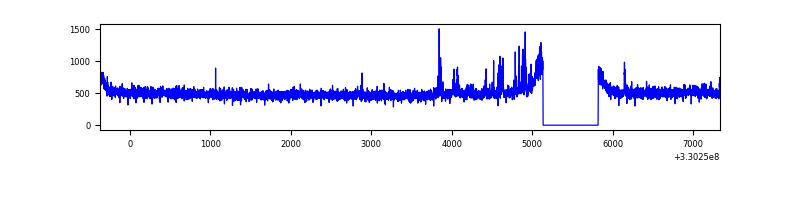 |
| B | 7704 | 7020 | 0 | 0 | 0.00% | 0.00% | 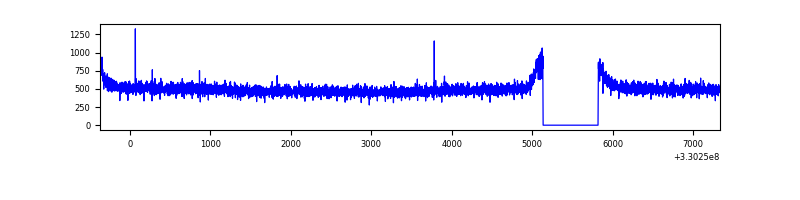 |
| C | 7704 | 7020 | 0 | 0 | 0.00% | 0.00% | 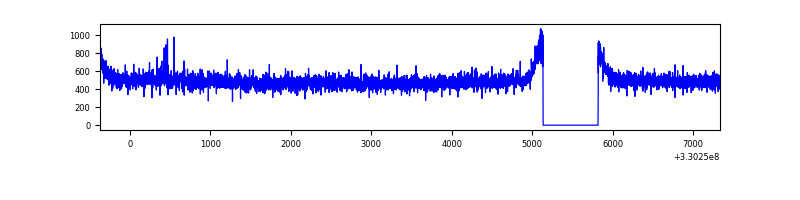 |
| D | 7704 | 7020 | 56 | 56 | 0.73% | 0.80% | 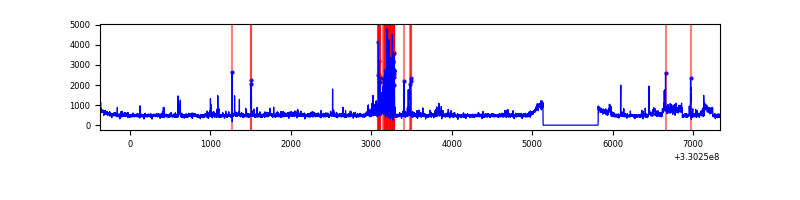 |
Top three noisy pixels from each quadrant. If the there are fewer than three noisy pixels in the level2.evt file, extra rows are filled as -1
| Pixel properties | Quadrant properties | ||||||
|---|---|---|---|---|---|---|---|
| Quadrant | DetID | PixID | Counts | Sigma | Mean | Median | Sigma |
| A | 6 | 16 | 115949 | 633.25 | 899 | 882 | 181.7 |
| A | 13 | 254 | 9560 | 47.76 | 899 | 882 | 181.7 |
| A | 3 | 137 | 8414 | 41.45 | 899 | 882 | 181.7 |
| B | 12 | 111 | 21646 | 121.13 | 889 | 868 | 171.5 |
| B | 11 | 111 | 19470 | 108.44 | 889 | 868 | 171.5 |
| B | 14 | 111 | 17981 | 99.76 | 889 | 868 | 171.5 |
| C | 14 | 238 | 137504 | 680.62 | 850 | 857 | 200.8 |
| C | 2 | 16 | 14006 | 65.49 | 850 | 857 | 200.8 |
| C | 13 | 61 | 5998 | 25.61 | 850 | 857 | 200.8 |
| D | 1 | 52 | 505614 | 2399.74 | 860 | 834 | 210.3 |
| D | 8 | 195 | 128946 | 609.05 | 860 | 834 | 210.3 |
| D | 13 | 104 | 44614 | 208.13 | 860 | 834 | 210.3 |
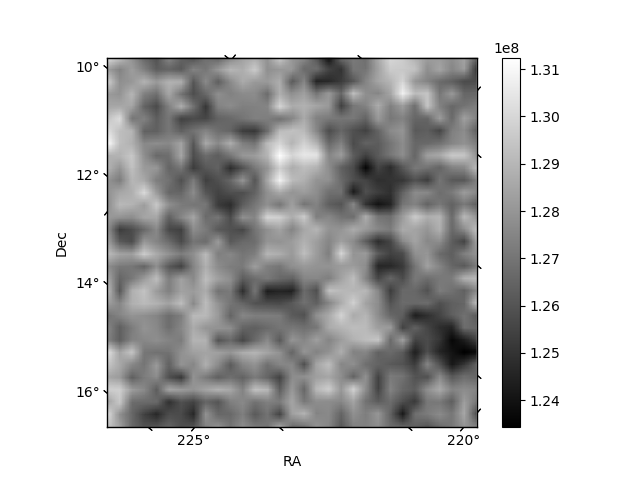
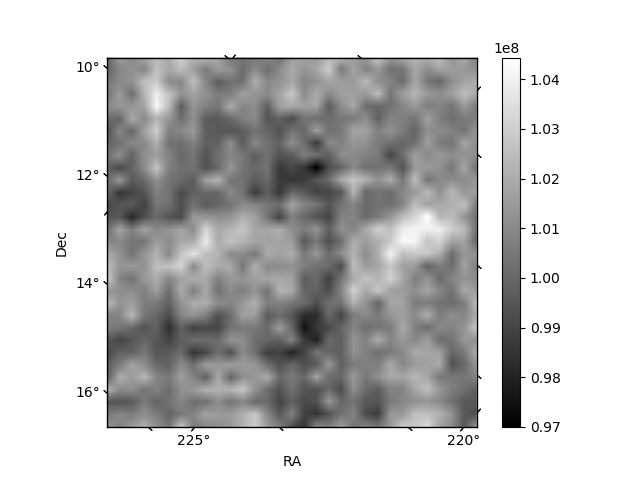
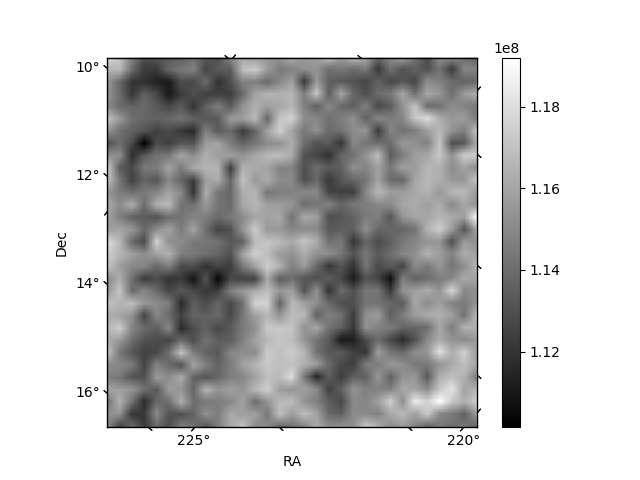
Histogram calculated using DETX and DETY for each event in the final _common_clean file
| Quadrant A |  |
 |
Quadrant B |
|---|---|---|---|
| Quadrant D | 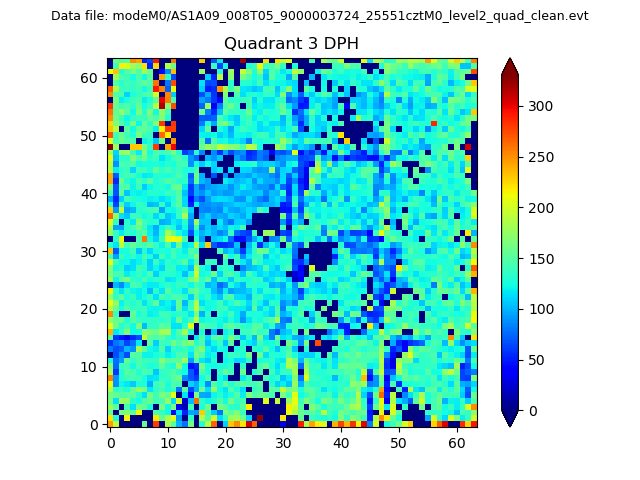 |
 |
Quadrant C |
| Plot type | Count rate plots | Images |
|---|---|---|
| Comparison with Poisson distribution Blue bars denote a histogram of data divided into 1 sec bins. Red curve is a Poisson curve with rate = median count rate of data. |
 |
 |
| Quadrant-wise count rates Data is divided into 100 sec bins |
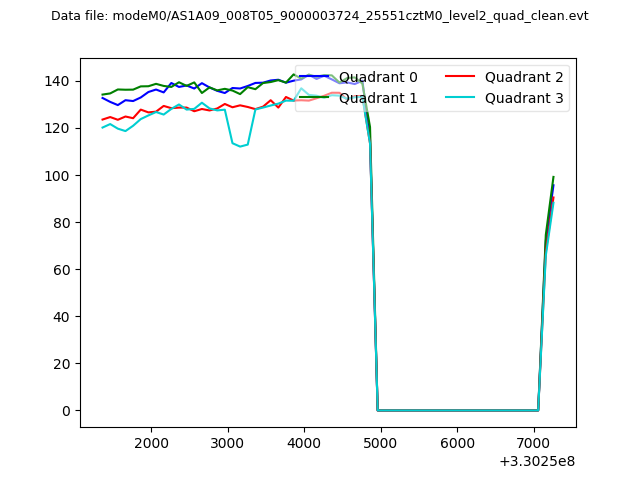 |
|
| Module-wise count rates for Quadrant A Data is divided into 100 sec bins |
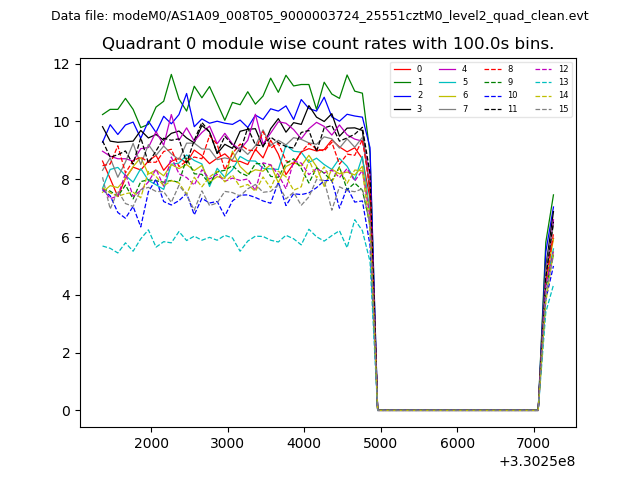 |
 |
| Module-wise count rates for Quadrant B Data is divided into 100 sec bins |
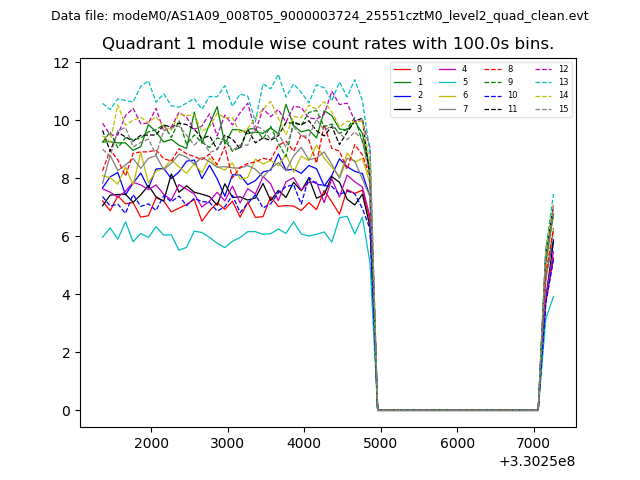 |
 |
| Module-wise count rates for Quadrant C Data is divided into 100 sec bins |
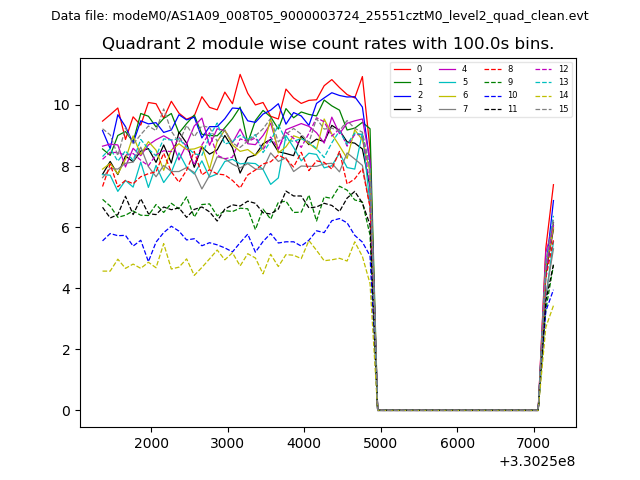 |
 |
| Module-wise count rates for Quadrant D Data is divided into 100 sec bins |
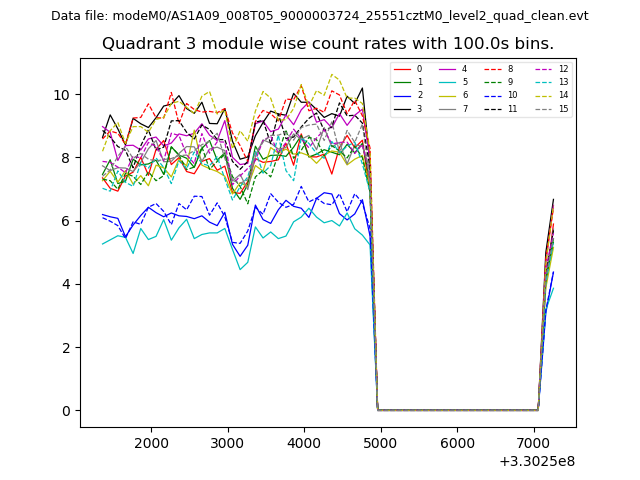 |
 |
| Parameter | Plot |
|---|---|
| CZT HV Monitor | 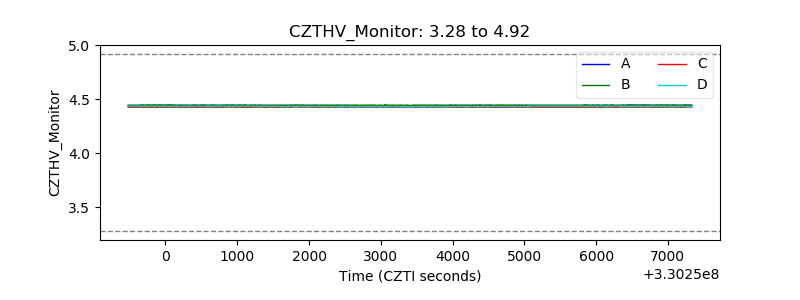 |
| D_VDD | 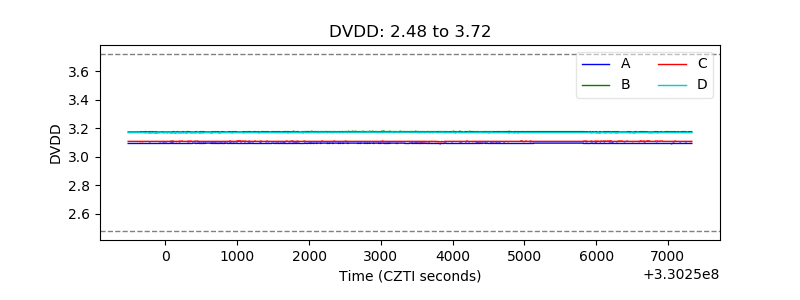 |
| Temperature 1 | 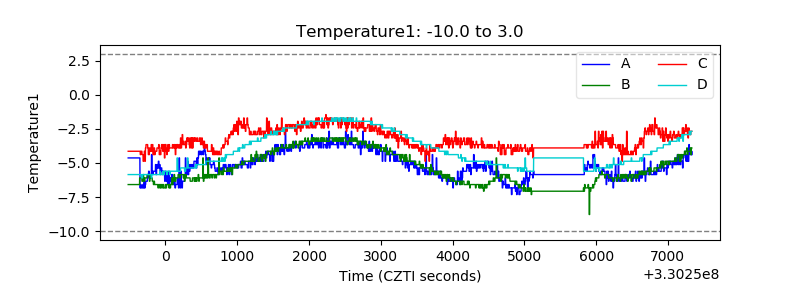 |
| Veto HV Monitor | 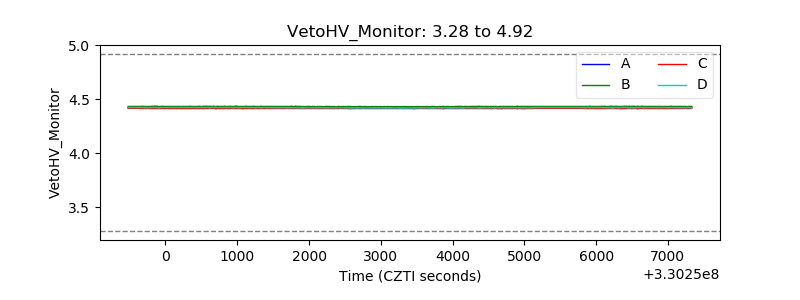 |
| Veto LLD | 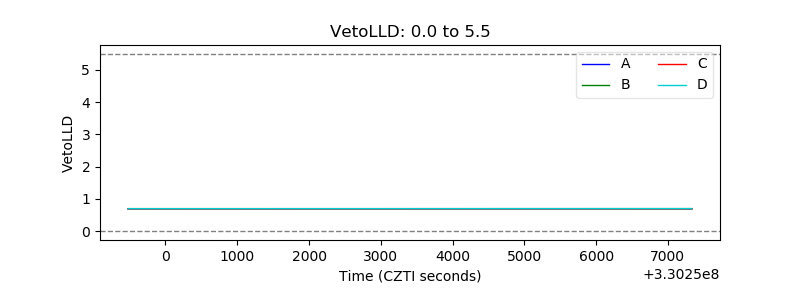 |
| Alpha Counter | 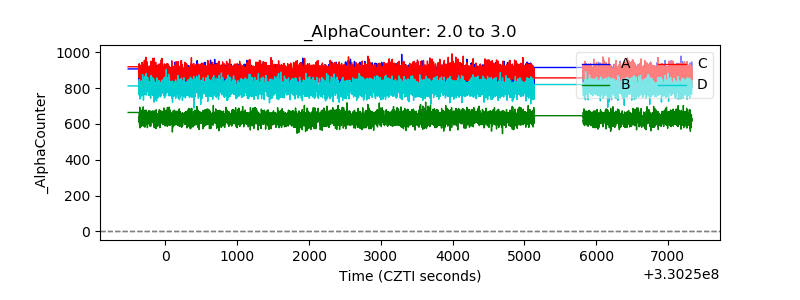 |
| _CPM_Rate | 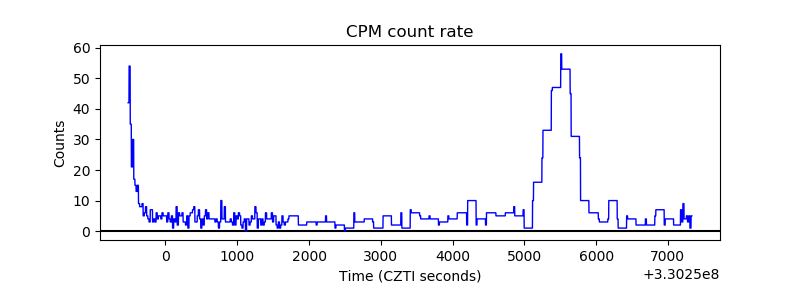 |
| CZT Counter |  |
| +2.5 Volts monitor |  |
| +5 Volts monitor | 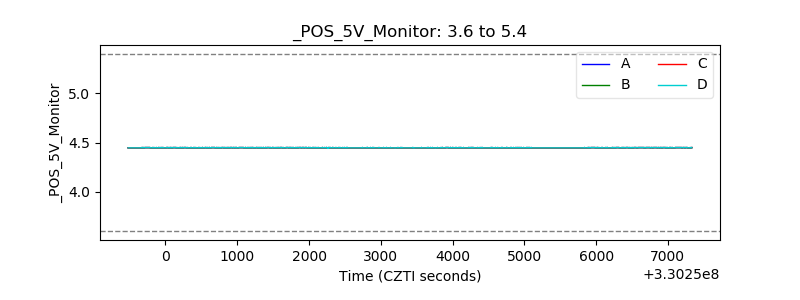 |
| _ROLL_ROT |  |
| _Roll_DEC | 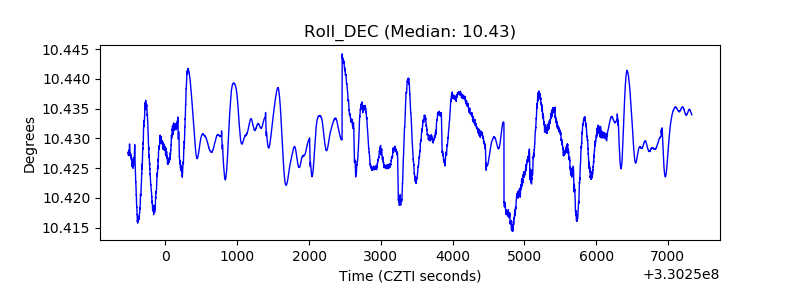 |
| _Roll_RA |  |
| Veto Counter | 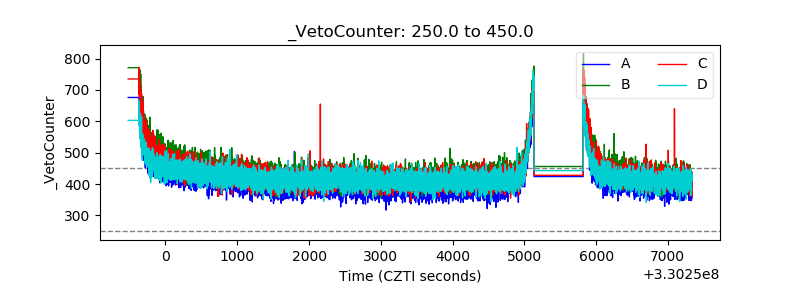 |