| Param | Original file | Final file |
|---|---|---|
| Filename | modeM0/AS1A09_008T05_9000003724_25552cztM0_level2.evt | modeM0/AS1A09_008T05_9000003724_25552cztM0_level2_quad_clean.evt |
| Size (bytes) | 910,874,880 | 165,185,280 |
| Size | 868.7 MB | 157.5 MB |
| Events in quadrant A | 6,688,140 | 1,056,489 |
| Events in quadrant B | 6,420,435 | 1,065,721 |
| Events in quadrant C | 6,444,195 | 993,637 |
| Events in quadrant D | 7,146,414 | 982,157 |
| Mode M0 | |||
|---|---|---|---|
| Quadrant | BADHDUFLAG | Total packets | Discarded packets |
| A | 0 | 27800 | 0 |
| B | 0 | 26994 | 0 |
| C | 0 | 27138 | 0 |
| D | 0 | 29294 | 0 |
| Mode M9 | |||
|---|---|---|---|
| Quadrant | BADHDUFLAG | Total packets | Discarded packets |
| A | 0 | 11 | 0 |
| B | 0 | 12 | 0 |
| C | 0 | 12 | 0 |
| D | 0 | 12 | 0 |
| Quadrant | Total seconds | Saturated seconds | Saturation percentage |
|---|---|---|---|
| A | 13098 | 236 | 1.801802% |
| B | 13098 | 267 | 2.038479% |
| C | 13098 | 308 | 2.351504% |
| D | 13097 | 258 | 1.969917% |
Noise dominated data is calculated using 1-second bins in cleaned event files. If a bin has >2000 counts, and if more than 50% of those come from <1% of pixels, then it is considered to be noise-dominated and hence unusable.
| Quadrant | # 1 sec bins | Bins with >0 counts | Bins with >2000 counts | High rate bins dominated by noise | Noise dominated (total time) | Noise dominated (detector-on time) | Marked lightcurve |
|---|---|---|---|---|---|---|---|
| A | 14103 | 13100 | 5 | 5 | 0.04% | 0.04% | 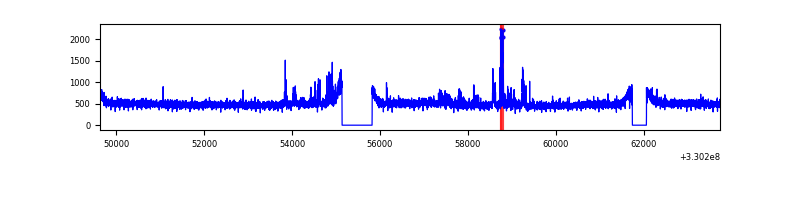 |
| B | 14103 | 13100 | 0 | 0 | 0.00% | 0.00% | 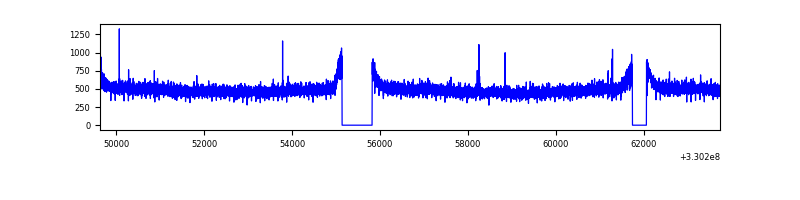 |
| C | 14103 | 13100 | 6 | 6 | 0.04% | 0.05% | 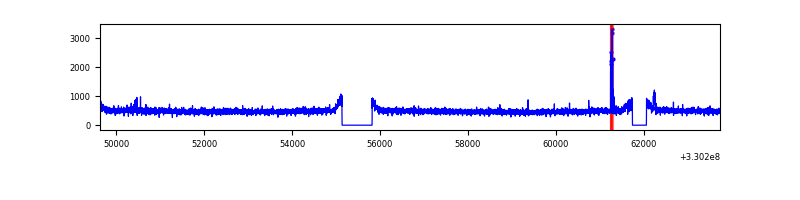 |
| D | 14103 | 13100 | 69 | 69 | 0.49% | 0.53% | 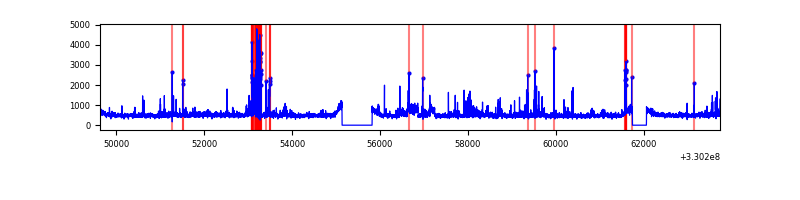 |
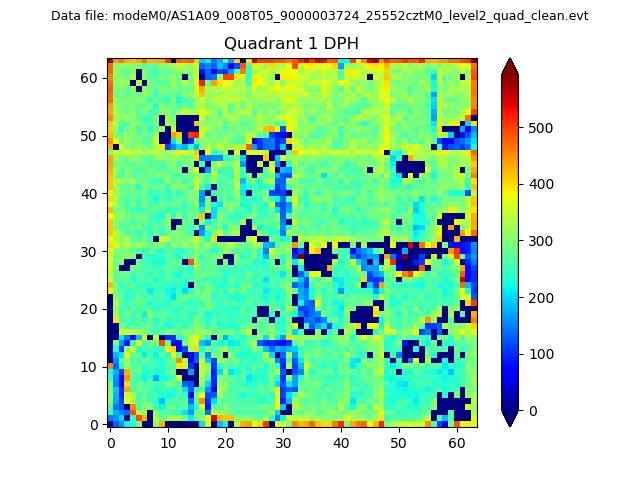
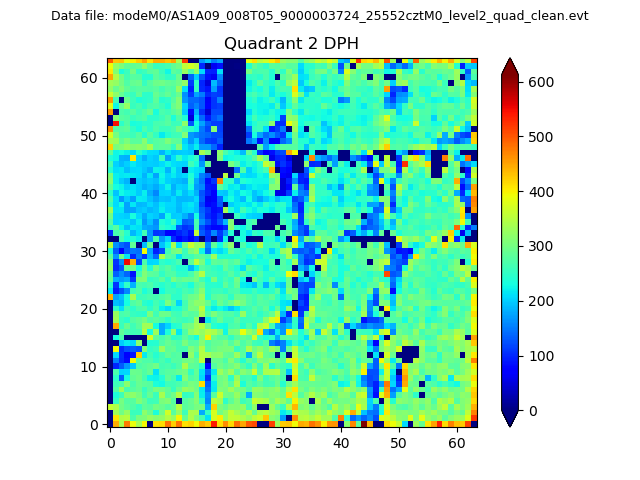
Top three noisy pixels from each quadrant. If the there are fewer than three noisy pixels in the level2.evt file, extra rows are filled as -1
| Pixel properties | Quadrant properties | ||||||
|---|---|---|---|---|---|---|---|
| Quadrant | DetID | PixID | Counts | Sigma | Mean | Median | Sigma |
| A | 6 | 16 | 298298 | 893.58 | 1658 | 1627 | 332.0 |
| A | 13 | 254 | 17488 | 47.77 | 1658 | 1627 | 332.0 |
| A | 3 | 137 | 15758 | 42.56 | 1658 | 1627 | 332.0 |
| B | 12 | 111 | 39610 | 120.5 | 1638 | 1596 | 315.5 |
| B | 11 | 111 | 36240 | 109.82 | 1638 | 1596 | 315.5 |
| B | 14 | 111 | 33569 | 101.35 | 1638 | 1596 | 315.5 |
| C | 14 | 238 | 253796 | 685.65 | 1571 | 1583 | 367.8 |
| C | 2 | 16 | 66497 | 176.47 | 1571 | 1583 | 367.8 |
| C | 13 | 61 | 10836 | 25.15 | 1571 | 1583 | 367.8 |
| D | 1 | 52 | 818819 | 2137.8 | 1588 | 1540 | 382.3 |
| D | 8 | 195 | 233641 | 607.12 | 1588 | 1540 | 382.3 |
| D | 2 | 234 | 50012 | 126.79 | 1588 | 1540 | 382.3 |
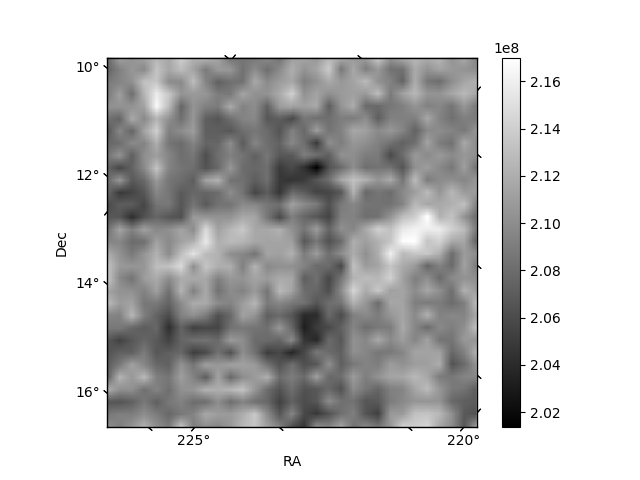
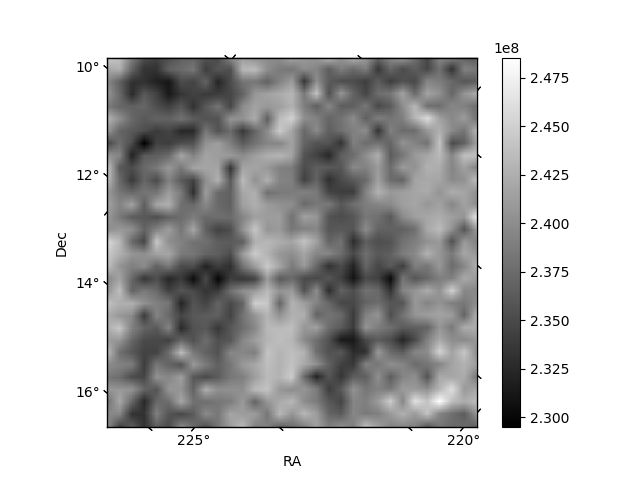
Histogram calculated using DETX and DETY for each event in the final _common_clean file
| Quadrant A | 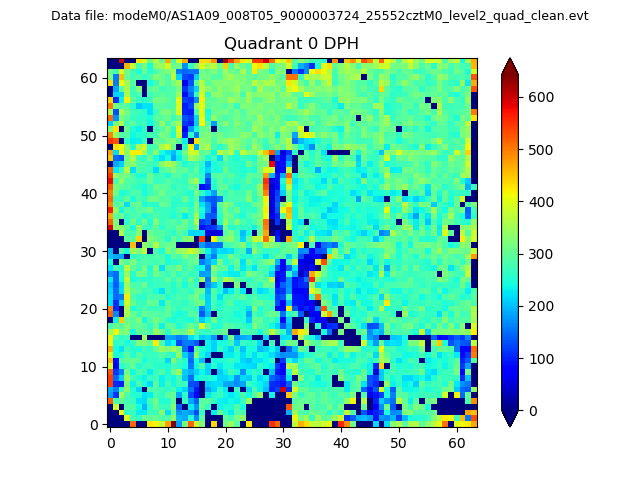 |
 |
Quadrant B |
|---|---|---|---|
| Quadrant D |  |
 |
Quadrant C |
| Plot type | Count rate plots | Images |
|---|---|---|
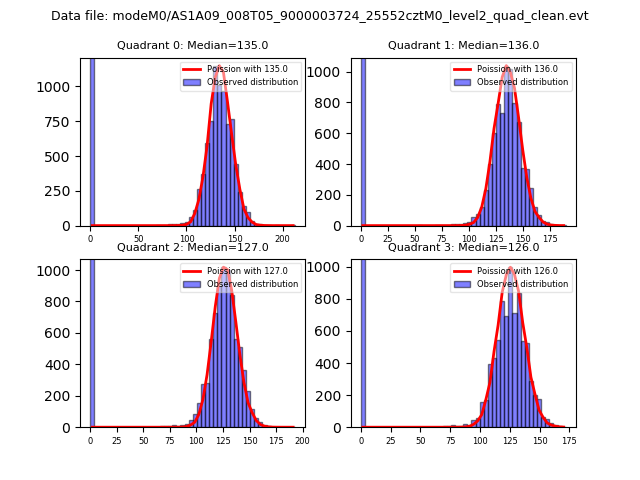
| Comparison with Poisson distribution Blue bars denote a histogram of data divided into 1 sec bins. Red curve is a Poisson curve with rate = median count rate of data. |
 |
 |
| Quadrant-wise count rates Data is divided into 100 sec bins |
 |
|
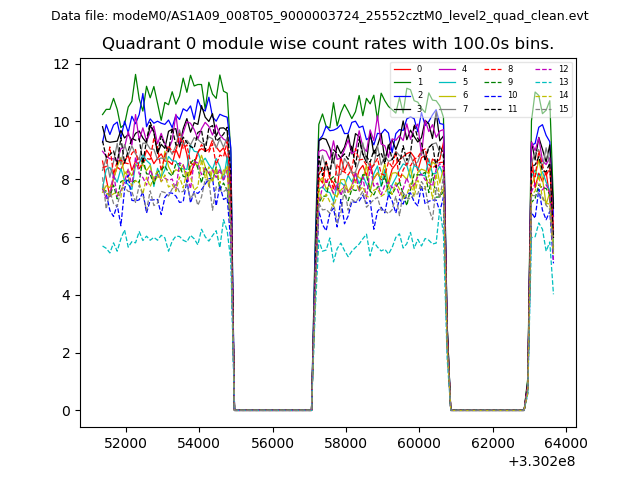
| Module-wise count rates for Quadrant A Data is divided into 100 sec bins |
 |
 |
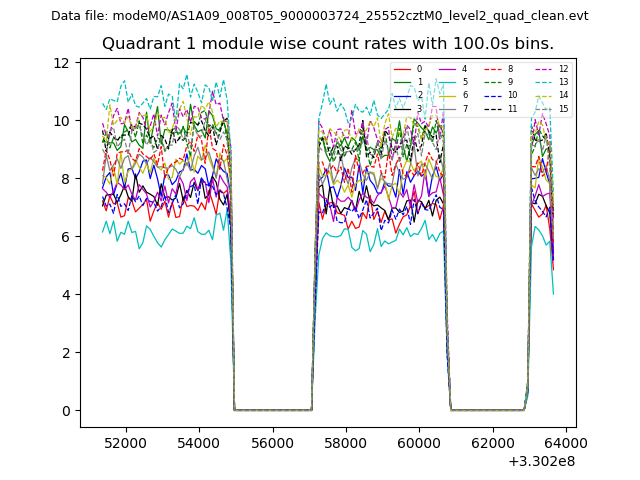
| Module-wise count rates for Quadrant B Data is divided into 100 sec bins |
 |
 |
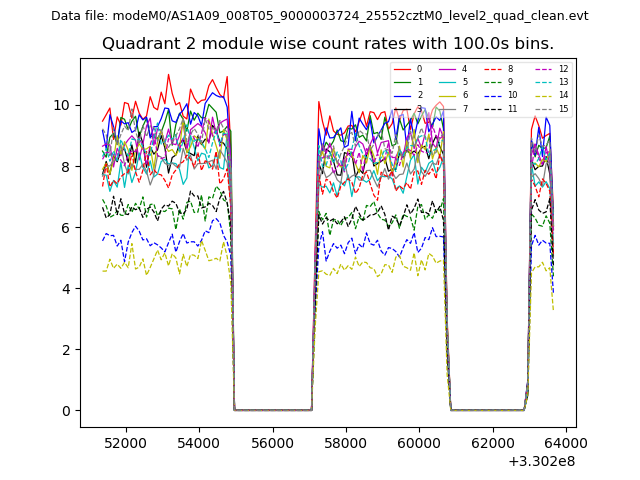
| Module-wise count rates for Quadrant C Data is divided into 100 sec bins |
 |
 |
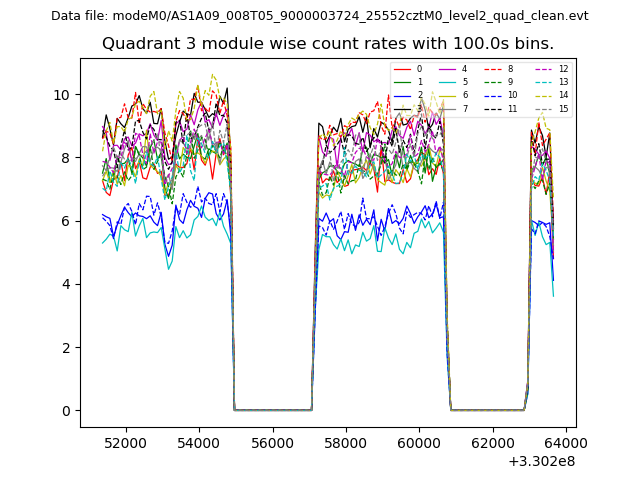
| Module-wise count rates for Quadrant D Data is divided into 100 sec bins |
 |
 |
| Parameter | Plot |
|---|---|
| CZT HV Monitor | 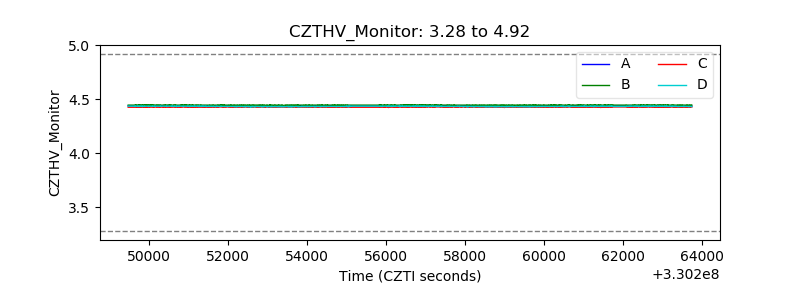 |
| D_VDD | 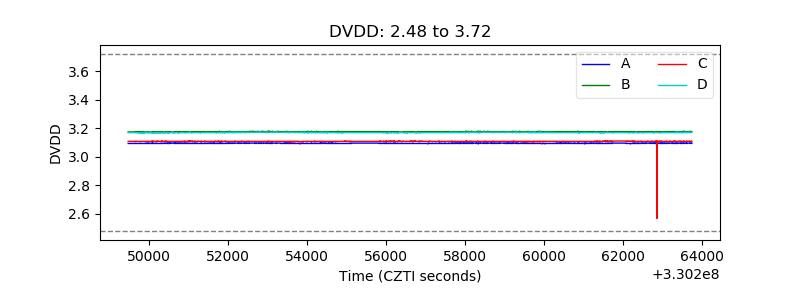 |
| Temperature 1 | 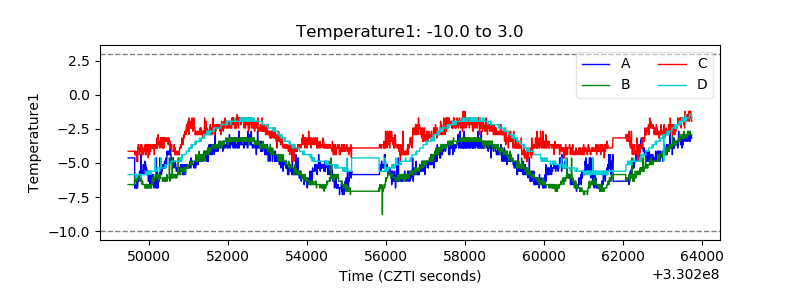 |
| Veto HV Monitor | 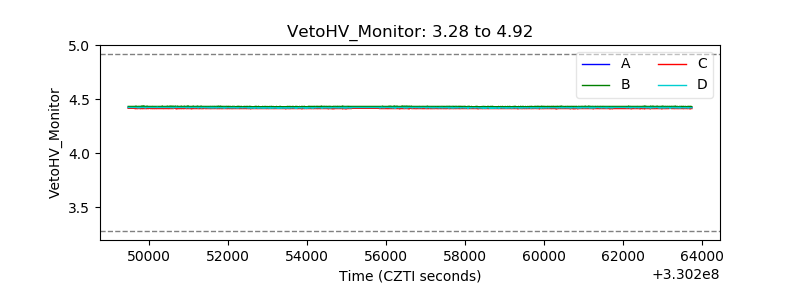 |
| Veto LLD | 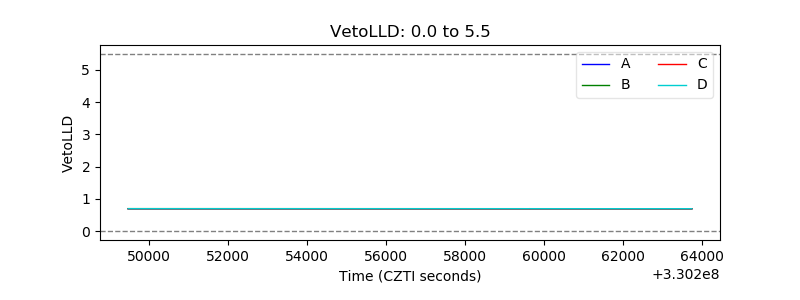 |
| Alpha Counter |  |
| _CPM_Rate | 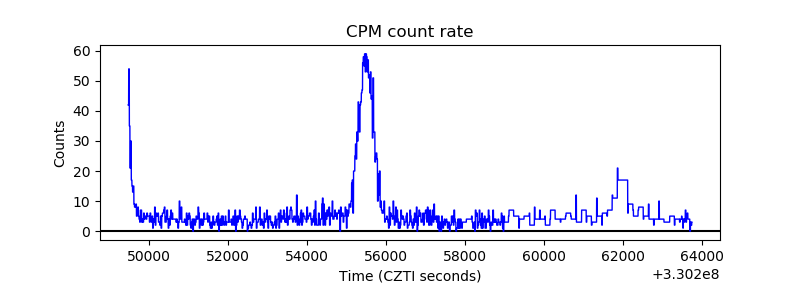 |
| CZT Counter | 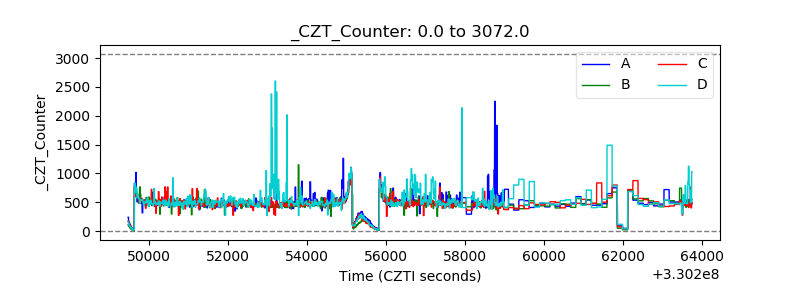 |
| +2.5 Volts monitor |  |
| +5 Volts monitor |  |
| _ROLL_ROT | 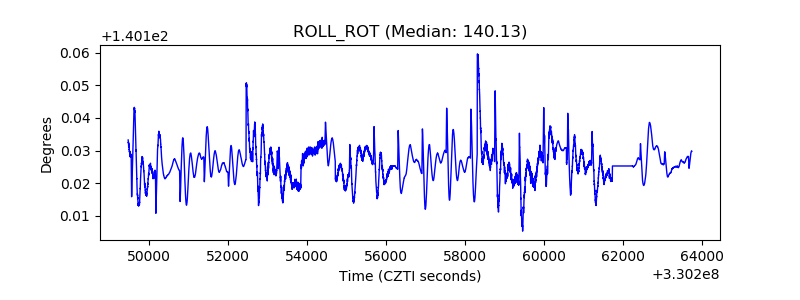 |
| _Roll_DEC | 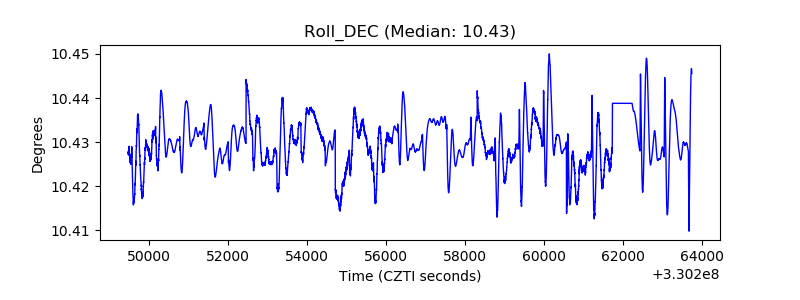 |
| _Roll_RA |  |
| Veto Counter | 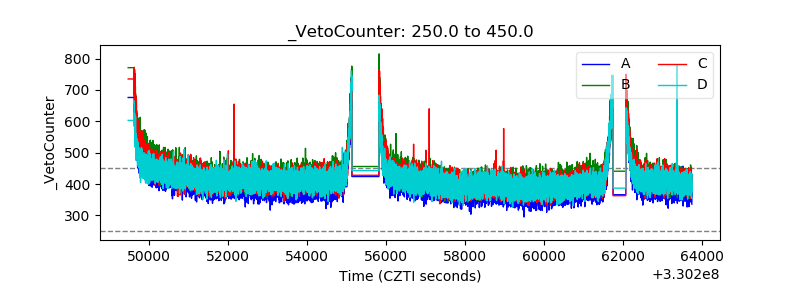 |