| Param | Original file | Final file |
|---|---|---|
| Filename | modeM0/AS1A09_008T05_9000003724_25553cztM0_level2.evt | modeM0/AS1A09_008T05_9000003724_25553cztM0_level2_quad_clean.evt |
| Size (bytes) | 612,135,360 | 92,525,760 |
| Size | 583.8 MB | 88.2 MB |
| Events in quadrant A | 4,084,993 | 587,392 |
| Events in quadrant B | 3,975,530 | 592,852 |
| Events in quadrant C | 3,991,699 | 555,581 |
| Events in quadrant D | 5,941,835 | 508,048 |
| Mode M0 | |||
|---|---|---|---|
| Quadrant | BADHDUFLAG | Total packets | Discarded packets |
| A | 0 | 17172 | 0 |
| B | 0 | 16786 | 0 |
| C | 0 | 16863 | 0 |
| D | 0 | 22743 | 0 |
| Mode M9 | |||
|---|---|---|---|
| Quadrant | BADHDUFLAG | Total packets | Discarded packets |
| A | 0 | 6 | 0 |
| B | 0 | 6 | 0 |
| C | 0 | 6 | 0 |
| D | 0 | 6 | 0 |
| Quadrant | Total seconds | Saturated seconds | Saturation percentage |
|---|---|---|---|
| A | 8025 | 270 | 3.364486% |
| B | 8025 | 294 | 3.663551% |
| C | 8026 | 322 | 4.011961% |
| D | 8026 | 787 | 9.805632% |
Noise dominated data is calculated using 1-second bins in cleaned event files. If a bin has >2000 counts, and if more than 50% of those come from <1% of pixels, then it is considered to be noise-dominated and hence unusable.
| Quadrant | # 1 sec bins | Bins with >0 counts | Bins with >2000 counts | High rate bins dominated by noise | Noise dominated (total time) | Noise dominated (detector-on time) | Marked lightcurve |
|---|---|---|---|---|---|---|---|
| A | 8625 | 8027 | 0 | 0 | 0.00% | 0.00% | 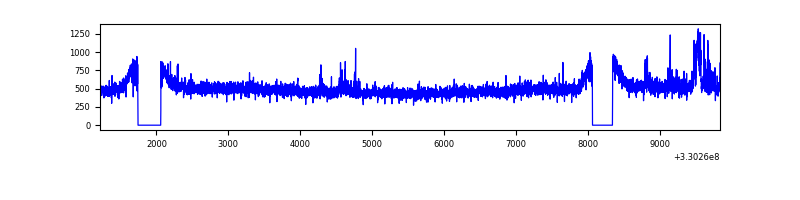 |
| B | 8625 | 8027 | 0 | 0 | 0.00% | 0.00% | 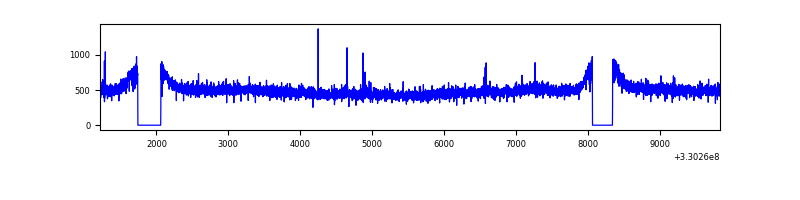 |
| C | 8626 | 8028 | 6 | 6 | 0.07% | 0.07% | 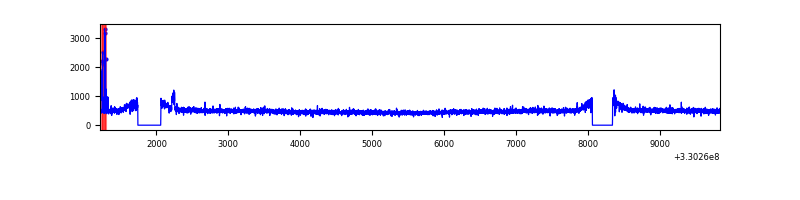 |
| D | 8626 | 8028 | 518 | 518 | 6.01% | 6.45% | 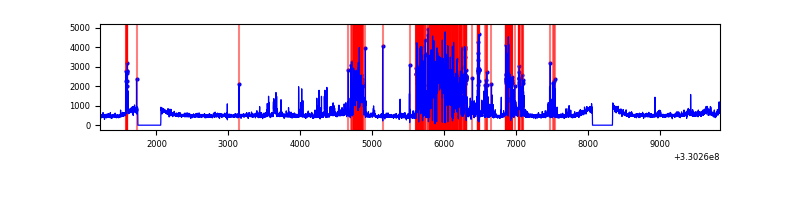 |
Top three noisy pixels from each quadrant. If the there are fewer than three noisy pixels in the level2.evt file, extra rows are filled as -1
| Pixel properties | Quadrant properties | ||||||
|---|---|---|---|---|---|---|---|
| Quadrant | DetID | PixID | Counts | Sigma | Mean | Median | Sigma |
| A | 6 | 16 | 141520 | 676.66 | 1023 | 998 | 207.7 |
| A | 13 | 254 | 10446 | 45.49 | 1023 | 998 | 207.7 |
| A | 3 | 137 | 9987 | 43.28 | 1023 | 998 | 207.7 |
| B | 12 | 111 | 24685 | 120.27 | 1009 | 980 | 197.1 |
| B | 11 | 111 | 23080 | 112.12 | 1009 | 980 | 197.1 |
| B | 14 | 111 | 20998 | 101.56 | 1009 | 980 | 197.1 |
| C | 14 | 238 | 155239 | 675.71 | 970 | 974 | 228.3 |
| C | 2 | 16 | 53060 | 228.15 | 970 | 974 | 228.3 |
| C | 13 | 61 | 6580 | 24.56 | 970 | 974 | 228.3 |
| D | 1 | 52 | 2131338 | 9222.78 | 947 | 917 | 231.0 |
| D | 8 | 195 | 215663 | 929.65 | 947 | 917 | 231.0 |
| D | 2 | 234 | 30429 | 127.76 | 947 | 917 | 231.0 |
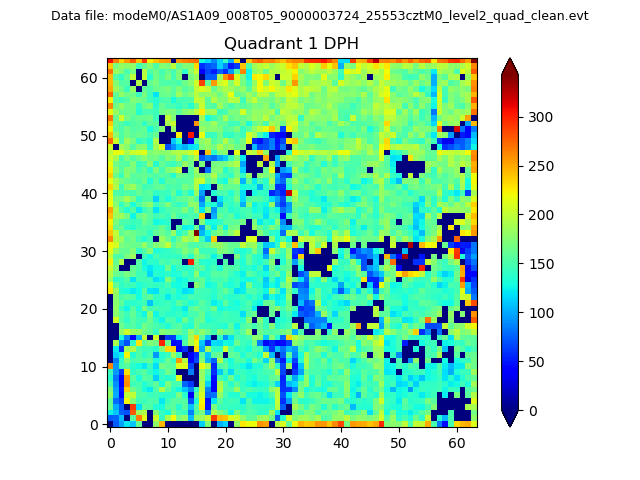
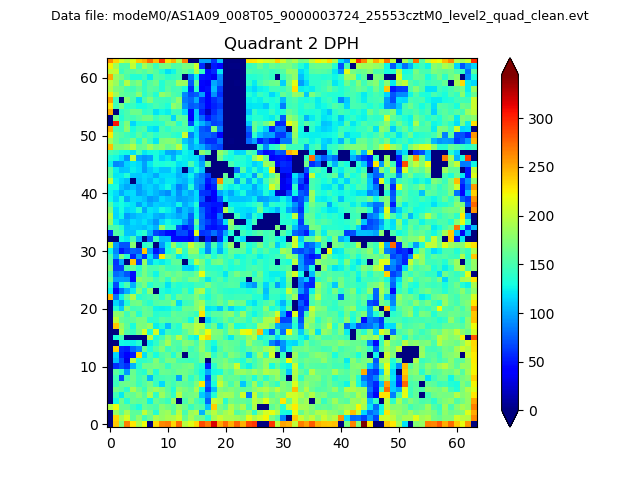
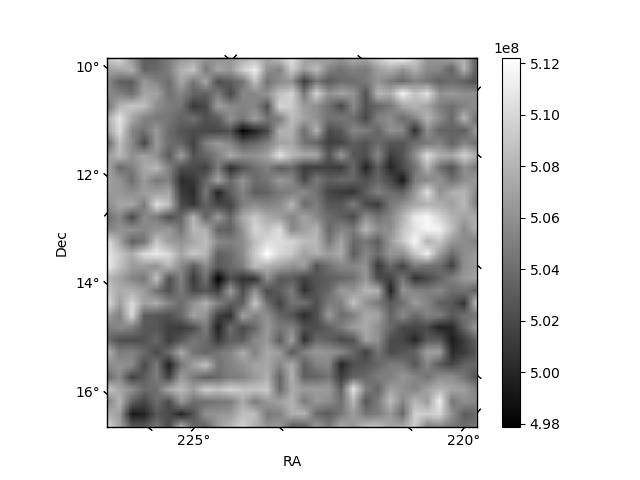
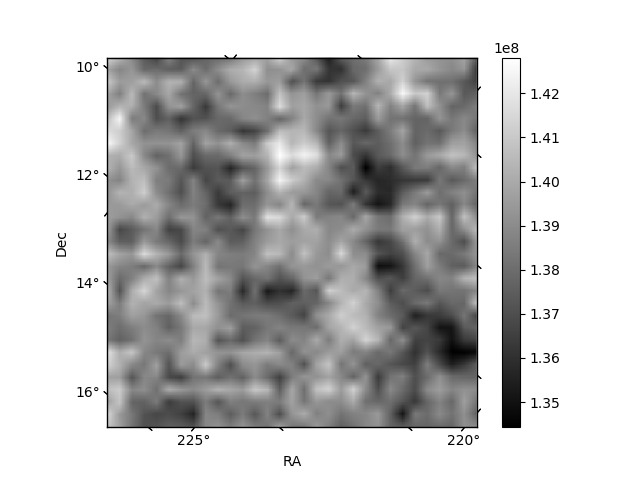
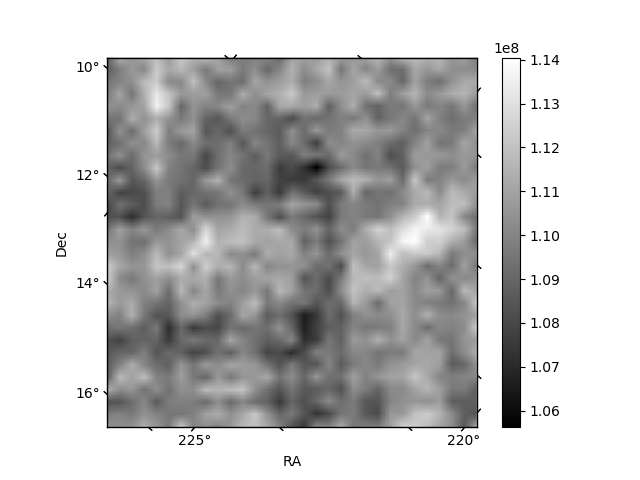
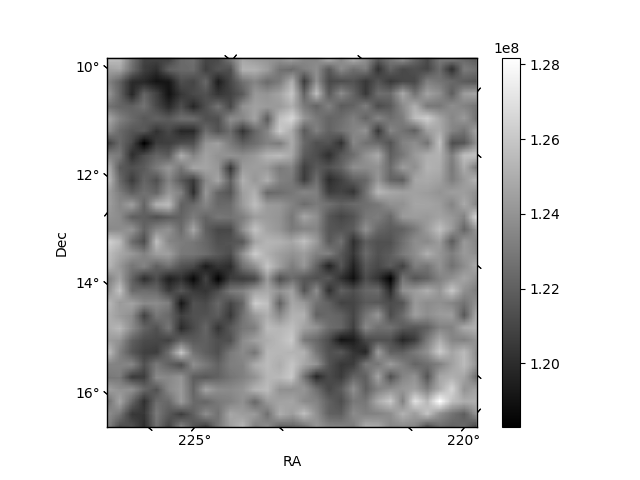
Histogram calculated using DETX and DETY for each event in the final _common_clean file
| Quadrant A |  |
 |
Quadrant B |
|---|---|---|---|
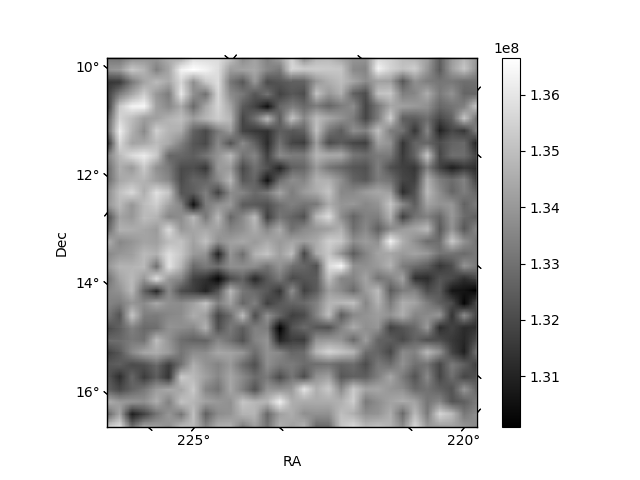
| Quadrant D | 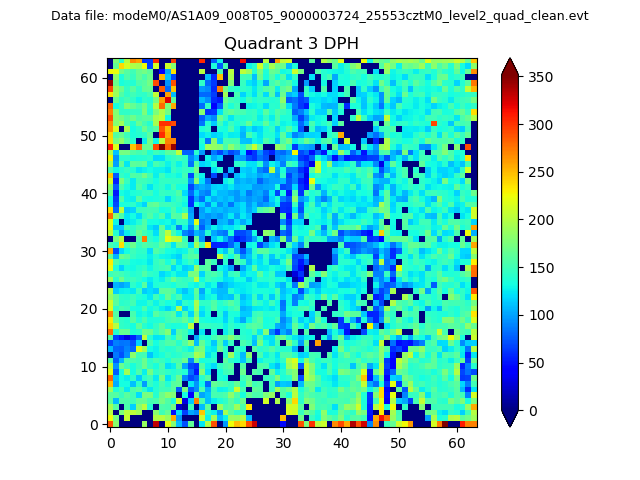 |
 |
Quadrant C |
| Plot type | Count rate plots | Images |
|---|---|---|
| Comparison with Poisson distribution Blue bars denote a histogram of data divided into 1 sec bins. Red curve is a Poisson curve with rate = median count rate of data. |
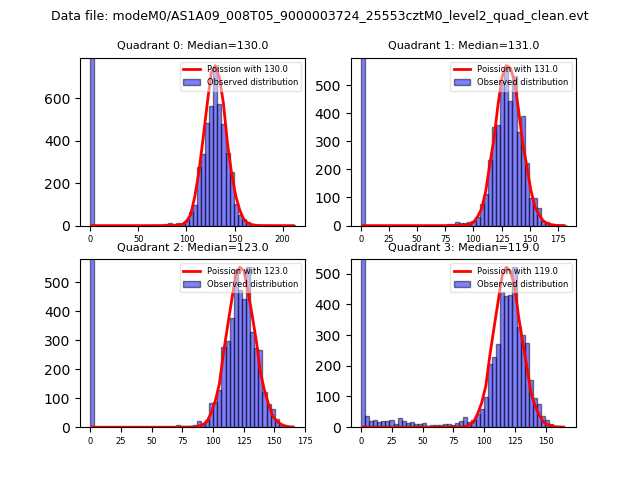 |
 |
| Quadrant-wise count rates Data is divided into 100 sec bins |
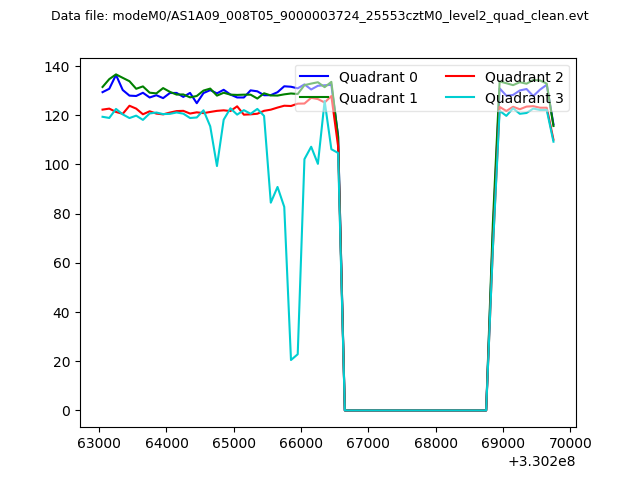 |
|
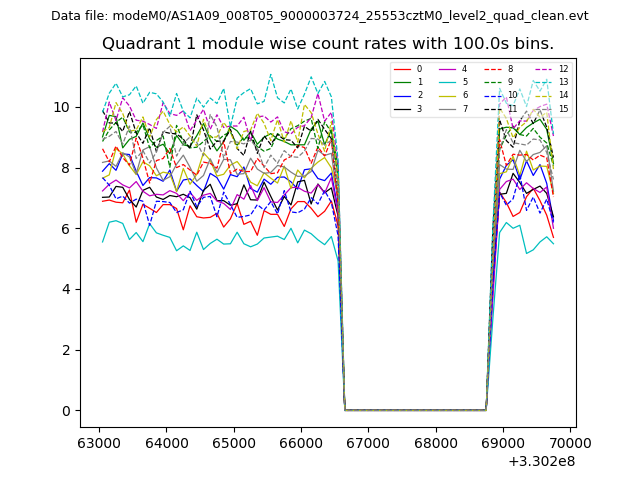
| Module-wise count rates for Quadrant A Data is divided into 100 sec bins |
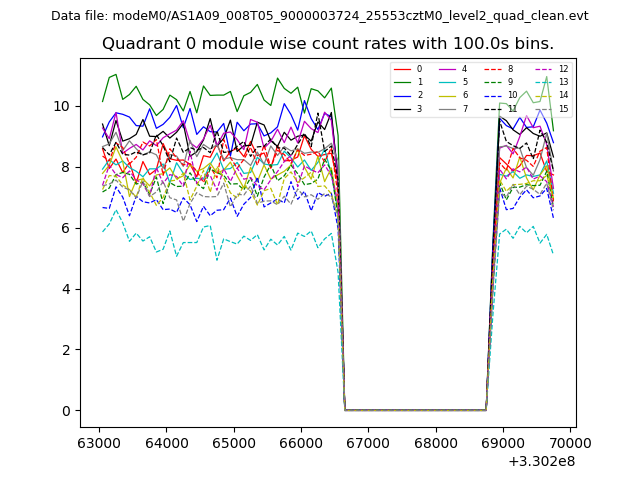 |
 |
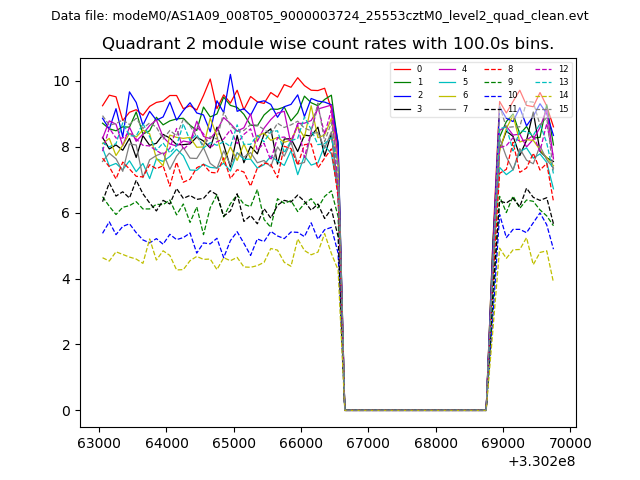
| Module-wise count rates for Quadrant B Data is divided into 100 sec bins |
 |
 |
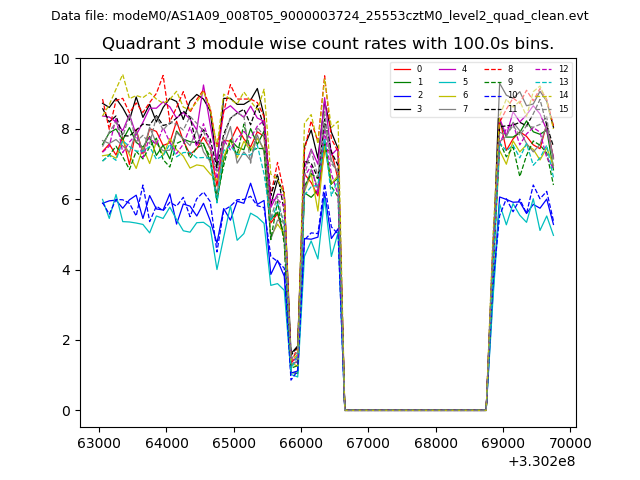
| Module-wise count rates for Quadrant C Data is divided into 100 sec bins |
 |
 |
| Module-wise count rates for Quadrant D Data is divided into 100 sec bins |
 |
 |
| Parameter | Plot |
|---|---|
| CZT HV Monitor | 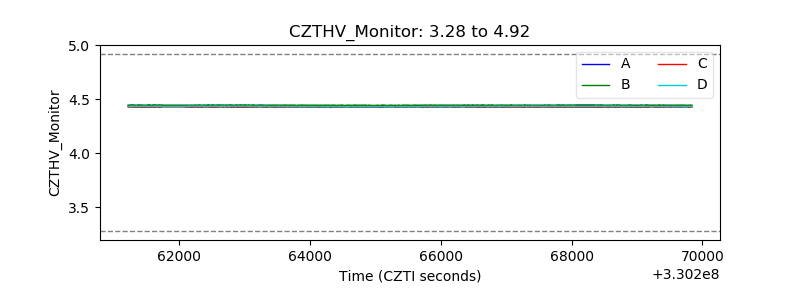 |
| D_VDD | 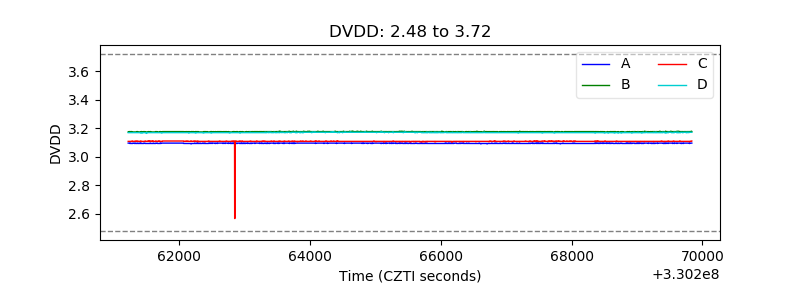 |
| Temperature 1 | 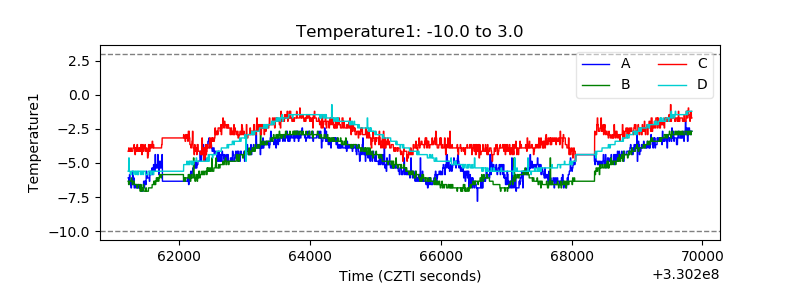 |
| Veto HV Monitor | 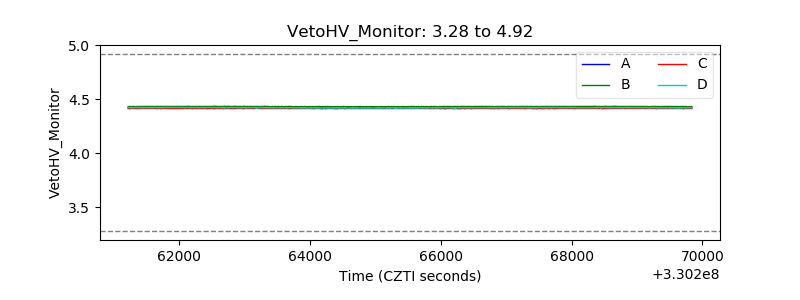 |
| Veto LLD | 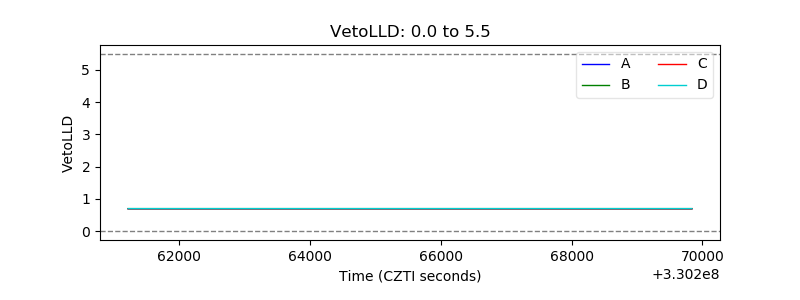 |
| Alpha Counter | 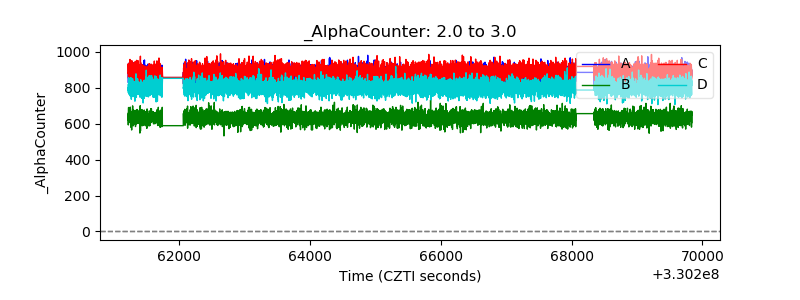 |
| _CPM_Rate |  |
| CZT Counter | 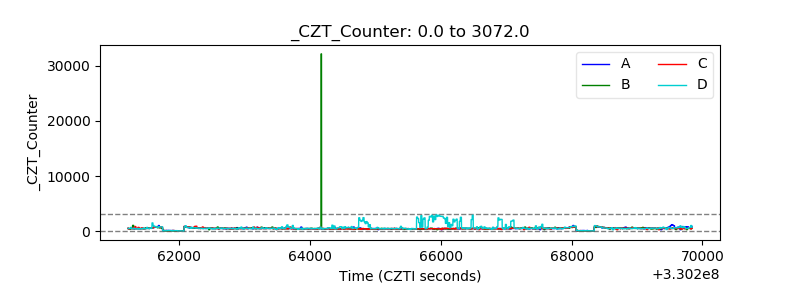 |
| +2.5 Volts monitor | 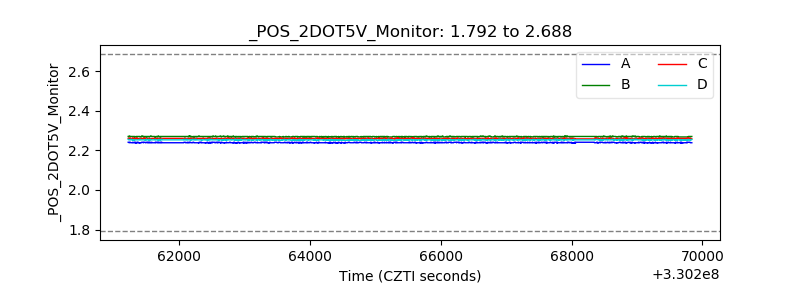 |
| +5 Volts monitor | 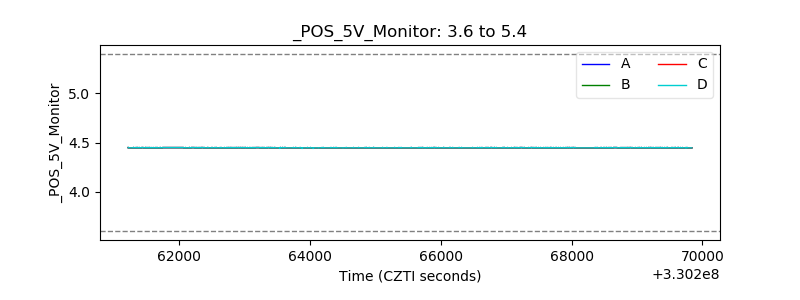 |
| _ROLL_ROT | 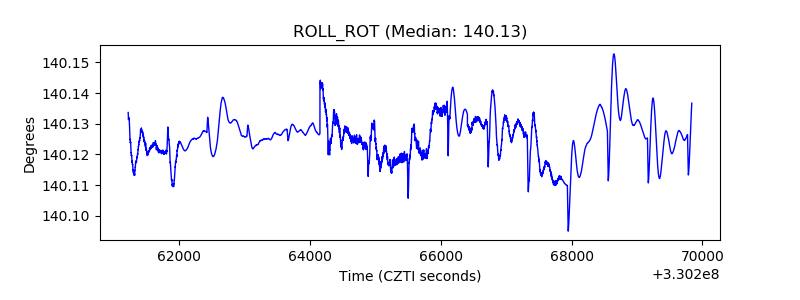 |
| _Roll_DEC | 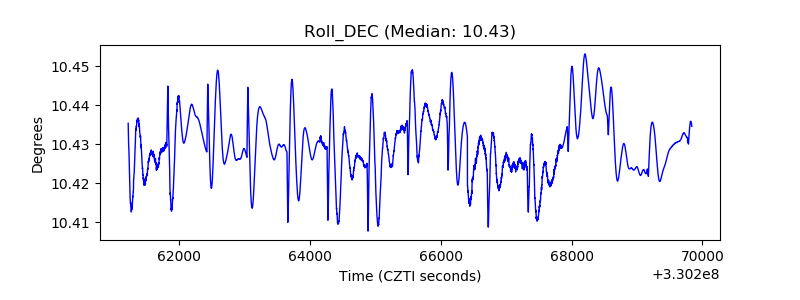 |
| _Roll_RA | 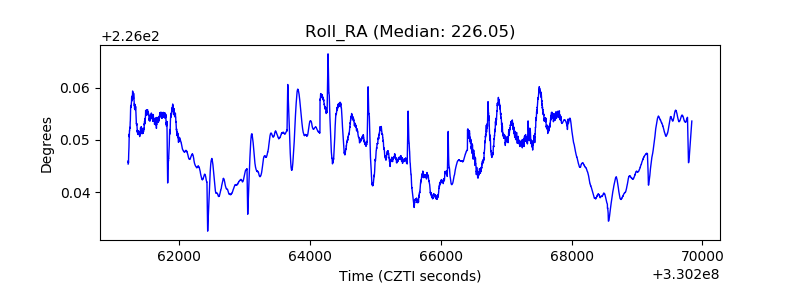 |
| Veto Counter | 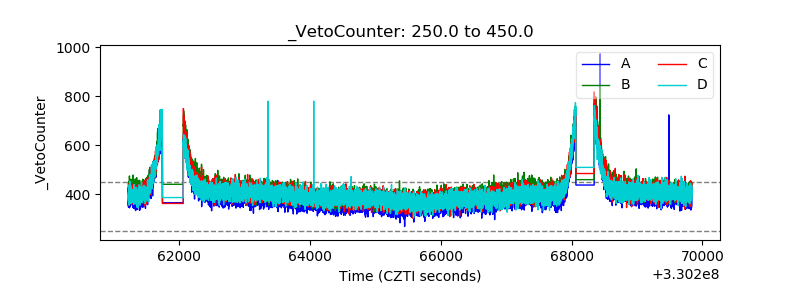 |