| Param | Original file | Final file |
|---|---|---|
| Filename | modeM0/AS1A09_008T05_9000003724_25556cztM0_level2.evt | modeM0/AS1A09_008T05_9000003724_25556cztM0_level2_quad_clean.evt |
| Size (bytes) | 1,443,133,440 | 238,599,360 |
| Size | 1.3 GB | 227.5 MB |
| Events in quadrant A | 9,795,483 | 1,549,859 |
| Events in quadrant B | 9,248,373 | 1,555,198 |
| Events in quadrant C | 9,144,378 | 1,471,604 |
| Events in quadrant D | 14,233,287 | 1,339,924 |
| Mode M0 | |||
|---|---|---|---|
| Quadrant | BADHDUFLAG | Total packets | Discarded packets |
| A | 0 | 41431 | 0 |
| B | 0 | 39563 | 0 |
| C | 0 | 39315 | 0 |
| D | 0 | 54815 | 0 |
| Mode M9 | |||
|---|---|---|---|
| Quadrant | BADHDUFLAG | Total packets | Discarded packets |
| A | 0 | 22 | 0 |
| B | 0 | 22 | 0 |
| C | 0 | 22 | 0 |
| D | 0 | 22 | 0 |
| Quadrant | Total seconds | Saturated seconds | Saturation percentage |
|---|---|---|---|
| A | 19015 | 318 | 1.672364% |
| B | 19015 | 344 | 1.809098% |
| C | 19015 | 432 | 2.271891% |
| D | 19016 | 1586 | 8.340345% |
Noise dominated data is calculated using 1-second bins in cleaned event files. If a bin has >2000 counts, and if more than 50% of those come from <1% of pixels, then it is considered to be noise-dominated and hence unusable.
| Quadrant | # 1 sec bins | Bins with >0 counts | Bins with >2000 counts | High rate bins dominated by noise | Noise dominated (total time) | Noise dominated (detector-on time) | Marked lightcurve |
|---|---|---|---|---|---|---|---|
| A | 21115 | 19019 | 0 | 0 | 0.00% | 0.00% | 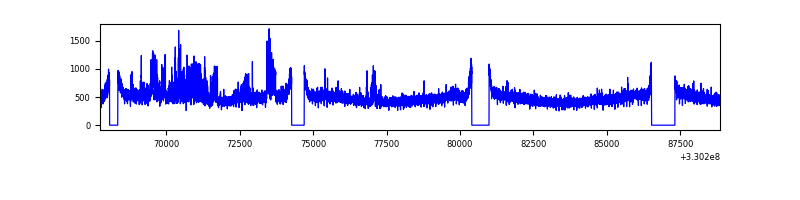 |
| B | 21115 | 19019 | 2 | 2 | 0.01% | 0.01% | 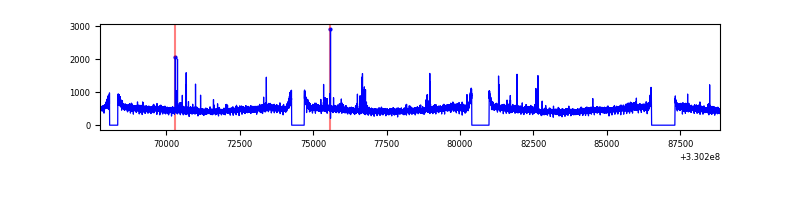 |
| C | 21115 | 19019 | 0 | 0 | 0.00% | 0.00% | 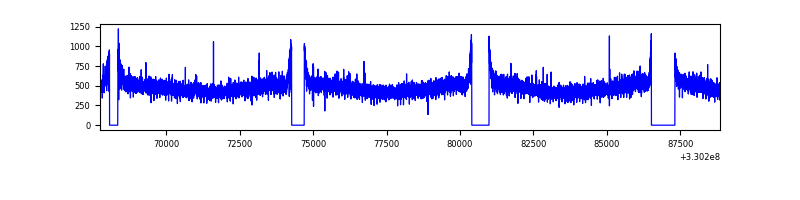 |
| D | 21116 | 19020 | 1049 | 1049 | 4.97% | 5.52% | 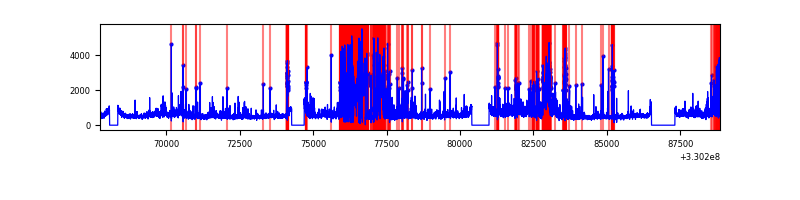 |
Top three noisy pixels from each quadrant. If the there are fewer than three noisy pixels in the level2.evt file, extra rows are filled as -1
| Pixel properties | Quadrant properties | ||||||
|---|---|---|---|---|---|---|---|
| Quadrant | DetID | PixID | Counts | Sigma | Mean | Median | Sigma |
| A | 6 | 16 | 730571 | 1548.5 | 2352 | 2306 | 470.3 |
| A | 13 | 254 | 26724 | 51.92 | 2352 | 2306 | 470.3 |
| A | 3 | 137 | 22807 | 43.59 | 2352 | 2306 | 470.3 |
| B | 3 | 112 | 66552 | 143.65 | 2325 | 2263 | 447.5 |
| B | 12 | 111 | 56347 | 120.85 | 2325 | 2263 | 447.5 |
| B | 11 | 111 | 51447 | 109.9 | 2325 | 2263 | 447.5 |
| C | 14 | 238 | 358582 | 676.33 | 2244 | 2257 | 526.8 |
| C | 3 | 233 | 28750 | 50.28 | 2244 | 2257 | 526.8 |
| C | 2 | 16 | 22594 | 38.6 | 2244 | 2257 | 526.8 |
| D | 1 | 52 | 4631798 | 8675.26 | 2189 | 2129 | 533.7 |
| D | 8 | 195 | 811663 | 1516.94 | 2189 | 2129 | 533.7 |
| D | 13 | 104 | 290665 | 540.67 | 2189 | 2129 | 533.7 |
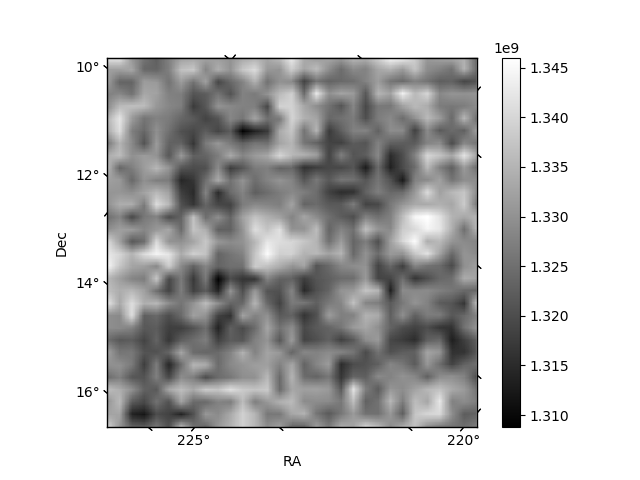
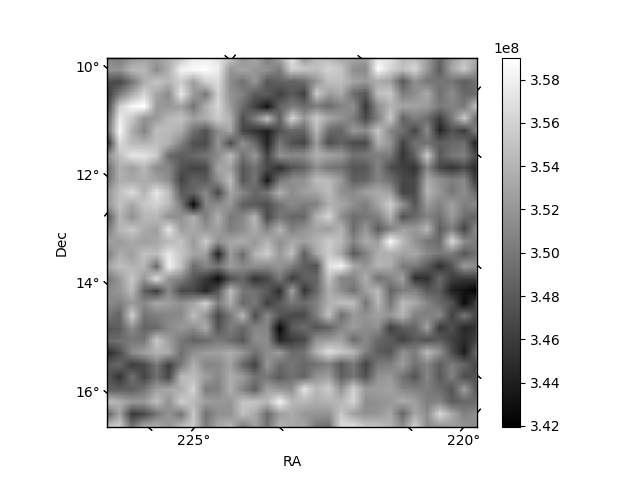
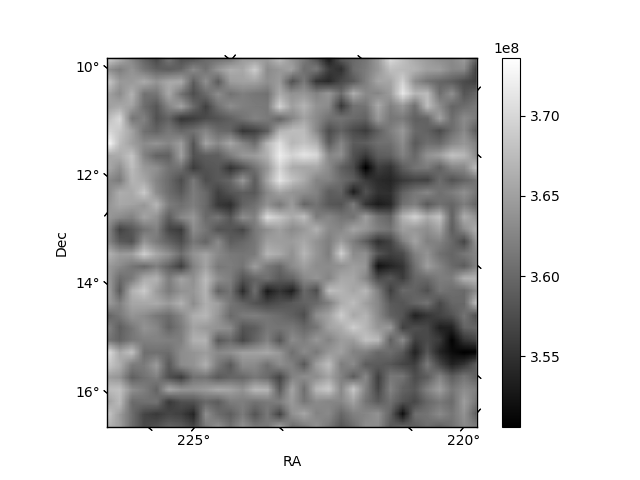
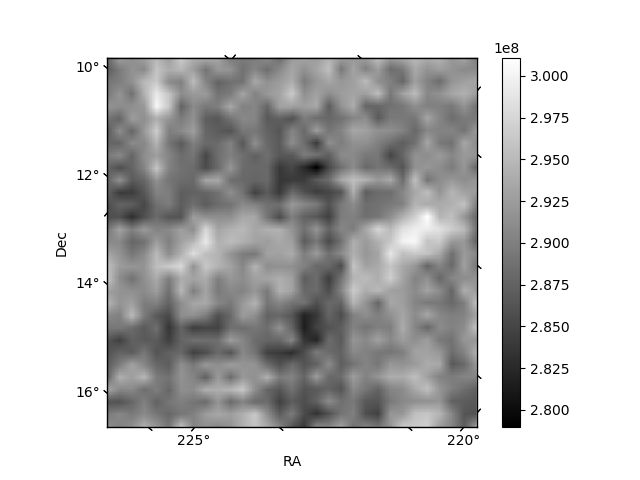
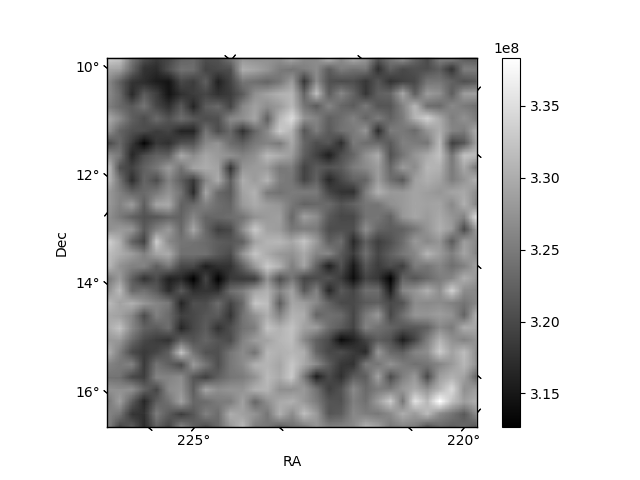
Histogram calculated using DETX and DETY for each event in the final _common_clean file
| Quadrant A | 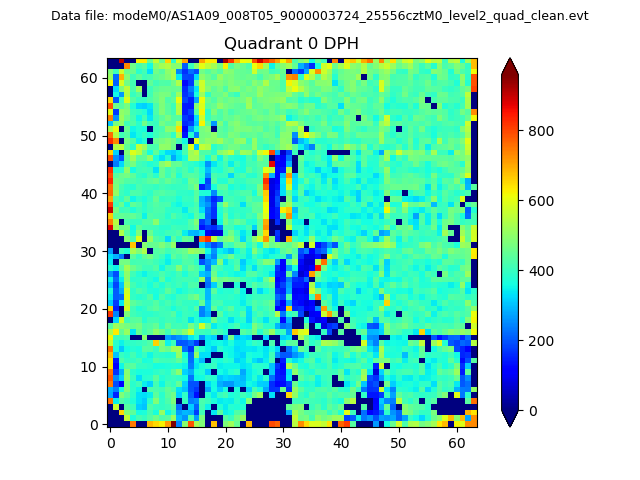 |
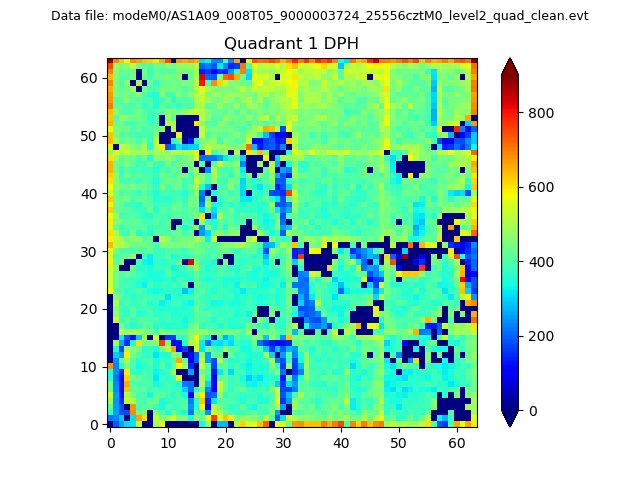 |
Quadrant B |
|---|---|---|---|
| Quadrant D |  |
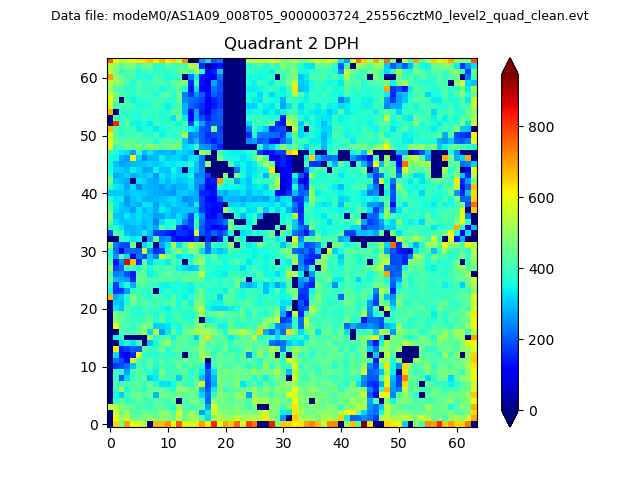 |
Quadrant C |
| Plot type | Count rate plots | Images |
|---|---|---|
| Comparison with Poisson distribution Blue bars denote a histogram of data divided into 1 sec bins. Red curve is a Poisson curve with rate = median count rate of data. |
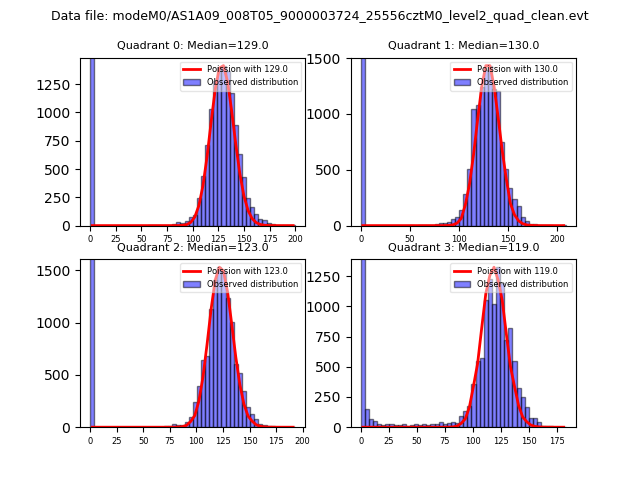 |
 |
| Quadrant-wise count rates Data is divided into 100 sec bins |
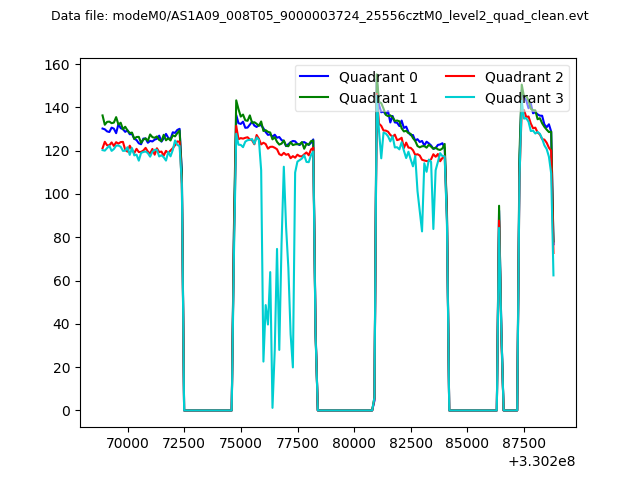 |
|
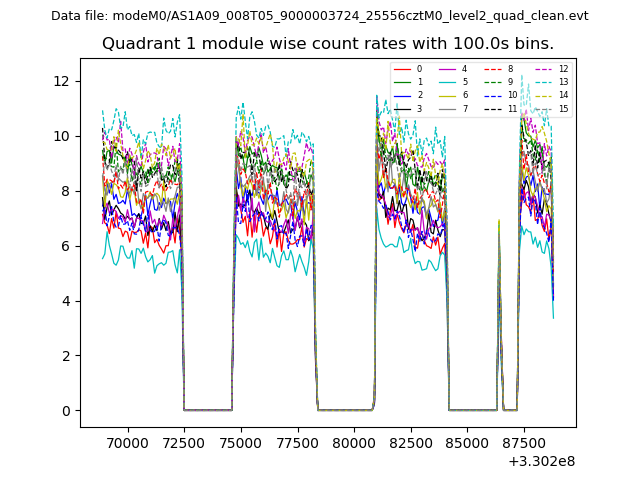
| Module-wise count rates for Quadrant A Data is divided into 100 sec bins |
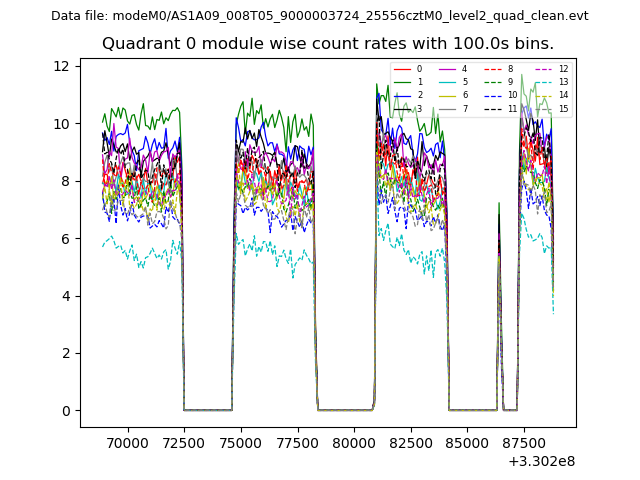 |
 |
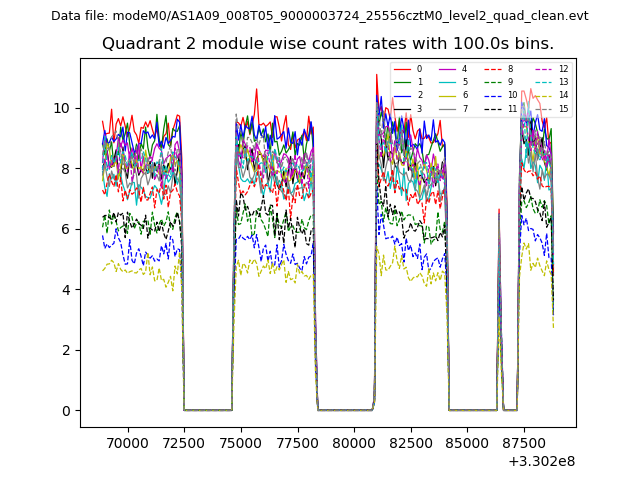
| Module-wise count rates for Quadrant B Data is divided into 100 sec bins |
 |
 |
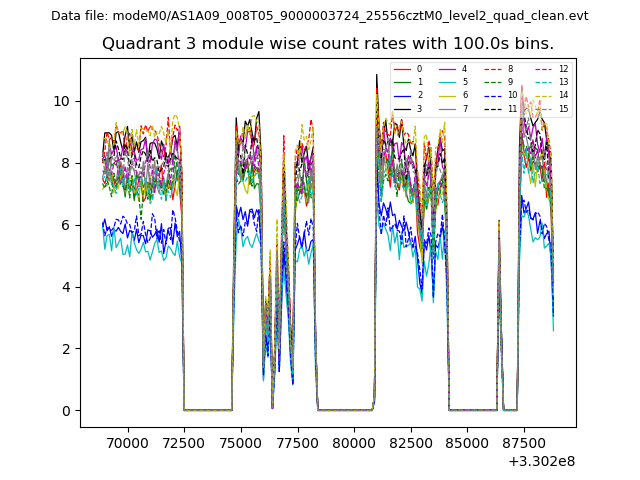
| Module-wise count rates for Quadrant C Data is divided into 100 sec bins |
 |
 |
| Module-wise count rates for Quadrant D Data is divided into 100 sec bins |
 |
 |
| Parameter | Plot |
|---|---|
| CZT HV Monitor | 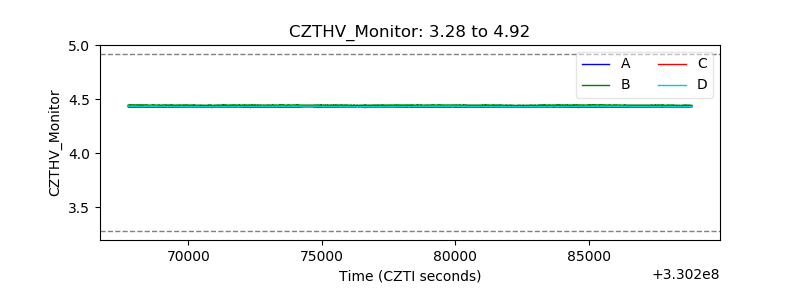 |
| D_VDD | 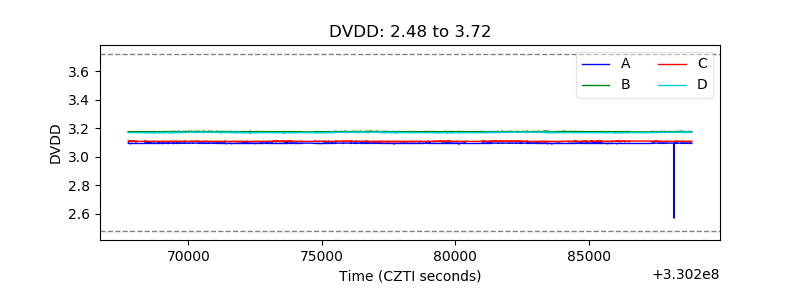 |
| Temperature 1 | 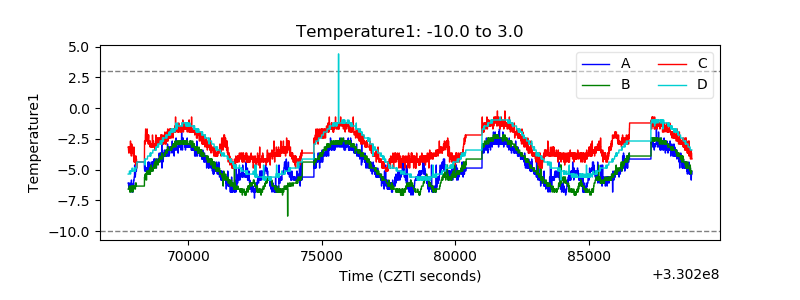 |
| Veto HV Monitor | 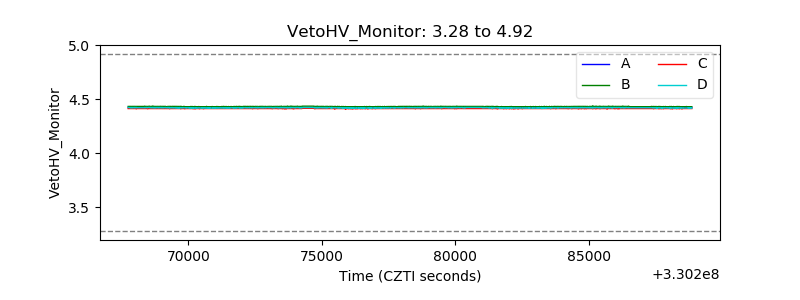 |
| Veto LLD | 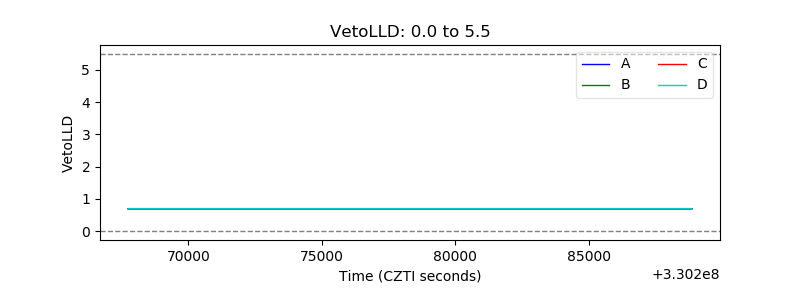 |
| Alpha Counter | 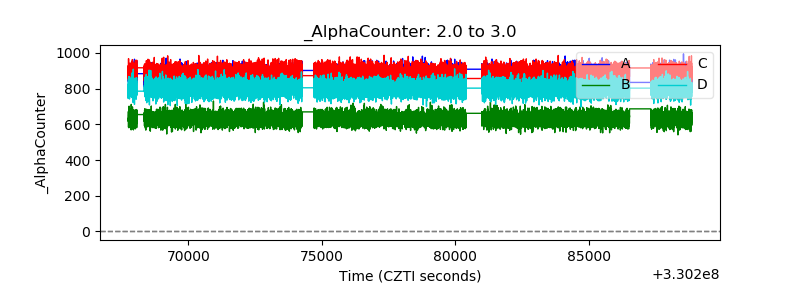 |
| _CPM_Rate |  |
| CZT Counter | 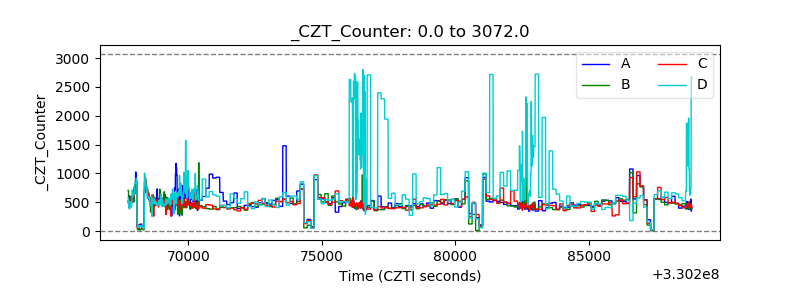 |
| +2.5 Volts monitor | 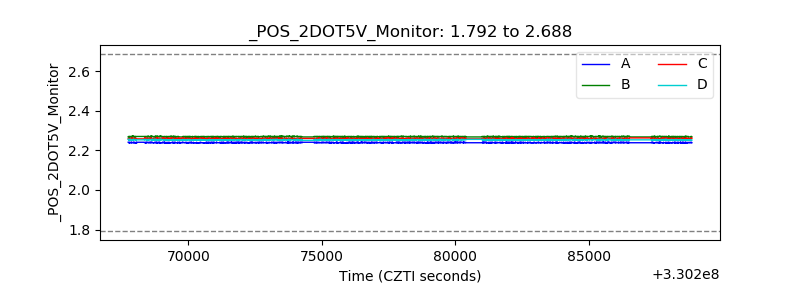 |
| +5 Volts monitor | 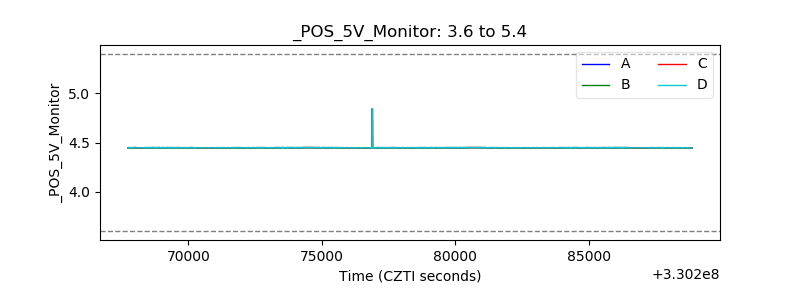 |
| _ROLL_ROT | 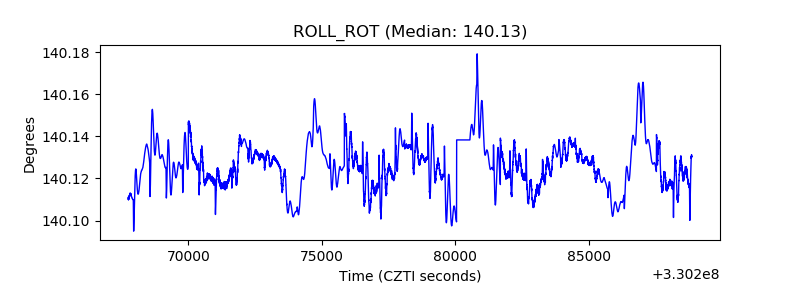 |
| _Roll_DEC | 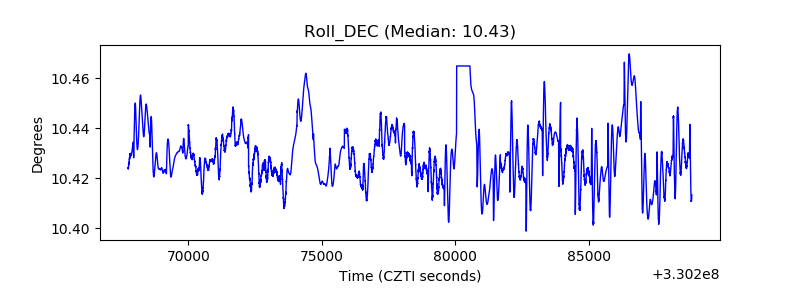 |
| _Roll_RA | 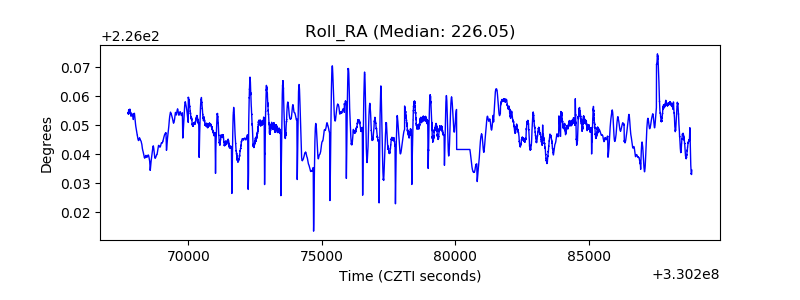 |
| Veto Counter | 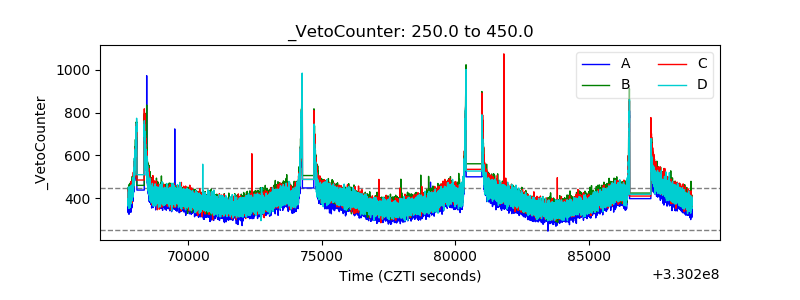 |