| Param | Original file | Final file |
|---|---|---|
| Filename | modeM0/AS1A09_043T02_9000003726cztM0_level2.fits | modeM0/AS1A09_043T02_9000003726cztM0_level2_quad_clean.evt |
| Size (bytes) | 1,986,448,320 | 1,541,885,760 |
| Size | 1.9 GB | 1.4 GB |
| Events in quadrant A | 12,612,404 | 8,916,701 |
| Events in quadrant B | 12,080,428 | 8,953,740 |
| Events in quadrant C | 11,952,874 | 8,309,712 |
| Events in quadrant D | 10,218,760 | 7,219,040 |
| Mode M0 | |||
|---|---|---|---|
| Quadrant | BADHDUFLAG | Total packets | Discarded packets |
| A | 0 | 433047 | 0 |
| B | 0 | 420002 | 0 |
| C | 0 | 411223 | 0 |
| D | 0 | 607121 | 0 |
| Mode M9 | |||
|---|---|---|---|
| Quadrant | BADHDUFLAG | Total packets | Discarded packets |
| A | 0 | 326 | 0 |
| B | 0 | 326 | 0 |
| C | 0 | 326 | 0 |
| D | 0 | 326 | 0 |
| Mode SS | |||
|---|---|---|---|
| Quadrant | BADHDUFLAG | Total packets | Discarded packets |
| A | 0 | 3948 | 0 |
| B | 0 | 3948 | 0 |
| C | 0 | 3948 | 0 |
| D | 0 | 3948 | 0 |
| Quadrant | Total seconds | Saturated seconds | Saturation percentage |
|---|---|---|---|
| A | 194049 | 4081 | 2.103077% |
| B | 194049 | 3294 | 1.697509% |
| C | 194049 | 3849 | 1.983520% |
| D | 194049 | 12521 | 6.452494% |
Noise dominated data is calculated using 1-second bins in cleaned event files. If a bin has >2000 counts, and if more than 50% of those come from <1% of pixels, then it is considered to be noise-dominated and hence unusable.
| Quadrant | # 1 sec bins | Bins with >0 counts | Bins with >2000 counts | High rate bins dominated by noise | Noise dominated (total time) | Noise dominated (detector-on time) | Marked lightcurve |
|---|---|---|---|---|---|---|---|
| A | 226387 | 194048 | 0 | 0 | 0.00% | 0.00% | 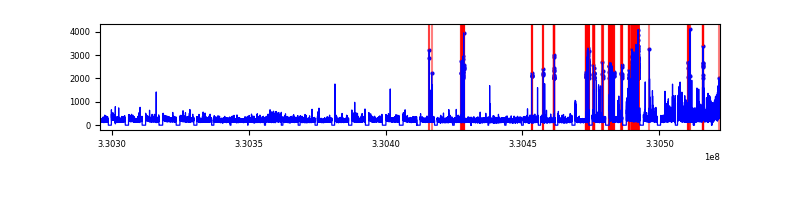 |
| B | 226387 | 194049 | 0 | 0 | 0.00% | 0.00% | 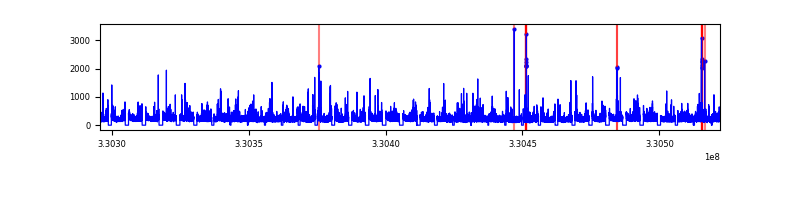 |
| C | 226387 | 194048 | 0 | 0 | 0.00% | 0.00% | 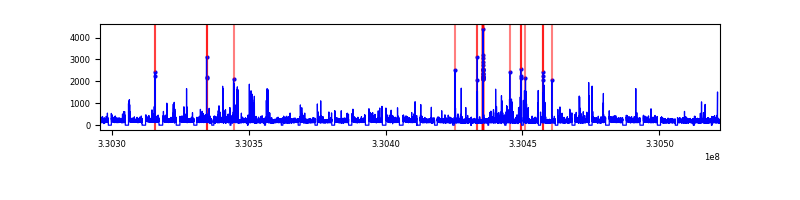 |
| D | 226387 | 193952 | 0 | 0 | 0.00% | 0.00% | 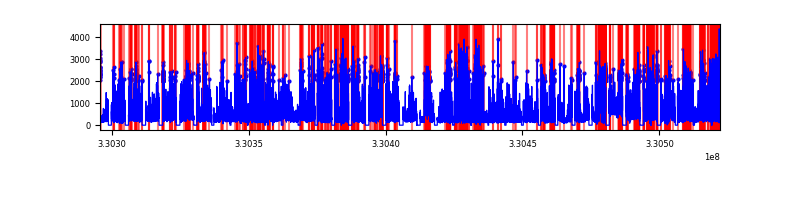 |
Top three noisy pixels from each quadrant. If the there are fewer than three noisy pixels in the level2.evt file, extra rows are filled as -1
| Pixel properties | Quadrant properties | ||||||
|---|---|---|---|---|---|---|---|
| Quadrant | DetID | PixID | Counts | Sigma | Mean | Median | Sigma |
| A | 0 | 29 | 10293 | 9.13 | 3286 | 3095 | 788.6 |
| A | 7 | 110 | 10074 | 8.85 | 3286 | 3095 | 788.6 |
| A | 9 | 19 | 9218 | 7.76 | 3286 | 3095 | 788.6 |
| B | 2 | 9 | 9521 | 10.46 | 3199 | 3062 | 617.2 |
| B | 5 | 128 | 7955 | 7.93 | 3199 | 3062 | 617.2 |
| B | 2 | 8 | 7853 | 7.76 | 3199 | 3062 | 617.2 |
| C | 1 | 81 | 8987 | 7.62 | 3155 | 2952 | 792.1 |
| C | 1 | 80 | 8976 | 7.6 | 3155 | 2952 | 792.1 |
| C | 12 | 241 | 8253 | 6.69 | 3155 | 2952 | 792.1 |
| D | 3 | 14 | 7309 | 6.04 | 2920 | 2659 | 770.0 |
| D | 7 | 3 | 7245 | 5.96 | 2920 | 2659 | 770.0 |
| D | 10 | 189 | 7201 | 5.9 | 2920 | 2659 | 770.0 |
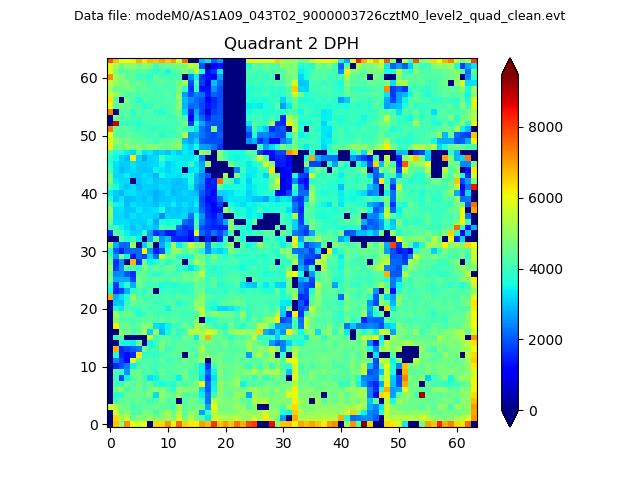
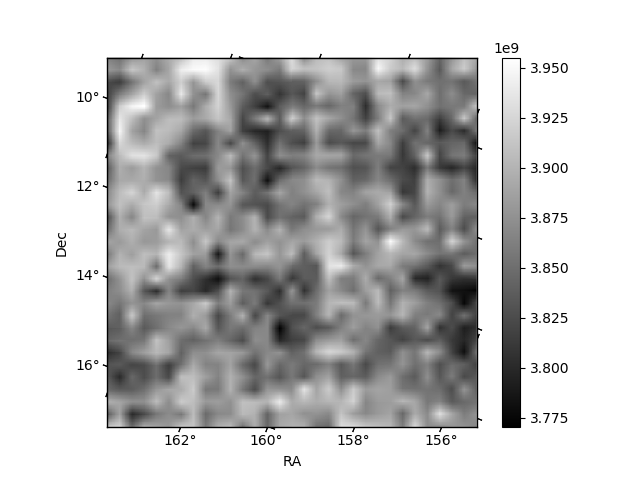
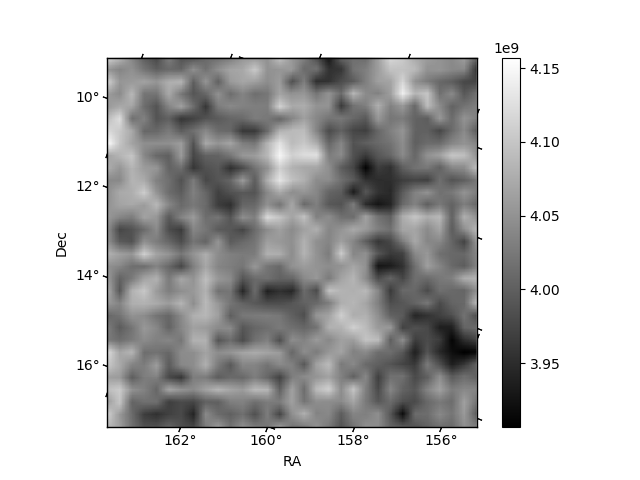
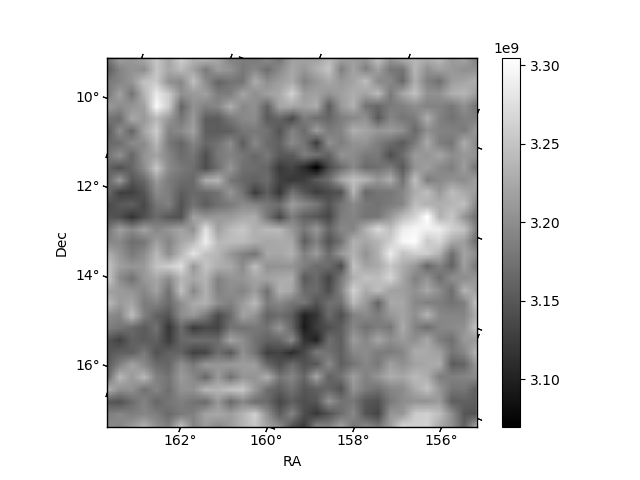
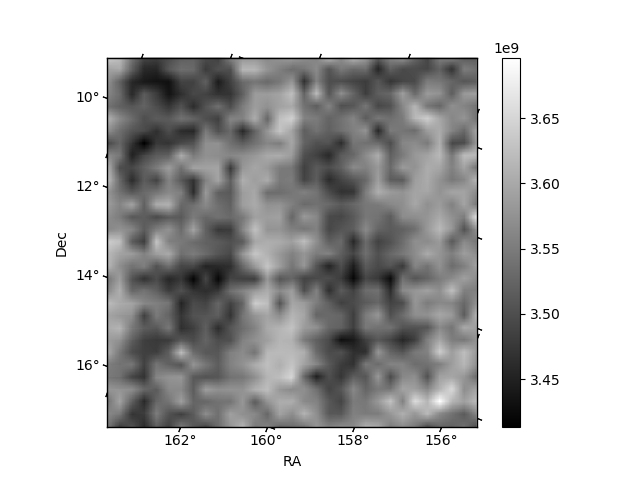
Histogram calculated using DETX and DETY for each event in the final _common_clean file
| Quadrant A | 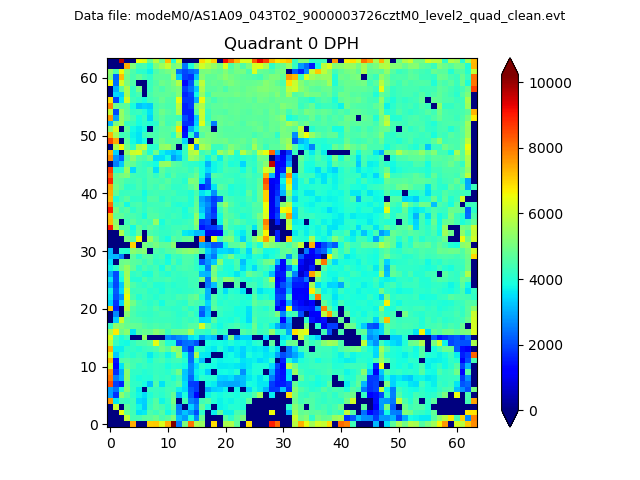 |
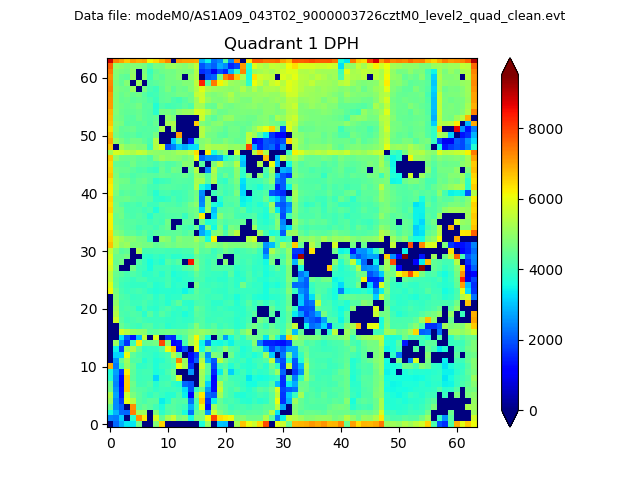 |
Quadrant B |
|---|---|---|---|
| Quadrant D | 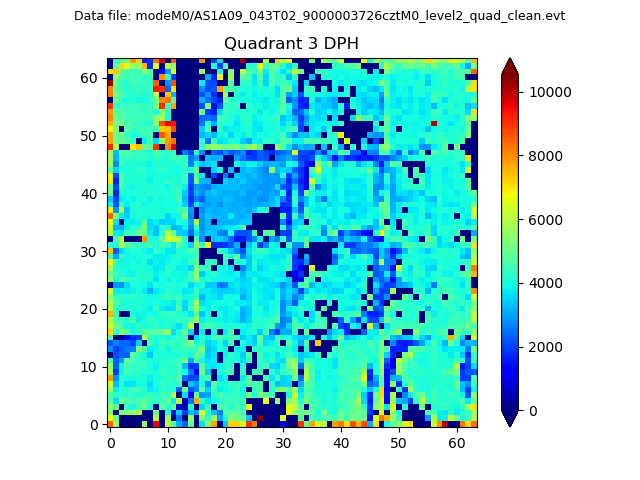 |
 |
Quadrant C |
| Plot type | Count rate plots | Images |
|---|---|---|
| Comparison with Poisson distribution Blue bars denote a histogram of data divided into 1 sec bins. Red curve is a Poisson curve with rate = median count rate of data. |
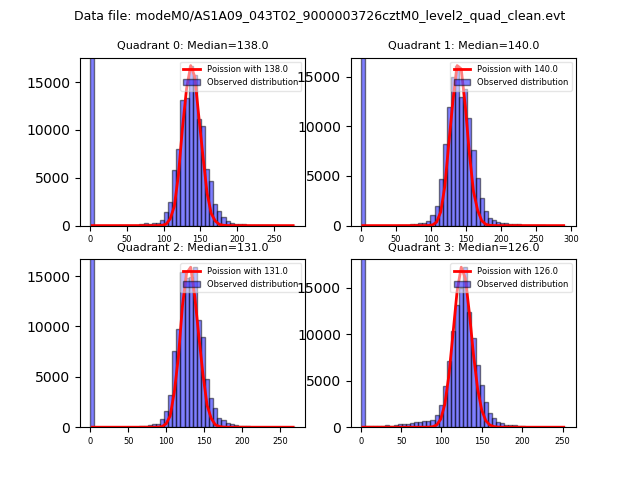 |
 |
| Quadrant-wise count rates Data is divided into 100 sec bins |
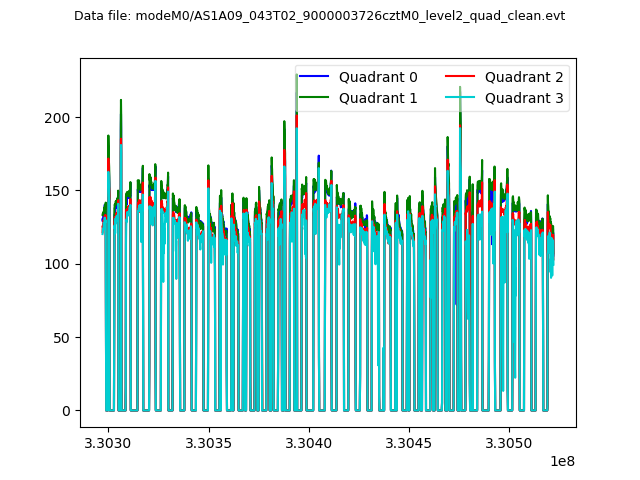 |
|
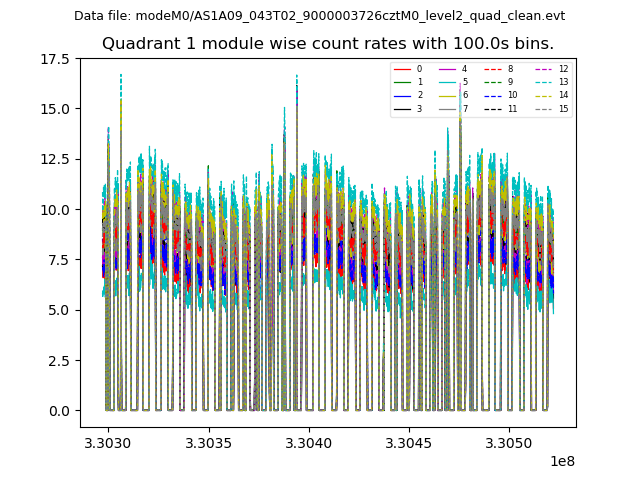
| Module-wise count rates for Quadrant A Data is divided into 100 sec bins |
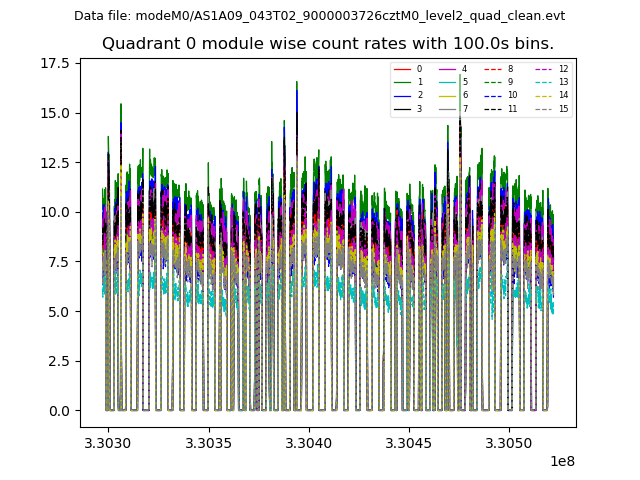 |
 |
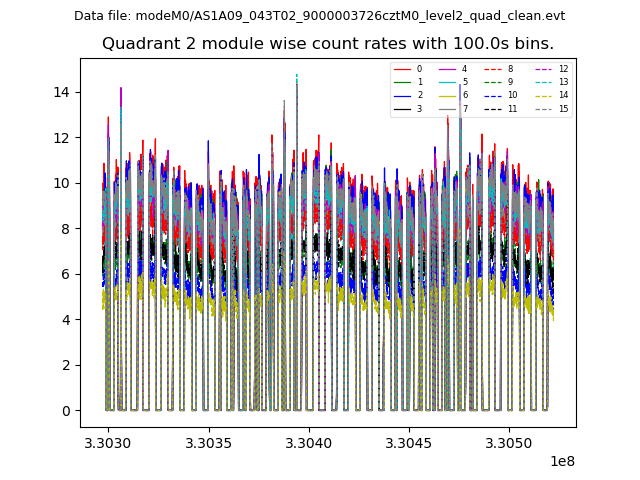
| Module-wise count rates for Quadrant B Data is divided into 100 sec bins |
 |
 |
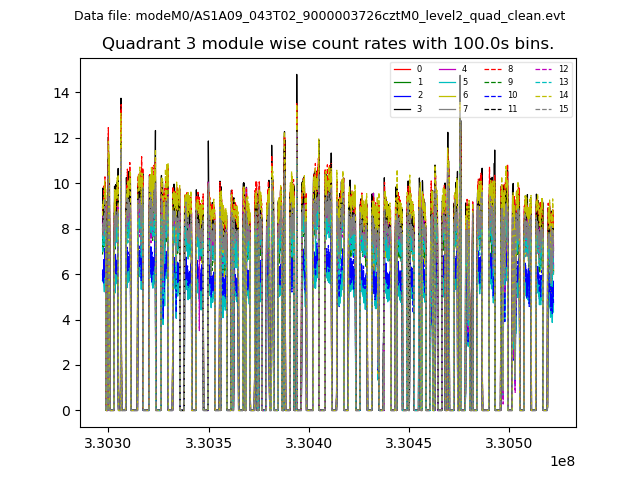
| Module-wise count rates for Quadrant C Data is divided into 100 sec bins |
 |
 |
| Module-wise count rates for Quadrant D Data is divided into 100 sec bins |
 |
 |
| Parameter | Plot |
|---|---|
| CZT HV Monitor | 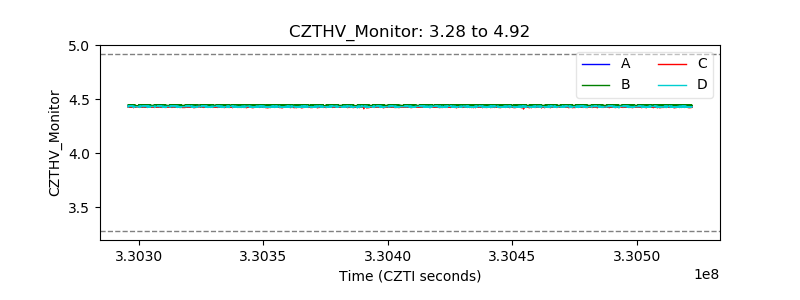 |
| D_VDD | 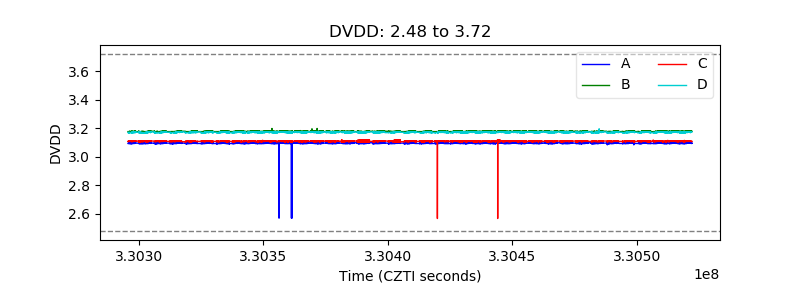 |
| Temperature 1 | 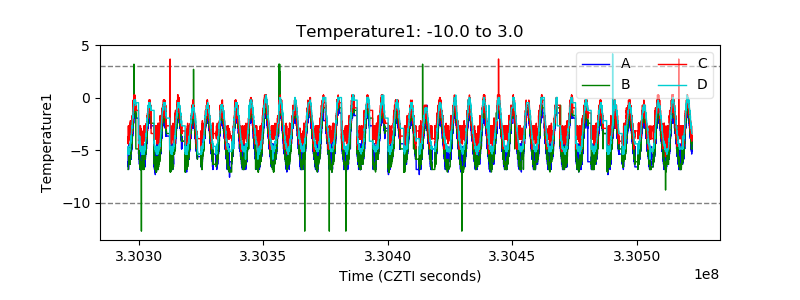 |
| Veto HV Monitor | 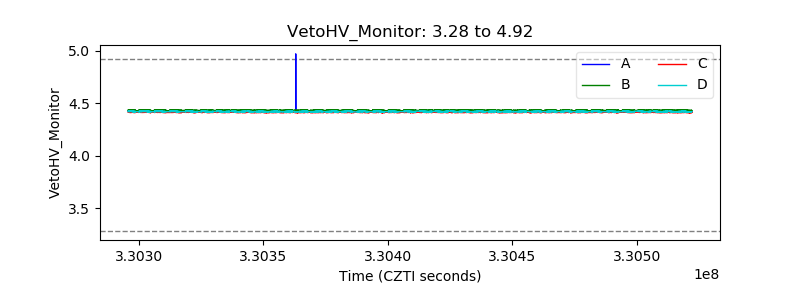 |
| Veto LLD | 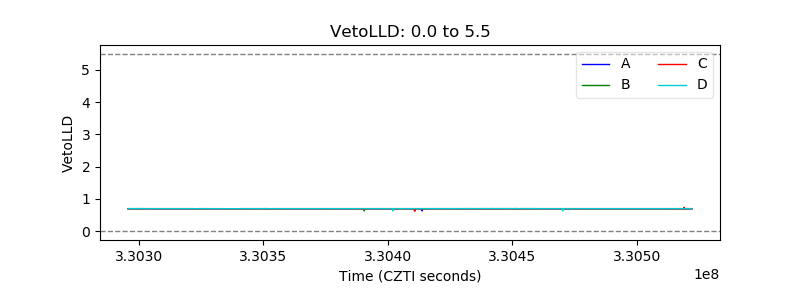 |
| Alpha Counter | 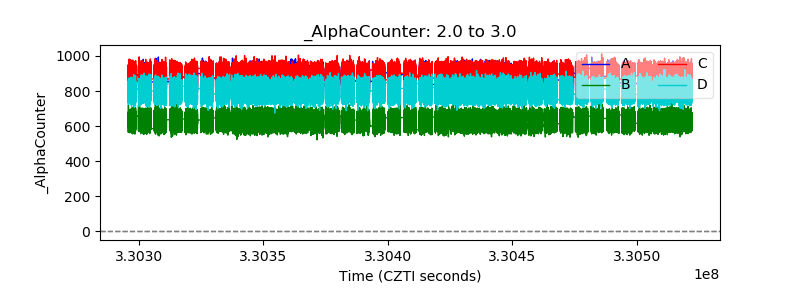 |
| _CPM_Rate | 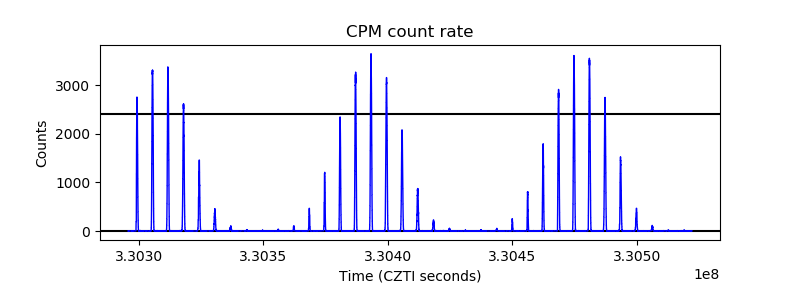 |
| CZT Counter | 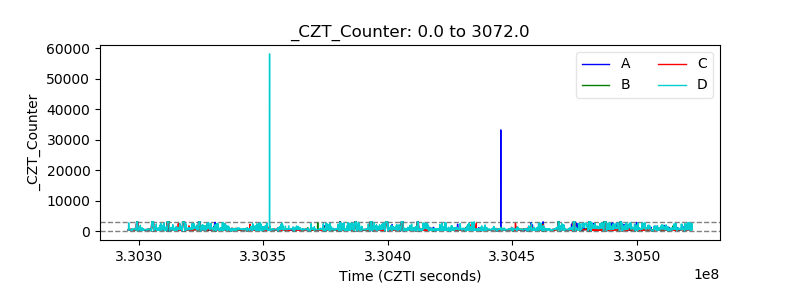 |
| +2.5 Volts monitor | 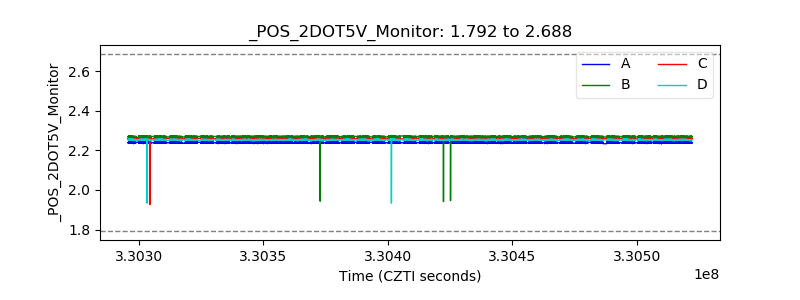 |
| +5 Volts monitor | 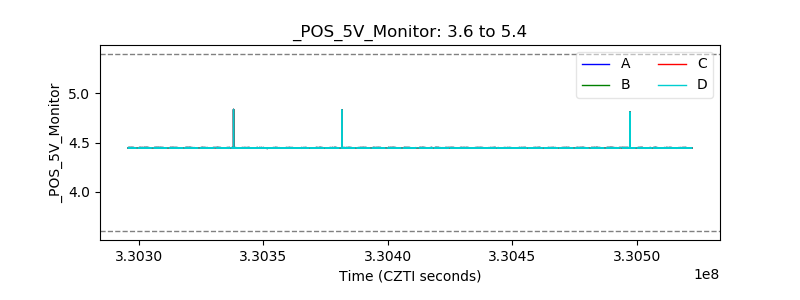 |
| _ROLL_ROT | 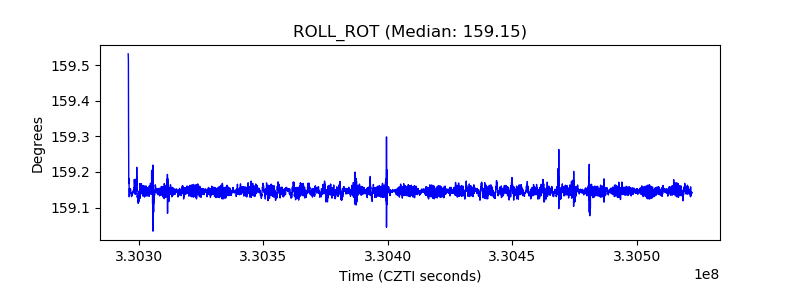 |
| _Roll_DEC | 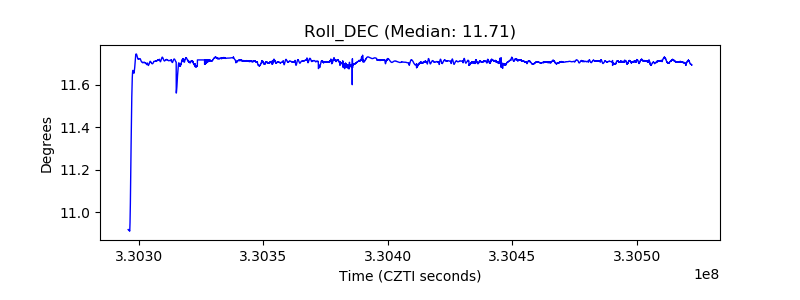 |
| _Roll_RA | 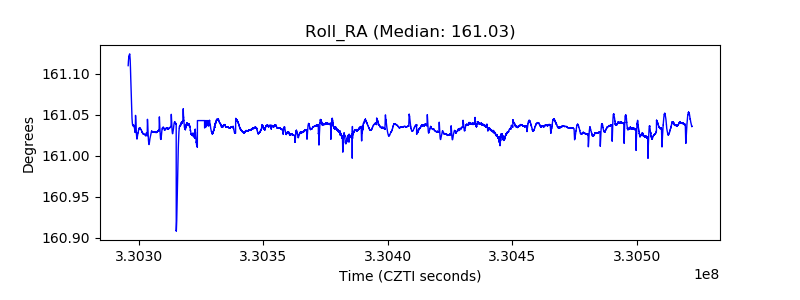 |
| Veto Counter | 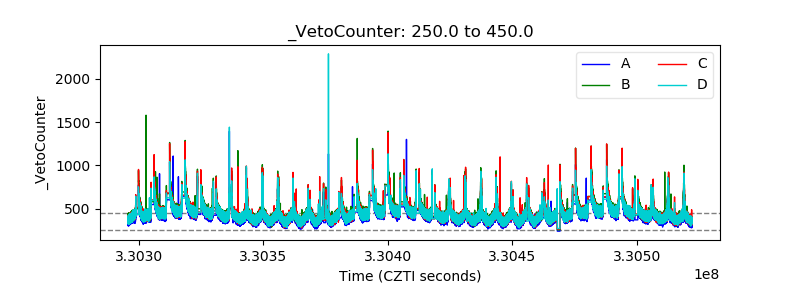 |