| Param | Original file | Final file |
|---|---|---|
| Filename | modeM0/AS1A09_043T02_9000003726_25558cztM0_level2.evt | modeM0/AS1A09_043T02_9000003726_25558cztM0_level2_quad_clean.evt |
| Size (bytes) | 314,824,320 | 56,183,040 |
| Size | 300.2 MB | 53.6 MB |
| Events in quadrant A | 2,259,050 | 358,733 |
| Events in quadrant B | 2,196,488 | 366,324 |
| Events in quadrant C | 2,149,554 | 341,544 |
| Events in quadrant D | 2,636,938 | 332,383 |
| Mode M0 | |||
|---|---|---|---|
| Quadrant | BADHDUFLAG | Total packets | Discarded packets |
| A | 0 | 9525 | 0 |
| B | 0 | 9077 | 0 |
| C | 0 | 8929 | 0 |
| D | 0 | 10768 | 0 |
| Mode M9 | |||
|---|---|---|---|
| Quadrant | BADHDUFLAG | Total packets | Discarded packets |
| A | 0 | 11 | 0 |
| B | 0 | 11 | 0 |
| C | 0 | 11 | 0 |
| D | 0 | 11 | 0 |
| Quadrant | Total seconds | Saturated seconds | Saturation percentage |
|---|---|---|---|
| A | 4290 | 14 | 0.326340% |
| B | 4290 | 16 | 0.372960% |
| C | 4290 | 40 | 0.932401% |
| D | 4289 | 45 | 1.049196% |
Noise dominated data is calculated using 1-second bins in cleaned event files. If a bin has >2000 counts, and if more than 50% of those come from <1% of pixels, then it is considered to be noise-dominated and hence unusable.
| Quadrant | # 1 sec bins | Bins with >0 counts | Bins with >2000 counts | High rate bins dominated by noise | Noise dominated (total time) | Noise dominated (detector-on time) | Marked lightcurve |
|---|---|---|---|---|---|---|---|
| A | 5390 | 4291 | 0 | 0 | 0.00% | 0.00% | 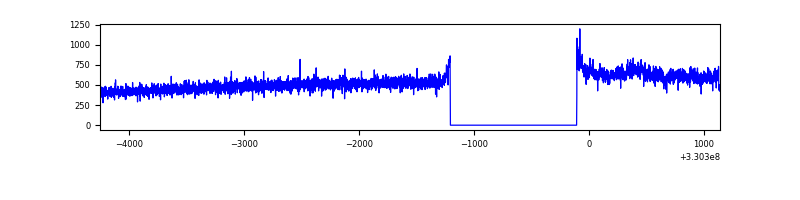 |
| B | 5390 | 4291 | 0 | 0 | 0.00% | 0.00% | 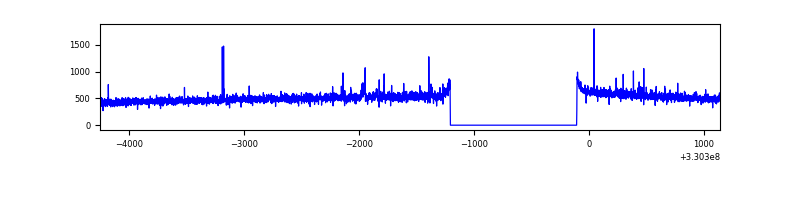 |
| C | 5390 | 4291 | 0 | 0 | 0.00% | 0.00% | 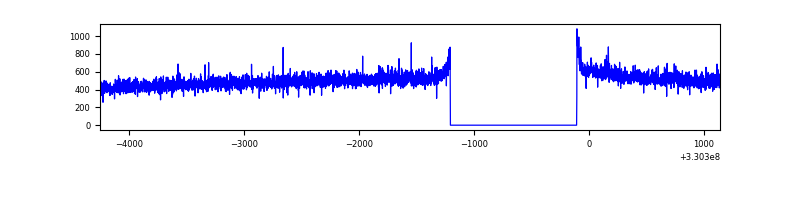 |
| D | 5389 | 4290 | 32 | 32 | 0.59% | 0.75% | 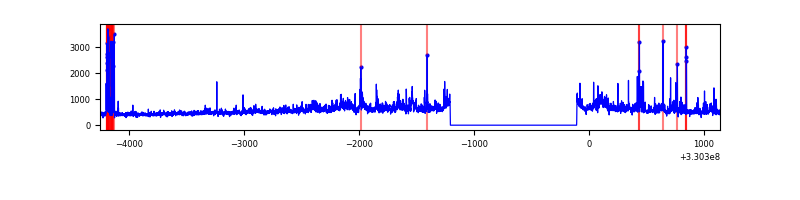 |
Top three noisy pixels from each quadrant. If the there are fewer than three noisy pixels in the level2.evt file, extra rows are filled as -1
| Pixel properties | Quadrant properties | ||||||
|---|---|---|---|---|---|---|---|
| Quadrant | DetID | PixID | Counts | Sigma | Mean | Median | Sigma |
| A | 10 | 17 | 125131 | 1102.05 | 553 | 544 | 113.1 |
| A | 13 | 254 | 6734 | 54.75 | 553 | 544 | 113.1 |
| A | 3 | 137 | 5160 | 40.83 | 553 | 544 | 113.1 |
| B | 0 | 190 | 14211 | 129.71 | 549 | 536 | 105.4 |
| B | 3 | 112 | 13454 | 122.53 | 549 | 536 | 105.4 |
| B | 12 | 111 | 12852 | 116.82 | 549 | 536 | 105.4 |
| C | 14 | 238 | 84357 | 676.46 | 526 | 530 | 123.9 |
| C | 3 | 233 | 13275 | 102.85 | 526 | 530 | 123.9 |
| C | 13 | 61 | 3569 | 24.52 | 526 | 530 | 123.9 |
| D | 8 | 195 | 295556 | 2267.55 | 529 | 513 | 130.1 |
| D | 1 | 52 | 291522 | 2236.55 | 529 | 513 | 130.1 |
| D | 2 | 244 | 40879 | 310.23 | 529 | 513 | 130.1 |
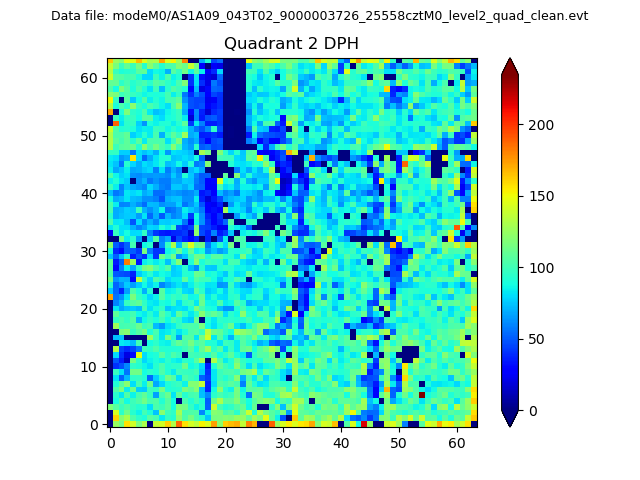
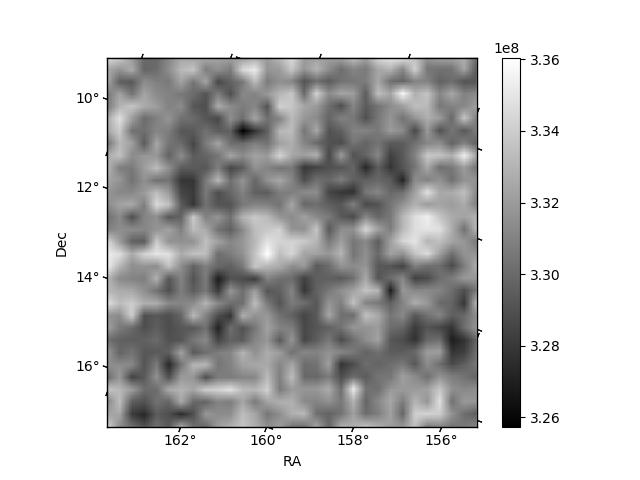
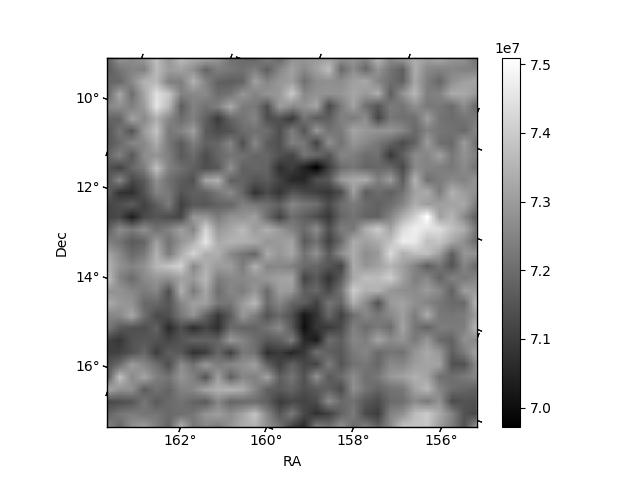
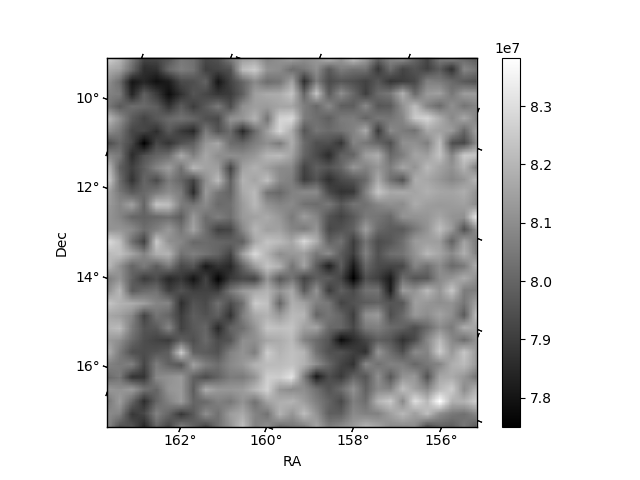
Histogram calculated using DETX and DETY for each event in the final _common_clean file
| Quadrant A | 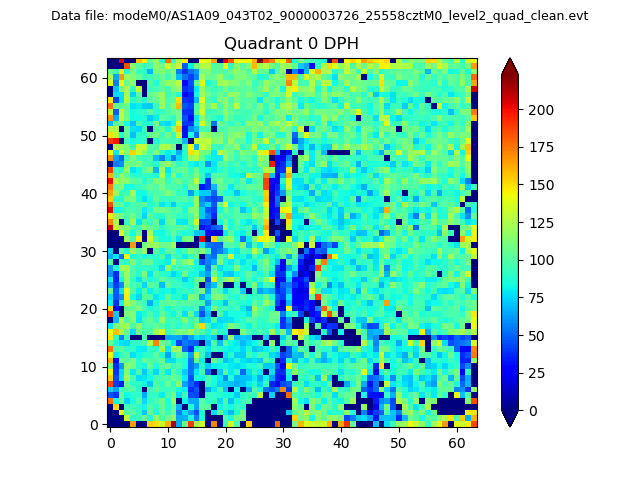 |
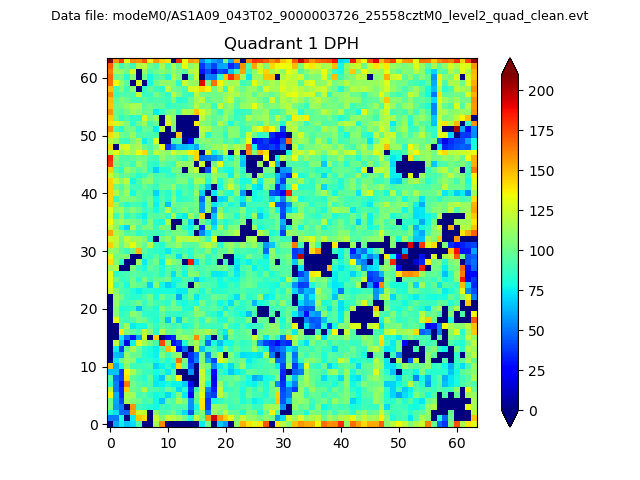 |
Quadrant B |
|---|---|---|---|
| Quadrant D | 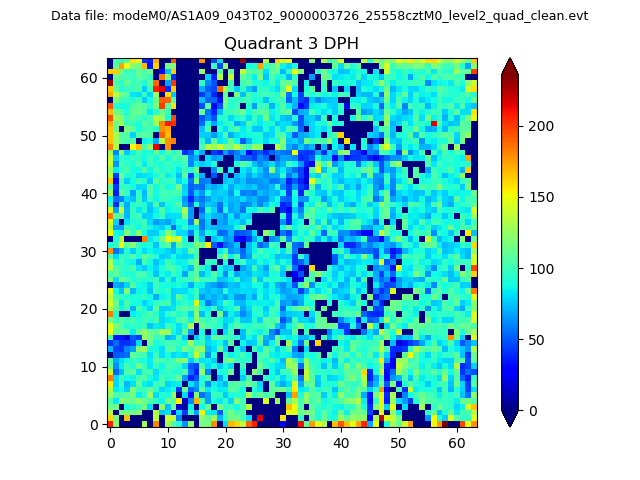 |
 |
Quadrant C |
| Plot type | Count rate plots | Images |
|---|---|---|
| Comparison with Poisson distribution Blue bars denote a histogram of data divided into 1 sec bins. Red curve is a Poisson curve with rate = median count rate of data. |
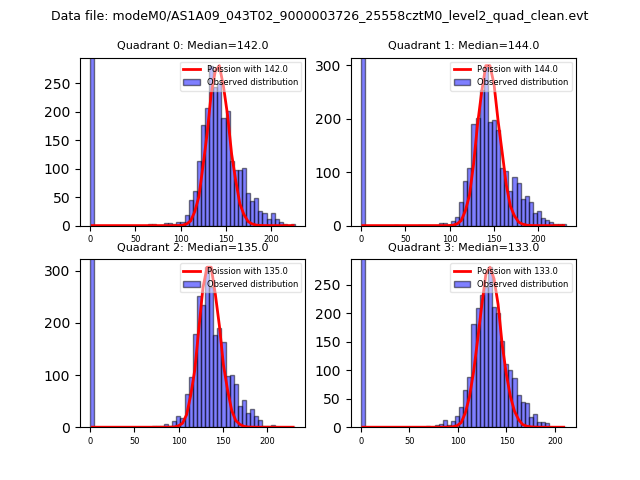 |
 |
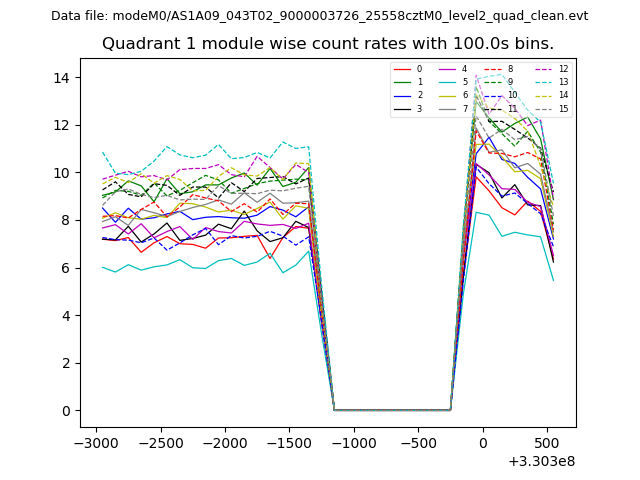
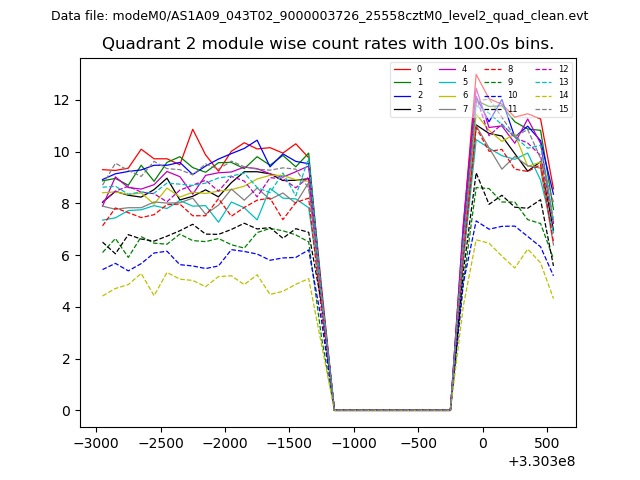
| Quadrant-wise count rates Data is divided into 100 sec bins |
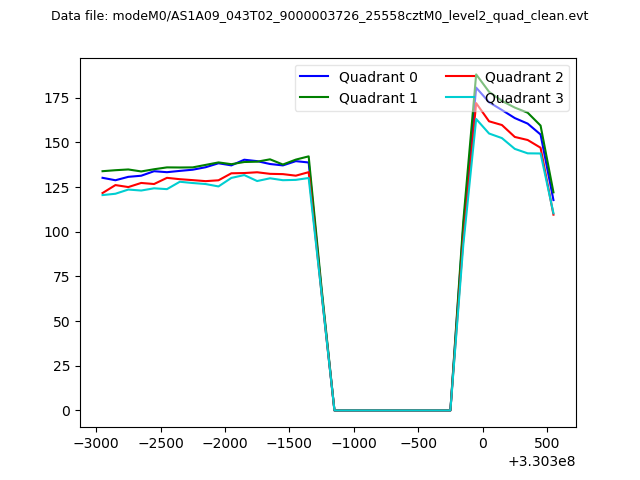 |
|
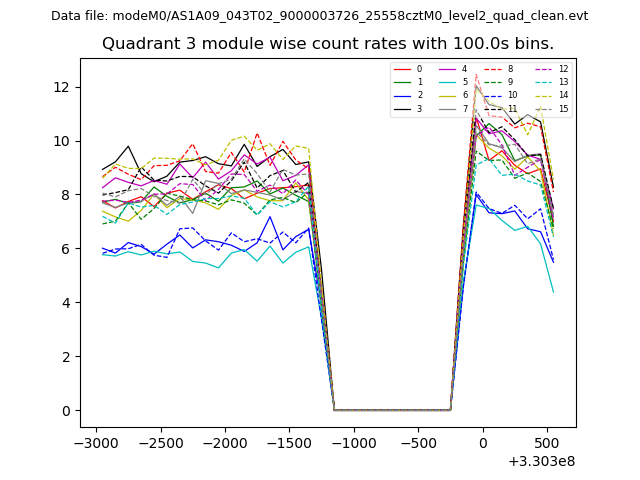
| Module-wise count rates for Quadrant A Data is divided into 100 sec bins |
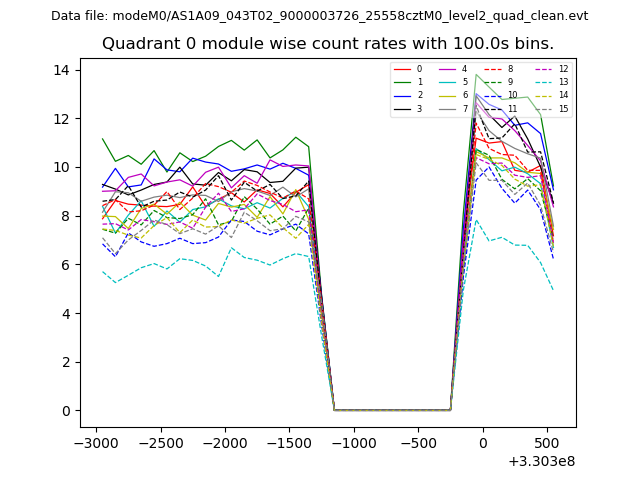 |
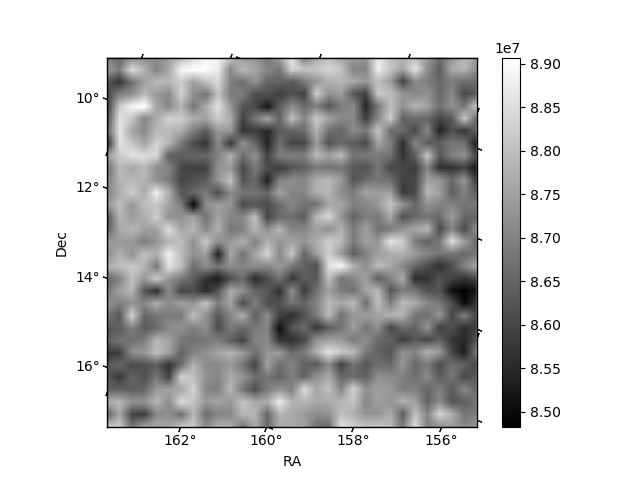 |
| Module-wise count rates for Quadrant B Data is divided into 100 sec bins |
 |
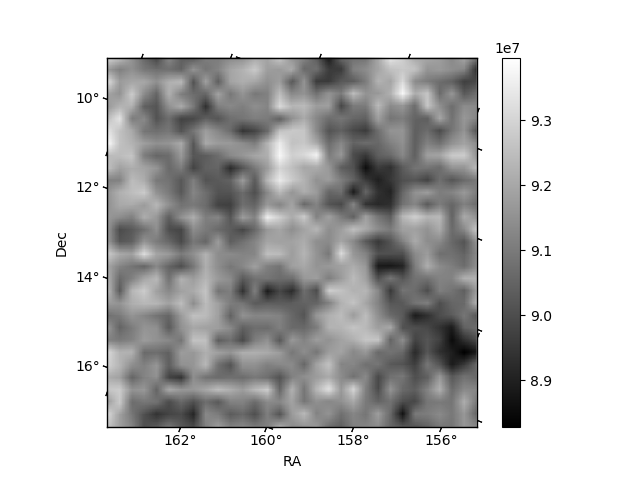 |
| Module-wise count rates for Quadrant C Data is divided into 100 sec bins |
 |
 |
| Module-wise count rates for Quadrant D Data is divided into 100 sec bins |
 |
 |
| Parameter | Plot |
|---|---|
| CZT HV Monitor | 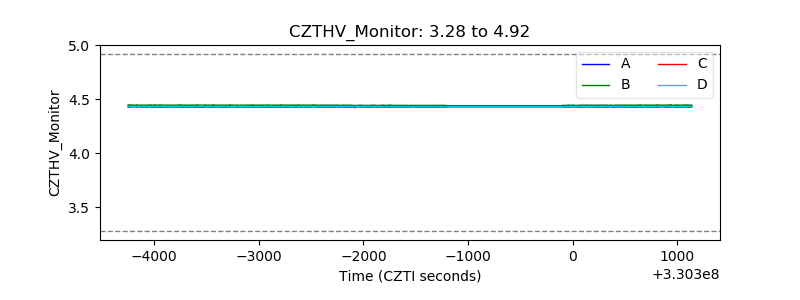 |
| D_VDD | 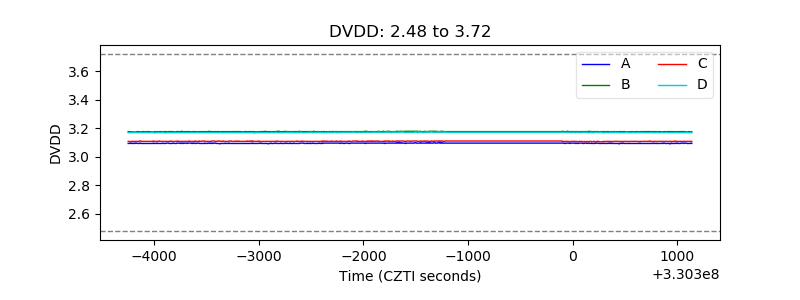 |
| Temperature 1 | 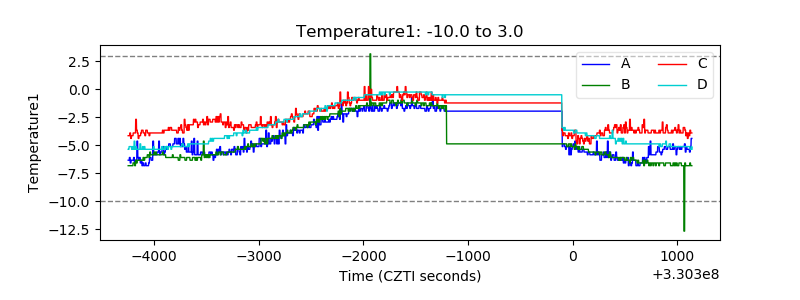 |
| Veto HV Monitor | 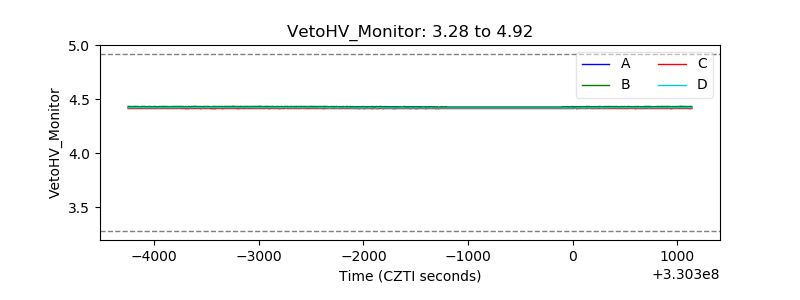 |
| Veto LLD | 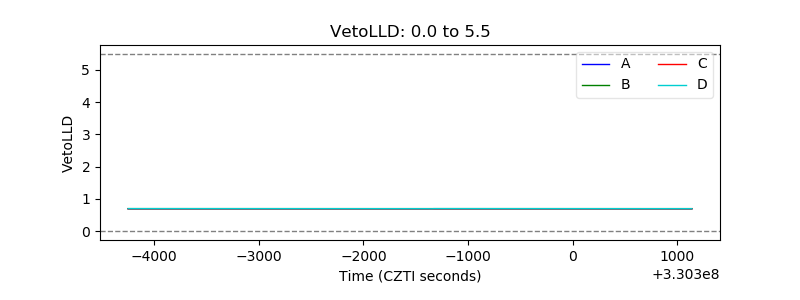 |
| Alpha Counter | 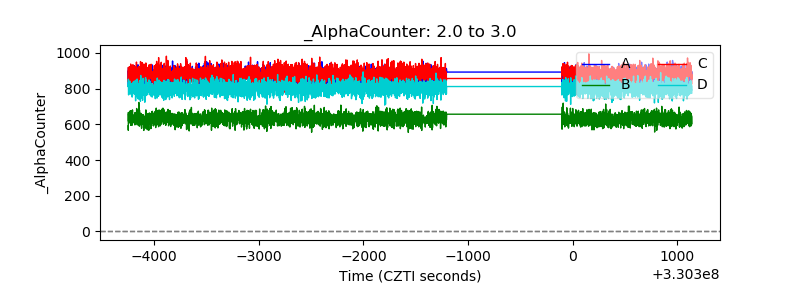 |
| _CPM_Rate | 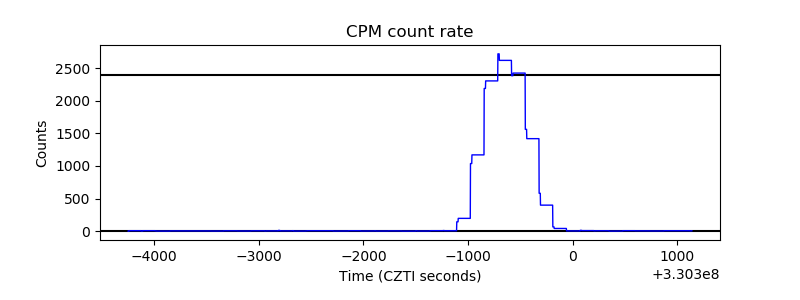 |
| CZT Counter | 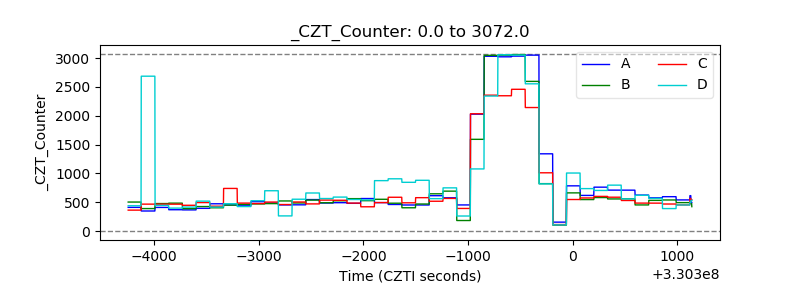 |
| +2.5 Volts monitor | 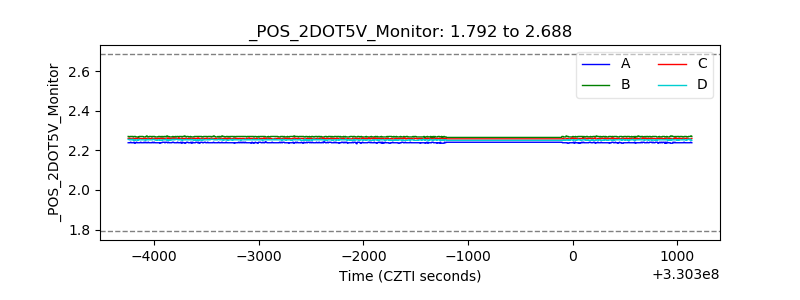 |
| +5 Volts monitor | 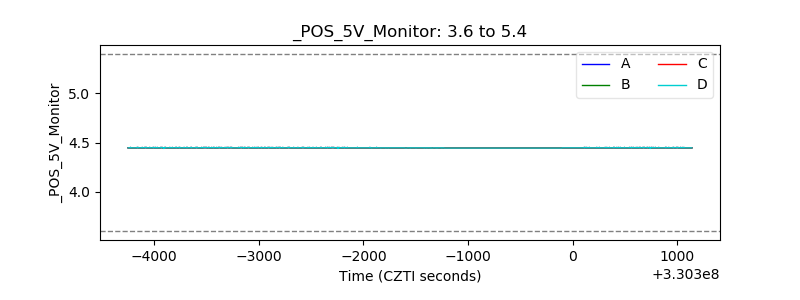 |
| _ROLL_ROT | 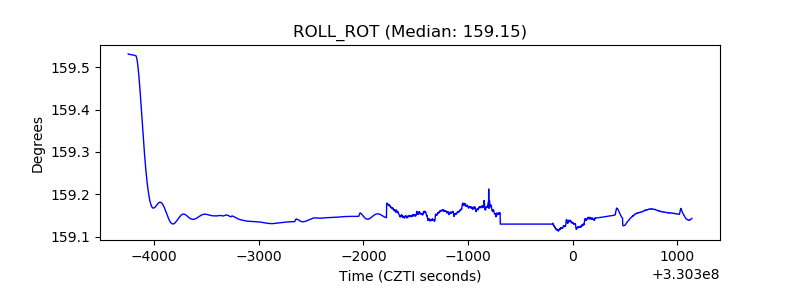 |
| _Roll_DEC | 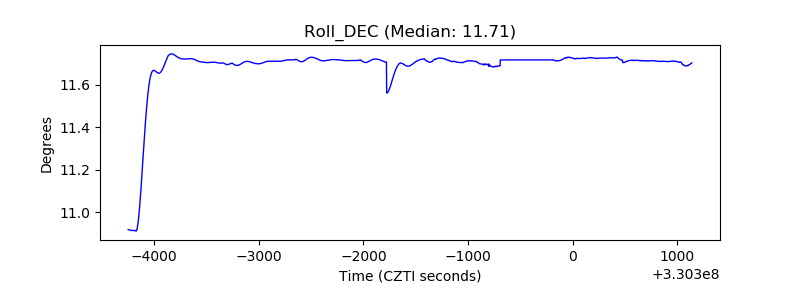 |
| _Roll_RA | 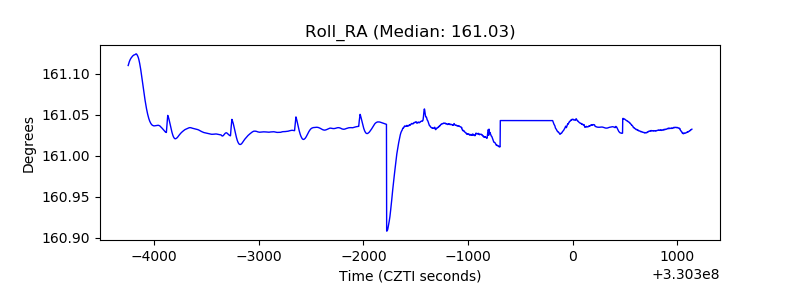 |
| Veto Counter | 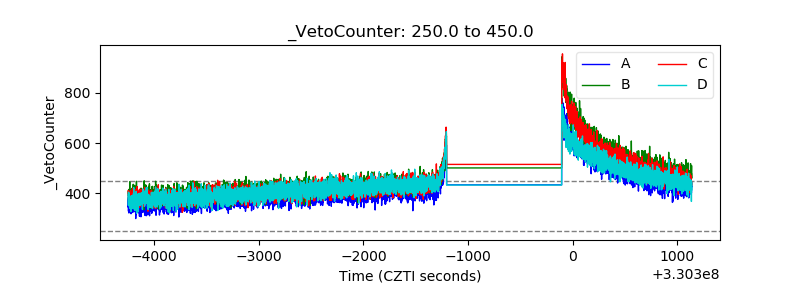 |