| Param | Original file | Final file |
|---|---|---|
| Filename | modeM0/AS1A09_043T02_9000003726_25560cztM0_level2.evt | modeM0/AS1A09_043T02_9000003726_25560cztM0_level2_quad_clean.evt |
| Size (bytes) | 489,386,880 | 75,412,800 |
| Size | 466.7 MB | 71.9 MB |
| Events in quadrant A | 3,407,477 | 472,566 |
| Events in quadrant B | 3,392,751 | 484,435 |
| Events in quadrant C | 3,364,173 | 446,989 |
| Events in quadrant D | 4,224,024 | 434,645 |
| Mode M0 | |||
|---|---|---|---|
| Quadrant | BADHDUFLAG | Total packets | Discarded packets |
| A | 0 | 14171 | 0 |
| B | 0 | 13875 | 0 |
| C | 0 | 13800 | 0 |
| D | 0 | 16825 | 0 |
| Mode M9 | |||
|---|---|---|---|
| Quadrant | BADHDUFLAG | Total packets | Discarded packets |
| A | 0 | 14 | 0 |
| B | 0 | 15 | 0 |
| C | 0 | 15 | 0 |
| D | 0 | 15 | 0 |
| Quadrant | Total seconds | Saturated seconds | Saturation percentage |
|---|---|---|---|
| A | 6381 | 46 | 0.720890% |
| B | 6381 | 44 | 0.689547% |
| C | 6381 | 68 | 1.065664% |
| D | 6381 | 124 | 1.943269% |
Noise dominated data is calculated using 1-second bins in cleaned event files. If a bin has >2000 counts, and if more than 50% of those come from <1% of pixels, then it is considered to be noise-dominated and hence unusable.
| Quadrant | # 1 sec bins | Bins with >0 counts | Bins with >2000 counts | High rate bins dominated by noise | Noise dominated (total time) | Noise dominated (detector-on time) | Marked lightcurve |
|---|---|---|---|---|---|---|---|
| A | 7581 | 6382 | 0 | 0 | 0.00% | 0.00% | 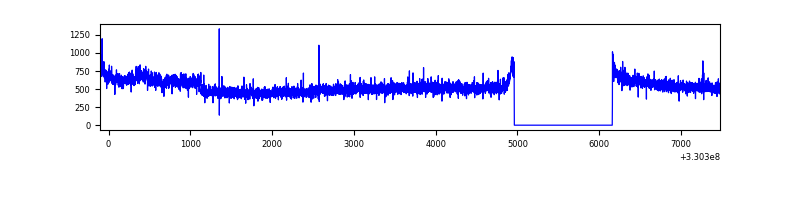 |
| B | 7581 | 6382 | 0 | 0 | 0.00% | 0.00% | 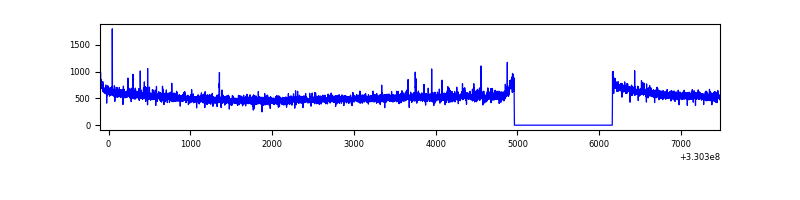 |
| C | 7581 | 6382 | 1 | 1 | 0.01% | 0.02% | 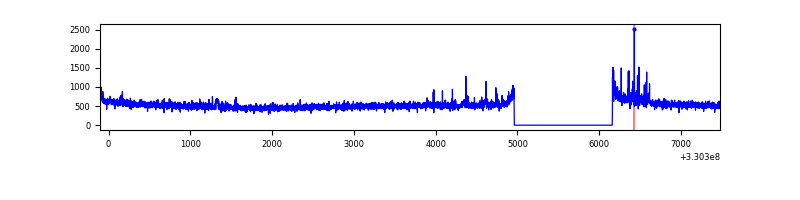 |
| D | 7581 | 6382 | 83 | 83 | 1.09% | 1.30% | 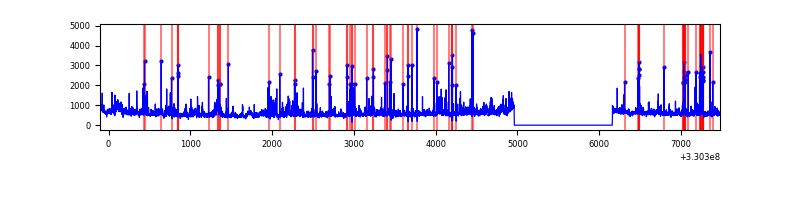 |
Top three noisy pixels from each quadrant. If the there are fewer than three noisy pixels in the level2.evt file, extra rows are filled as -1
| Pixel properties | Quadrant properties | ||||||
|---|---|---|---|---|---|---|---|
| Quadrant | DetID | PixID | Counts | Sigma | Mean | Median | Sigma |
| A | 10 | 17 | 125481 | 728.64 | 851 | 835 | 171.1 |
| A | 13 | 254 | 10228 | 54.91 | 851 | 835 | 171.1 |
| A | 3 | 137 | 7414 | 38.46 | 851 | 835 | 171.1 |
| B | 0 | 219 | 20160 | 121.36 | 851 | 830 | 159.3 |
| B | 12 | 111 | 19083 | 114.6 | 851 | 830 | 159.3 |
| B | 3 | 112 | 18488 | 110.87 | 851 | 830 | 159.3 |
| C | 14 | 238 | 131277 | 693.85 | 804 | 811 | 188.0 |
| C | 3 | 233 | 66436 | 349.01 | 804 | 811 | 188.0 |
| C | 5 | 112 | 33185 | 172.17 | 804 | 811 | 188.0 |
| D | 1 | 52 | 588408 | 3028.02 | 802 | 778 | 194.1 |
| D | 8 | 195 | 375655 | 1931.72 | 802 | 778 | 194.1 |
| D | 2 | 244 | 144248 | 739.29 | 802 | 778 | 194.1 |
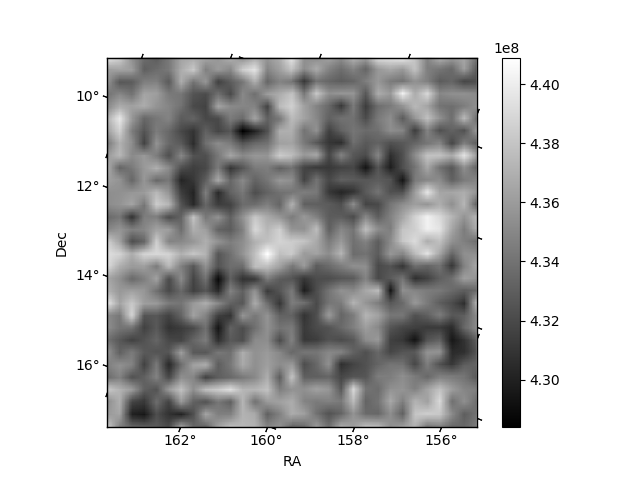
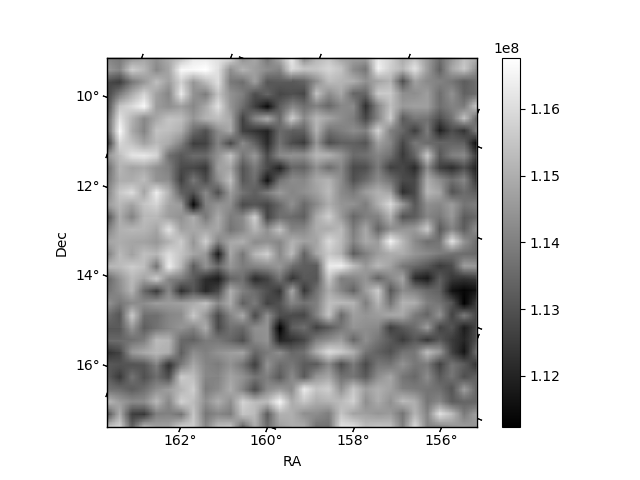
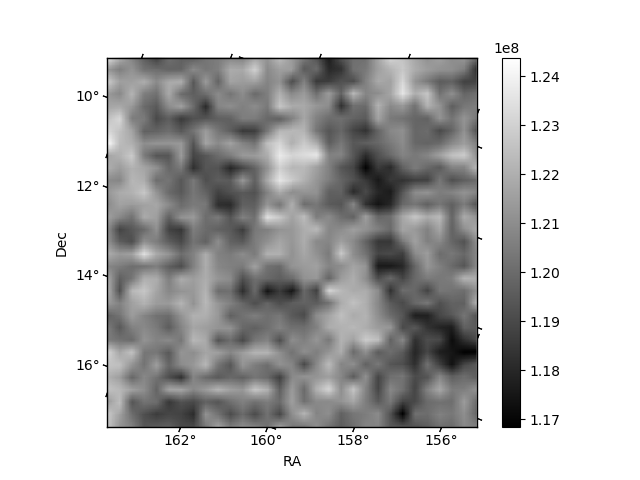
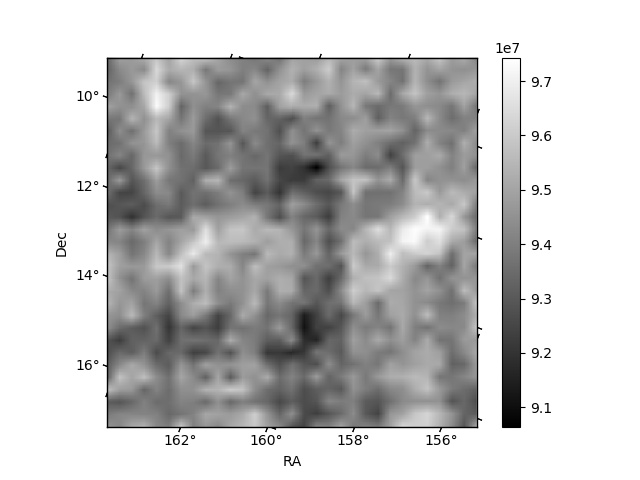
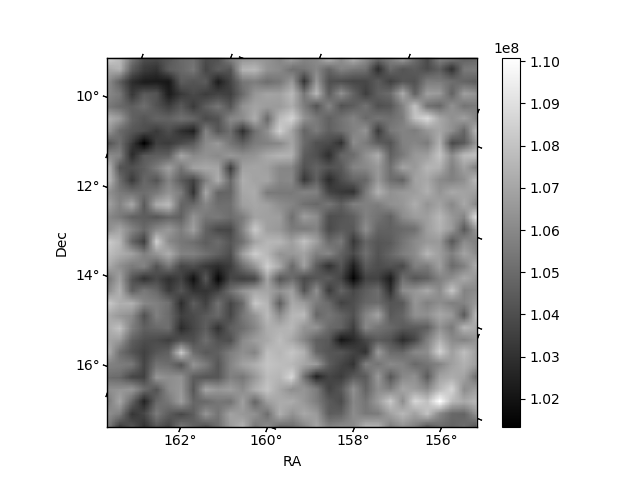
Histogram calculated using DETX and DETY for each event in the final _common_clean file
| Quadrant A | 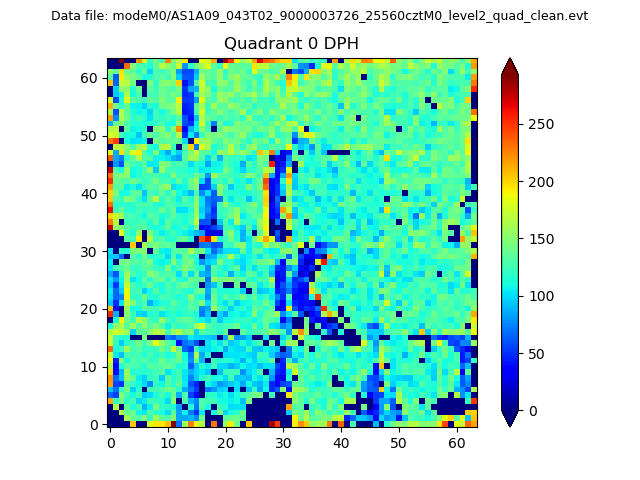 |
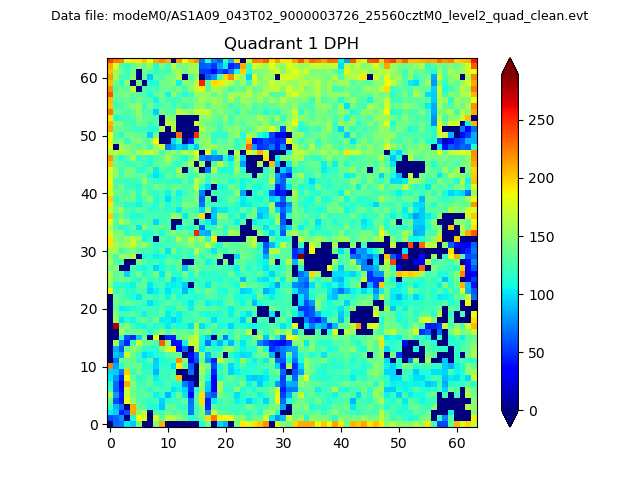 |
Quadrant B |
|---|---|---|---|
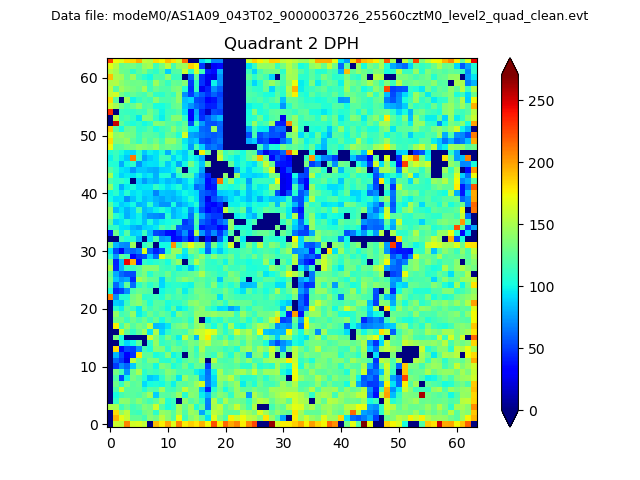
| Quadrant D | 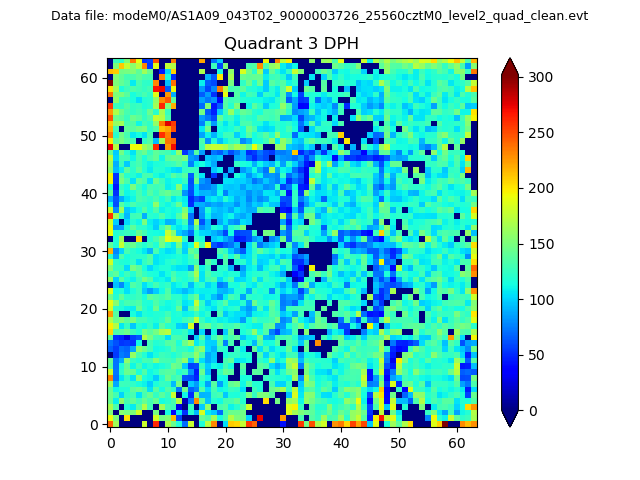 |
 |
Quadrant C |
| Plot type | Count rate plots | Images |
|---|---|---|
| Comparison with Poisson distribution Blue bars denote a histogram of data divided into 1 sec bins. Red curve is a Poisson curve with rate = median count rate of data. |
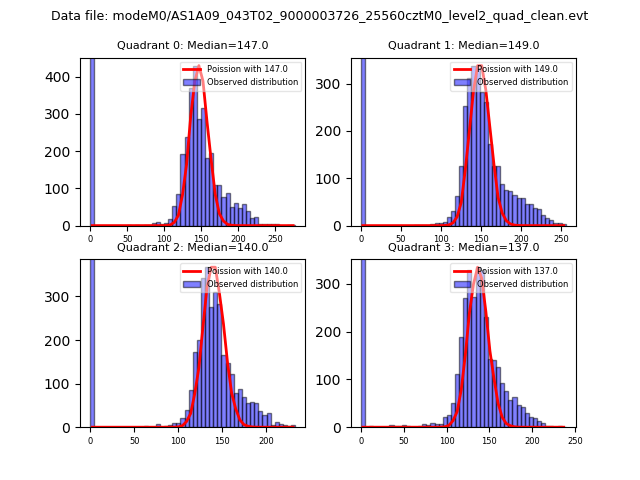 |
 |
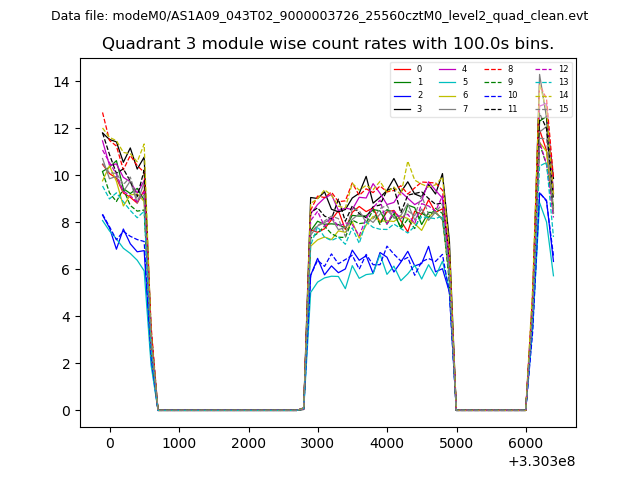
| Quadrant-wise count rates Data is divided into 100 sec bins |
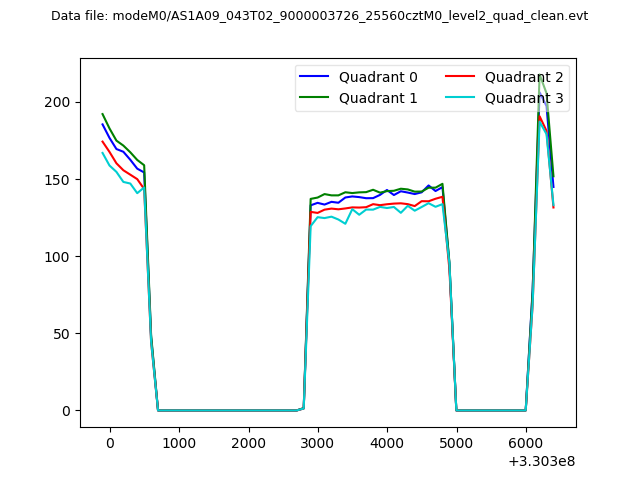 |
|
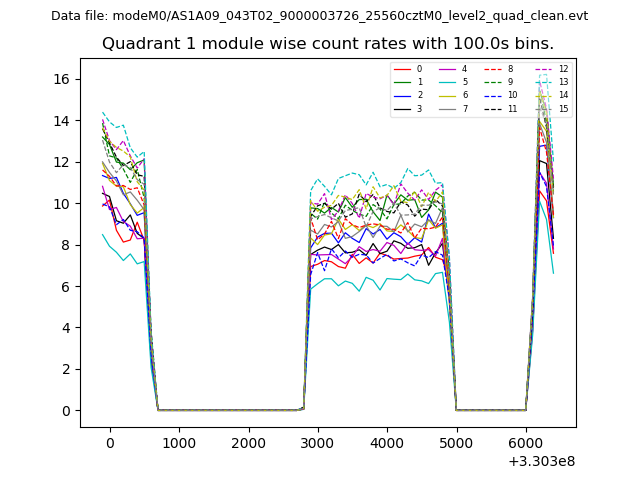
| Module-wise count rates for Quadrant A Data is divided into 100 sec bins |
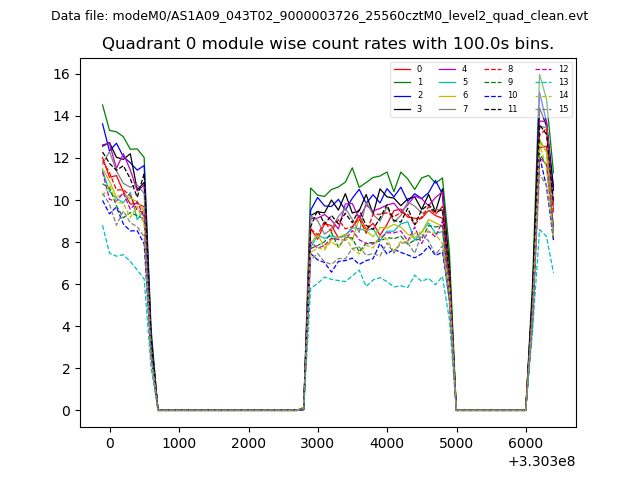 |
 |
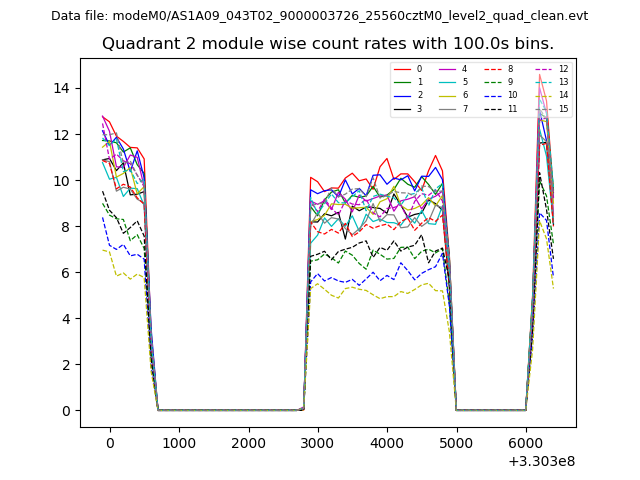
| Module-wise count rates for Quadrant B Data is divided into 100 sec bins |
 |
 |
| Module-wise count rates for Quadrant C Data is divided into 100 sec bins |
 |
 |
| Module-wise count rates for Quadrant D Data is divided into 100 sec bins |
 |
 |
| Parameter | Plot |
|---|---|
| CZT HV Monitor | 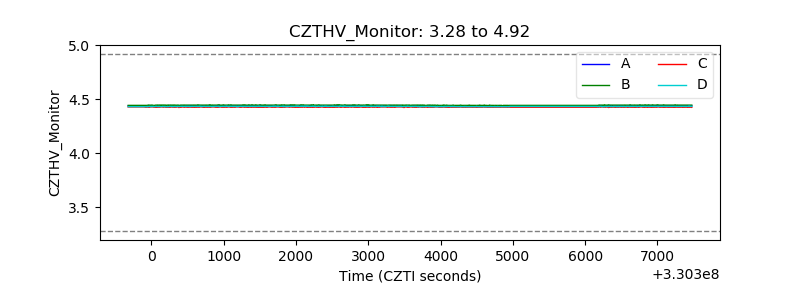 |
| D_VDD | 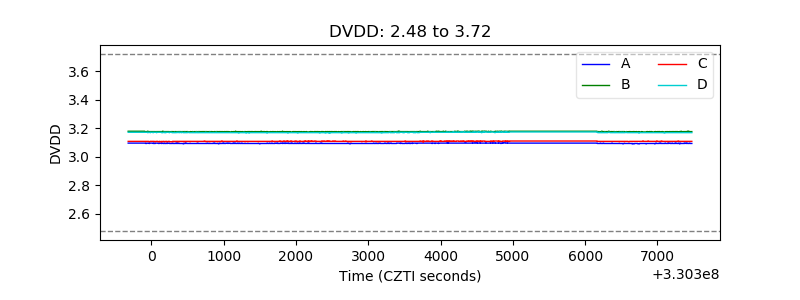 |
| Temperature 1 | 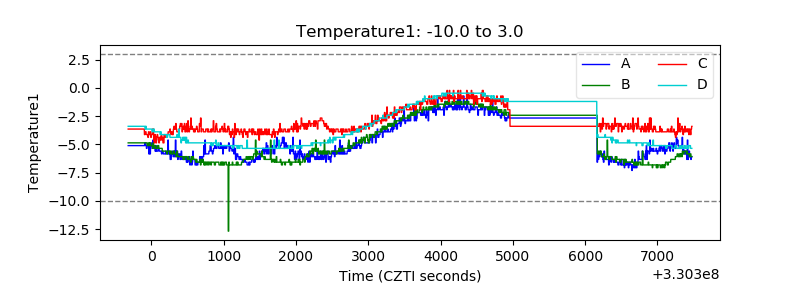 |
| Veto HV Monitor | 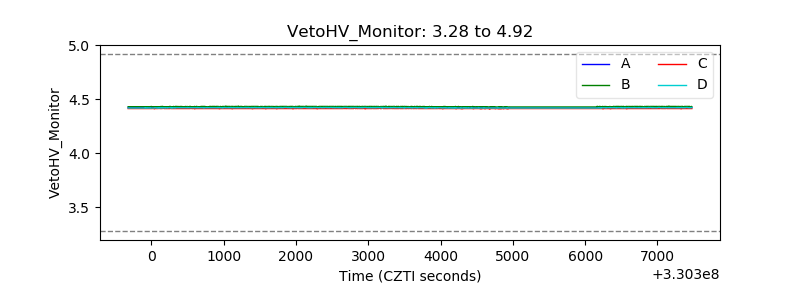 |
| Veto LLD | 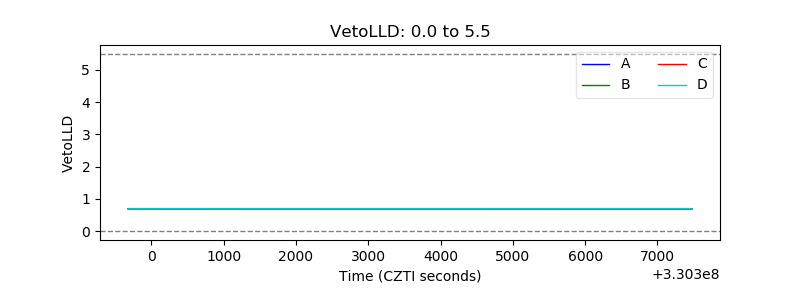 |
| Alpha Counter | 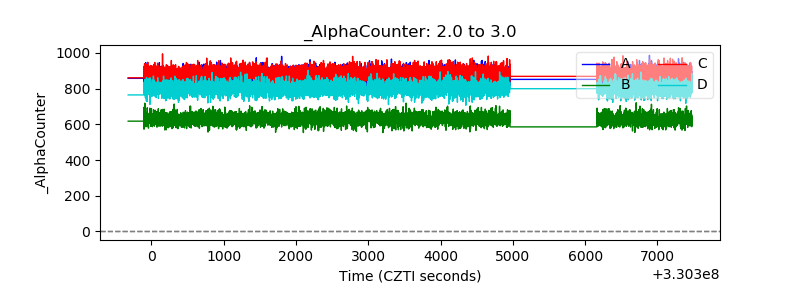 |
| _CPM_Rate | 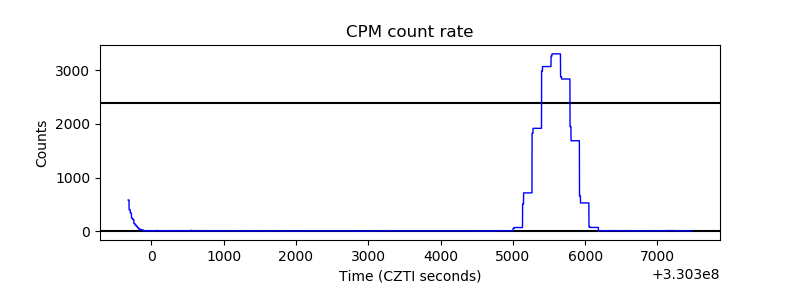 |
| CZT Counter | 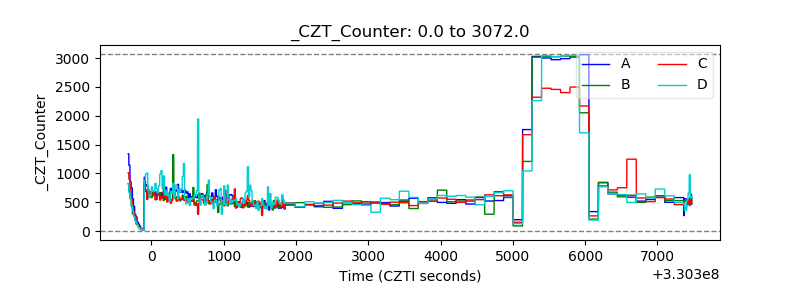 |
| +2.5 Volts monitor |  |
| +5 Volts monitor |  |
| _ROLL_ROT | 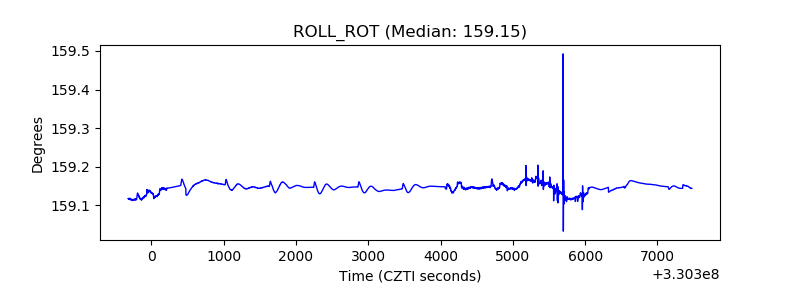 |
| _Roll_DEC | 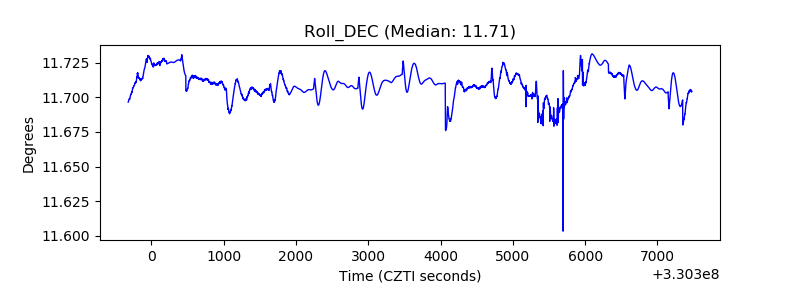 |
| _Roll_RA | 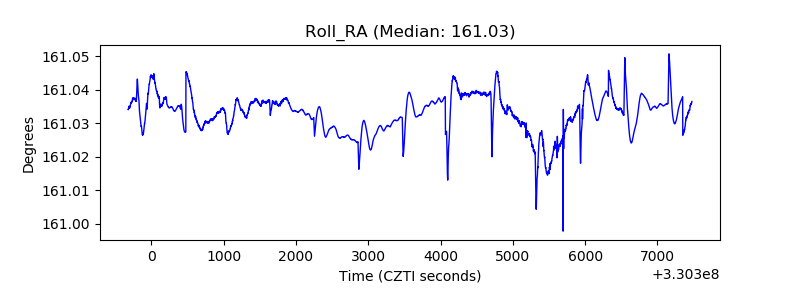 |
| Veto Counter | 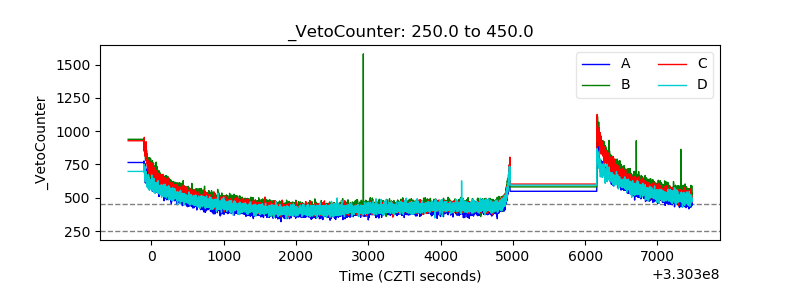 |