| Param | Original file | Final file |
|---|---|---|
| Filename | modeM0/AS1A09_043T02_9000003726_25561cztM0_level2.evt | modeM0/AS1A09_043T02_9000003726_25561cztM0_level2_quad_clean.evt |
| Size (bytes) | 521,081,280 | 67,426,560 |
| Size | 496.9 MB | 64.3 MB |
| Events in quadrant A | 3,573,016 | 408,936 |
| Events in quadrant B | 3,664,924 | 417,627 |
| Events in quadrant C | 3,570,707 | 384,583 |
| Events in quadrant D | 4,528,756 | 373,803 |
| Mode M0 | |||
|---|---|---|---|
| Quadrant | BADHDUFLAG | Total packets | Discarded packets |
| A | 0 | 14426 | 0 |
| B | 0 | 14734 | 0 |
| C | 0 | 14422 | 0 |
| D | 0 | 17883 | 0 |
| Mode M9 | |||
|---|---|---|---|
| Quadrant | BADHDUFLAG | Total packets | Discarded packets |
| A | 0 | 18 | 0 |
| B | 0 | 19 | 0 |
| C | 0 | 19 | 0 |
| D | 0 | 19 | 0 |
| Quadrant | Total seconds | Saturated seconds | Saturation percentage |
|---|---|---|---|
| A | 6542 | 32 | 0.489147% |
| B | 6542 | 53 | 0.810150% |
| C | 6542 | 60 | 0.917151% |
| D | 6542 | 142 | 2.170590% |
Noise dominated data is calculated using 1-second bins in cleaned event files. If a bin has >2000 counts, and if more than 50% of those come from <1% of pixels, then it is considered to be noise-dominated and hence unusable.
| Quadrant | # 1 sec bins | Bins with >0 counts | Bins with >2000 counts | High rate bins dominated by noise | Noise dominated (total time) | Noise dominated (detector-on time) | Marked lightcurve |
|---|---|---|---|---|---|---|---|
| A | 7832 | 6543 | 0 | 0 | 0.00% | 0.00% |  |
| B | 7832 | 6543 | 0 | 0 | 0.00% | 0.00% | 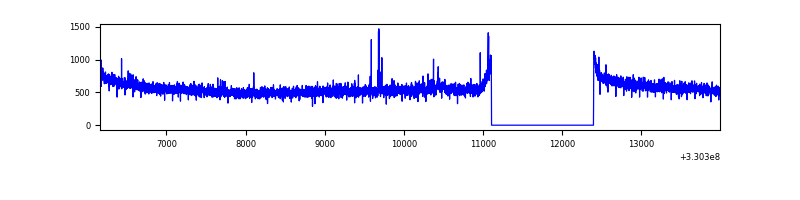 |
| C | 7832 | 6543 | 1 | 1 | 0.01% | 0.02% | 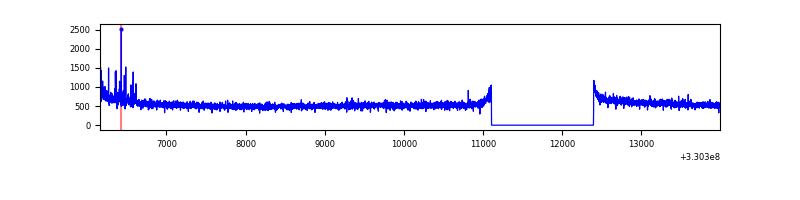 |
| D | 7832 | 6543 | 108 | 108 | 1.38% | 1.65% | 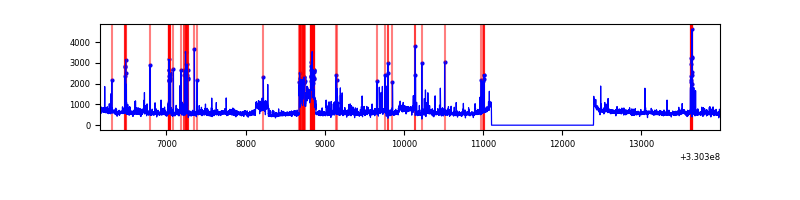 |
Top three noisy pixels from each quadrant. If the there are fewer than three noisy pixels in the level2.evt file, extra rows are filled as -1
| Pixel properties | Quadrant properties | ||||||
|---|---|---|---|---|---|---|---|
| Quadrant | DetID | PixID | Counts | Sigma | Mean | Median | Sigma |
| A | 13 | 254 | 10161 | 50.38 | 924 | 909 | 183.6 |
| A | 0 | 226 | 8126 | 39.3 | 924 | 909 | 183.6 |
| A | 3 | 137 | 7735 | 37.17 | 924 | 909 | 183.6 |
| B | 12 | 111 | 20301 | 113.17 | 923 | 903 | 171.4 |
| B | 11 | 111 | 17885 | 99.07 | 923 | 903 | 171.4 |
| B | 0 | 219 | 17246 | 95.34 | 923 | 903 | 171.4 |
| C | 14 | 238 | 141769 | 707.78 | 864 | 872 | 199.1 |
| C | 5 | 112 | 33247 | 162.63 | 864 | 872 | 199.1 |
| C | 3 | 233 | 23546 | 113.9 | 864 | 872 | 199.1 |
| D | 1 | 52 | 665797 | 3159.04 | 866 | 842 | 210.5 |
| D | 8 | 195 | 355294 | 1683.91 | 866 | 842 | 210.5 |
| D | 2 | 244 | 133813 | 631.71 | 866 | 842 | 210.5 |
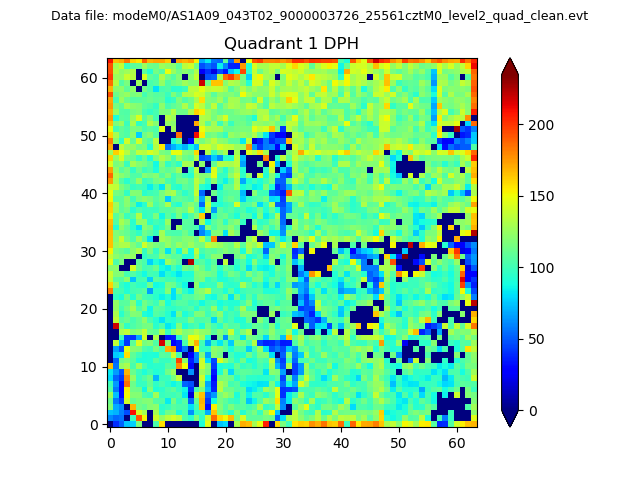
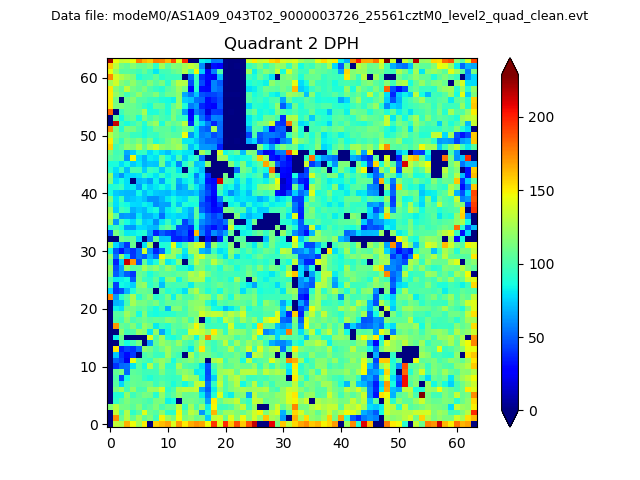
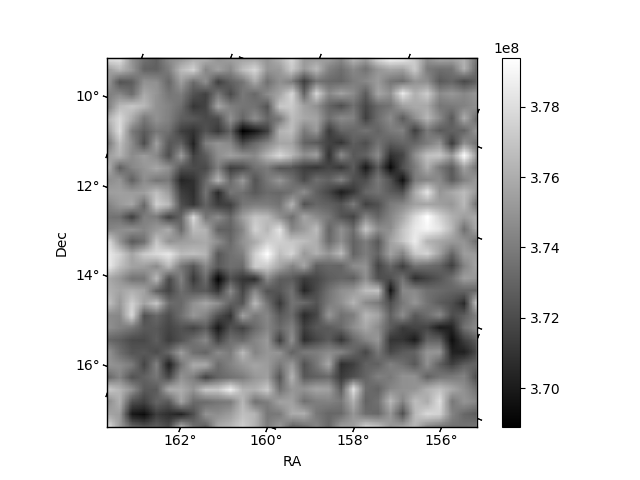
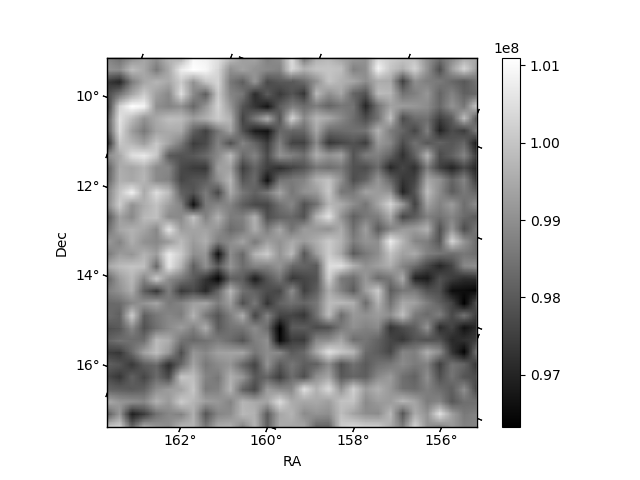
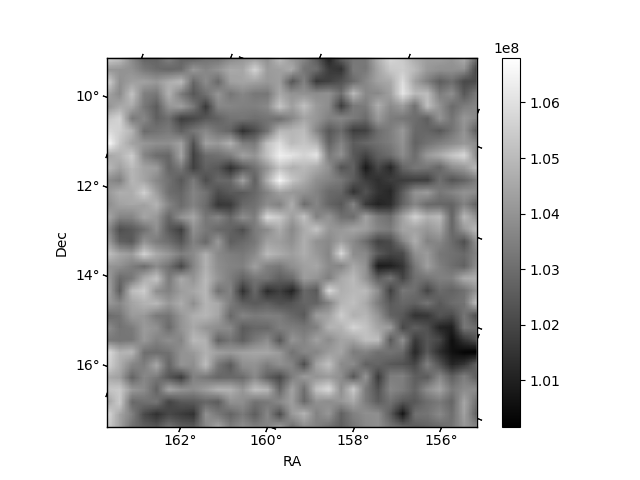
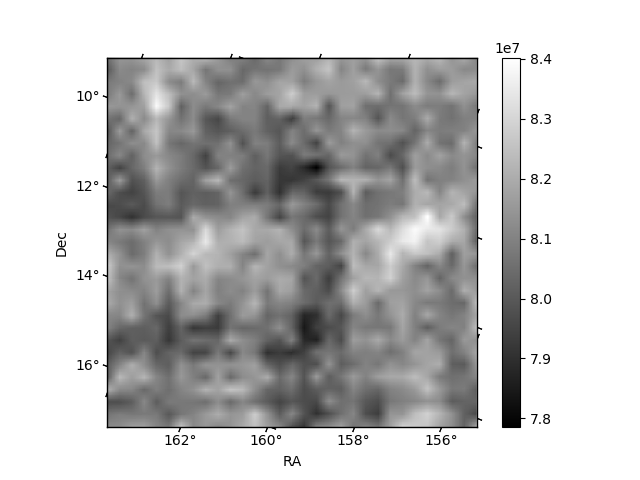
Histogram calculated using DETX and DETY for each event in the final _common_clean file
| Quadrant A | 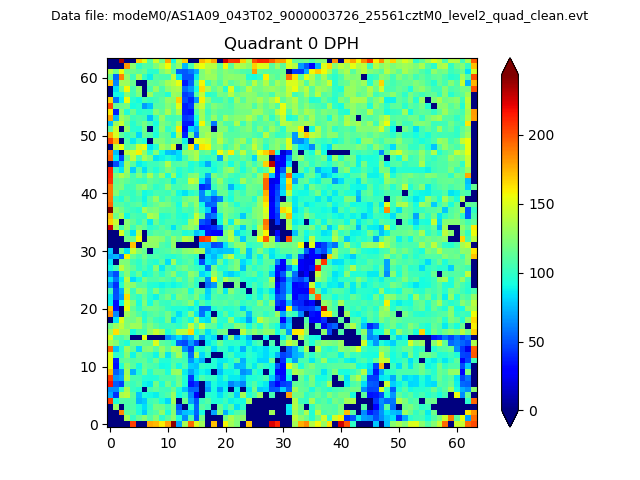 |
 |
Quadrant B |
|---|---|---|---|
| Quadrant D | 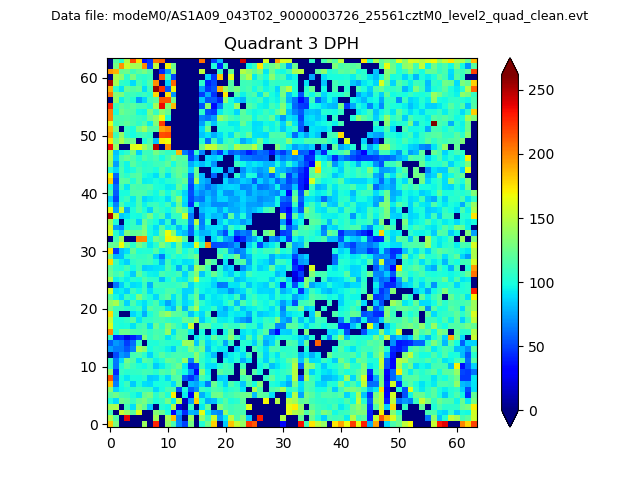 |
 |
Quadrant C |
| Plot type | Count rate plots | Images |
|---|---|---|
| Comparison with Poisson distribution Blue bars denote a histogram of data divided into 1 sec bins. Red curve is a Poisson curve with rate = median count rate of data. |
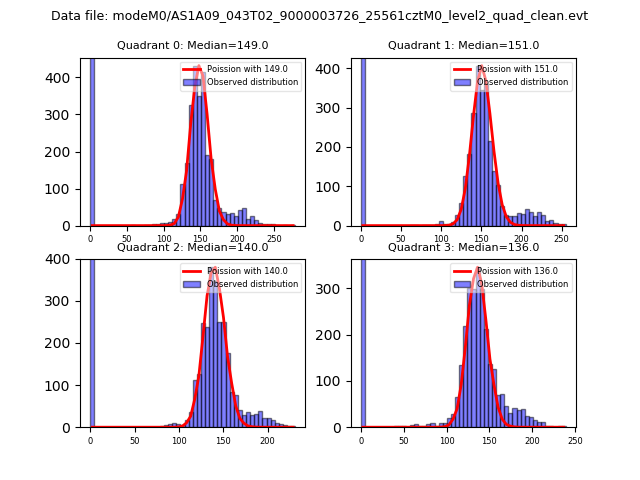 |
 |
| Quadrant-wise count rates Data is divided into 100 sec bins |
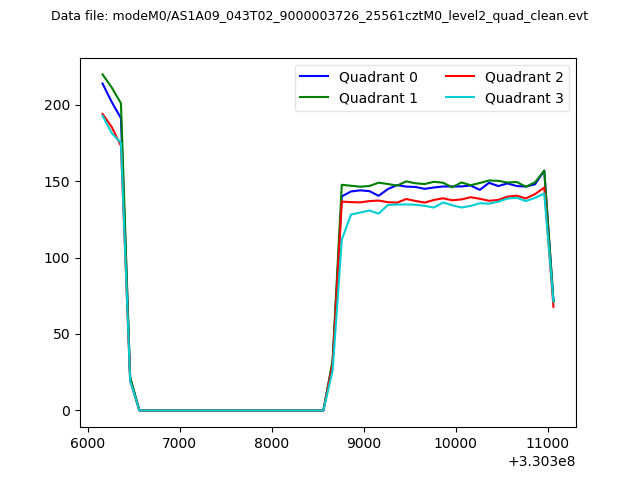 |
|
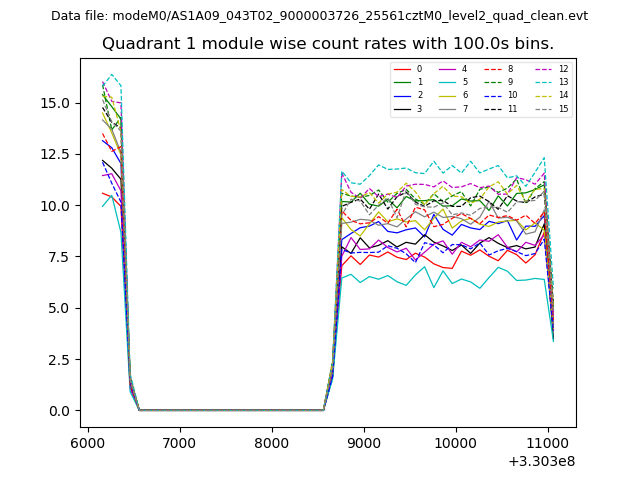
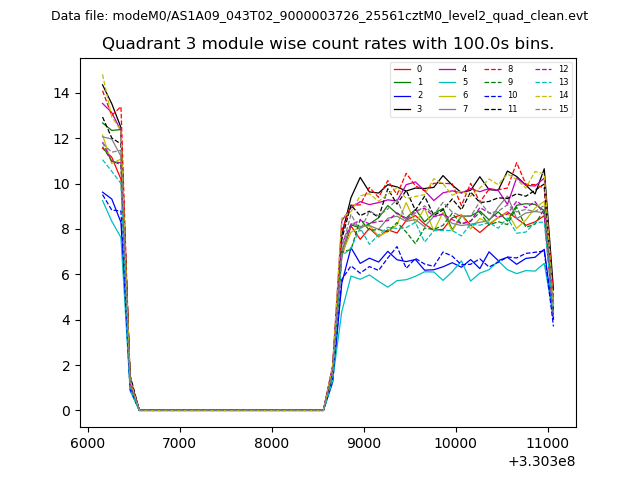
| Module-wise count rates for Quadrant A Data is divided into 100 sec bins |
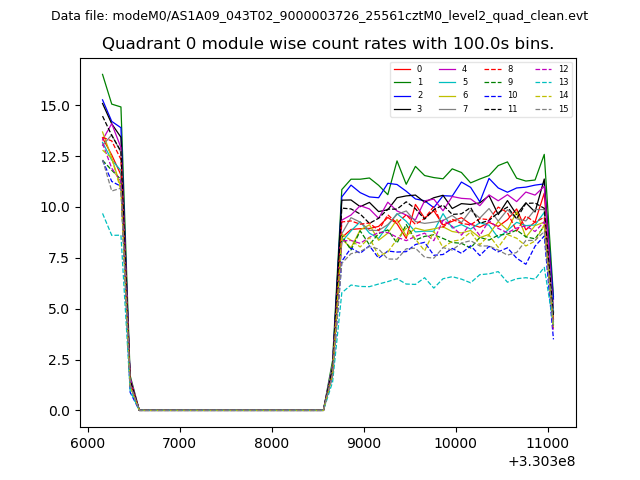 |
 |
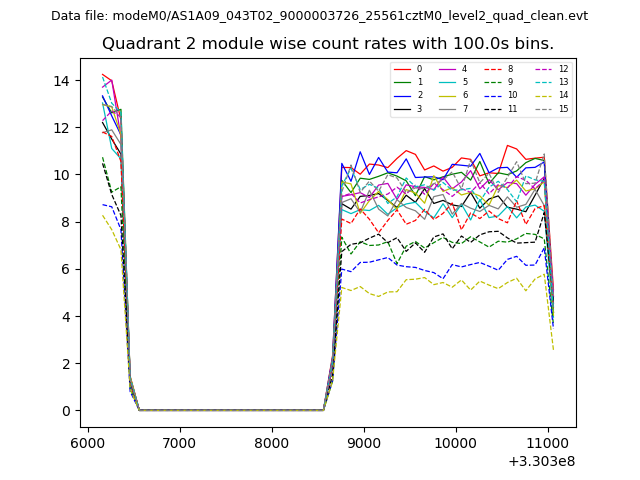
| Module-wise count rates for Quadrant B Data is divided into 100 sec bins |
 |
 |
| Module-wise count rates for Quadrant C Data is divided into 100 sec bins |
 |
 |
| Module-wise count rates for Quadrant D Data is divided into 100 sec bins |
 |
 |
| Parameter | Plot |
|---|---|
| CZT HV Monitor | 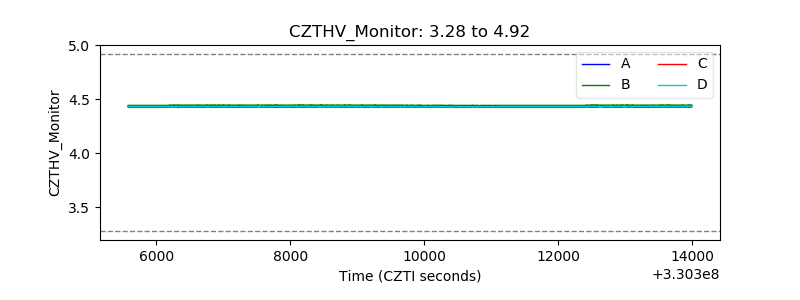 |
| D_VDD | 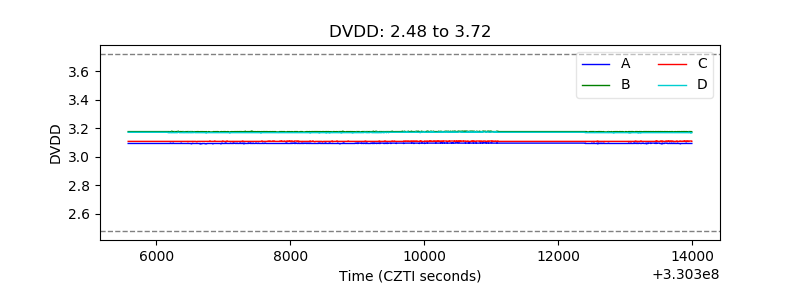 |
| Temperature 1 | 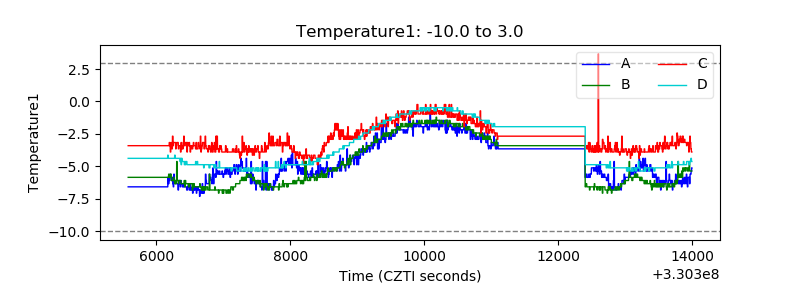 |
| Veto HV Monitor | 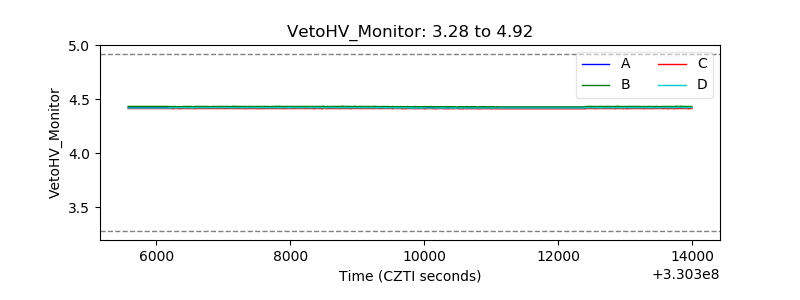 |
| Veto LLD |  |
| Alpha Counter | 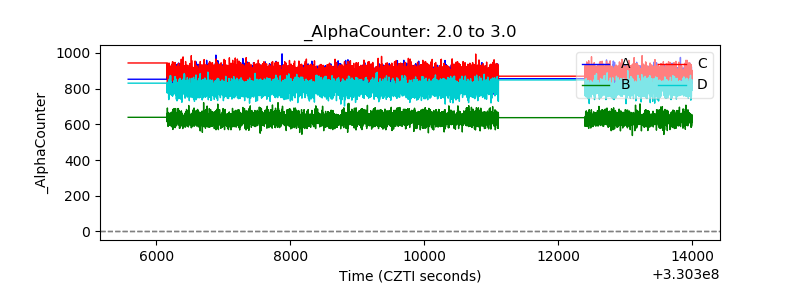 |
| _CPM_Rate | 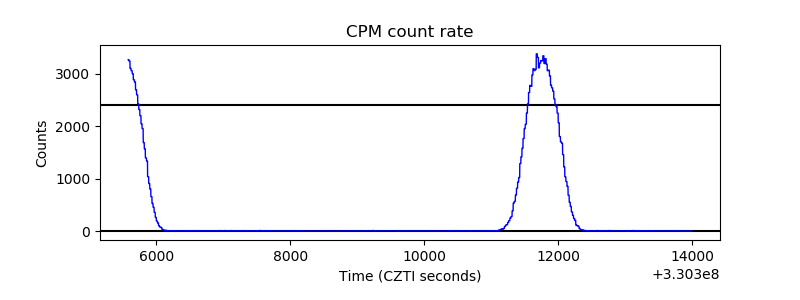 |
| CZT Counter | 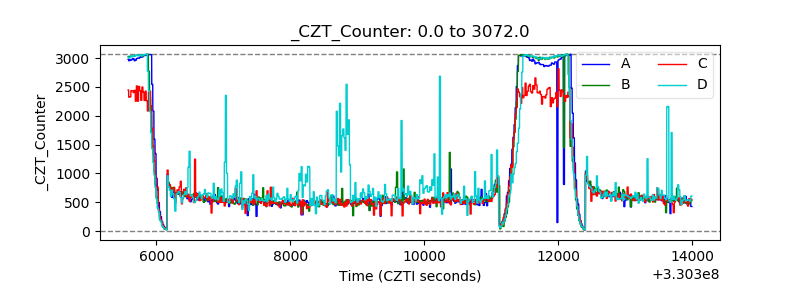 |
| +2.5 Volts monitor |  |
| +5 Volts monitor |  |
| _ROLL_ROT | 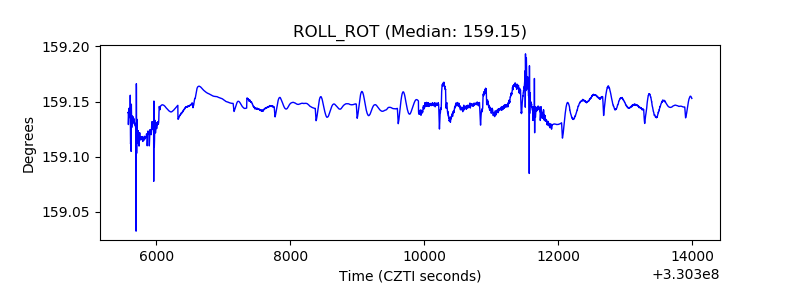 |
| _Roll_DEC | 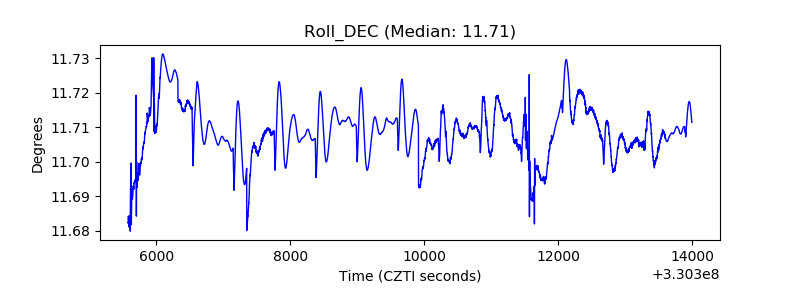 |
| _Roll_RA |  |
| Veto Counter | 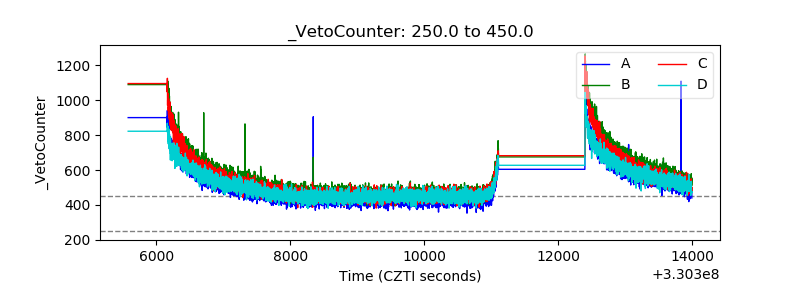 |