| Param | Original file | Final file |
|---|---|---|
| Filename | modeM0/AS1A09_043T02_9000003726_25562cztM0_level2.evt | modeM0/AS1A09_043T02_9000003726_25562cztM0_level2_quad_clean.evt |
| Size (bytes) | 518,938,560 | 66,934,080 |
| Size | 494.9 MB | 63.8 MB |
| Events in quadrant A | 3,548,138 | 412,387 |
| Events in quadrant B | 3,604,021 | 418,234 |
| Events in quadrant C | 3,514,658 | 385,002 |
| Events in quadrant D | 4,622,854 | 371,837 |
| Mode M0 | |||
|---|---|---|---|
| Quadrant | BADHDUFLAG | Total packets | Discarded packets |
| A | 0 | 14269 | 0 |
| B | 0 | 14493 | 0 |
| C | 0 | 14133 | 0 |
| D | 0 | 18115 | 0 |
| Mode M9 | |||
|---|---|---|---|
| Quadrant | BADHDUFLAG | Total packets | Discarded packets |
| A | 0 | 13 | 0 |
| B | 0 | 13 | 0 |
| C | 0 | 13 | 0 |
| D | 0 | 13 | 0 |
| Quadrant | Total seconds | Saturated seconds | Saturation percentage |
|---|---|---|---|
| A | 6289 | 67 | 1.065352% |
| B | 6289 | 75 | 1.192558% |
| C | 6290 | 108 | 1.717011% |
| D | 6290 | 215 | 3.418124% |
Noise dominated data is calculated using 1-second bins in cleaned event files. If a bin has >2000 counts, and if more than 50% of those come from <1% of pixels, then it is considered to be noise-dominated and hence unusable.
| Quadrant | # 1 sec bins | Bins with >0 counts | Bins with >2000 counts | High rate bins dominated by noise | Noise dominated (total time) | Noise dominated (detector-on time) | Marked lightcurve |
|---|---|---|---|---|---|---|---|
| A | 7624 | 6290 | 1 | 1 | 0.01% | 0.02% | 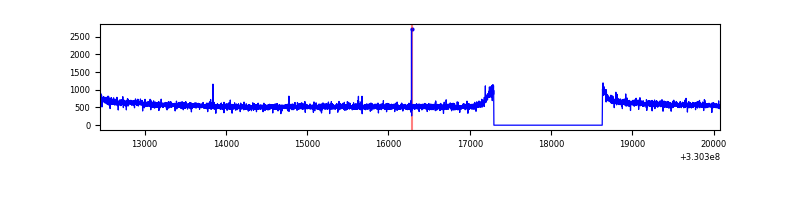 |
| B | 7624 | 6290 | 2 | 2 | 0.03% | 0.03% | 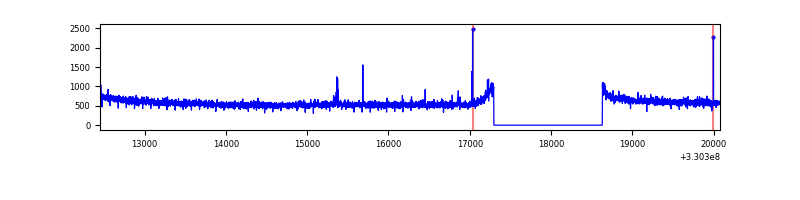 |
| C | 7625 | 6291 | 3 | 3 | 0.04% | 0.05% |  |
| D | 7625 | 6291 | 138 | 138 | 1.81% | 2.19% | 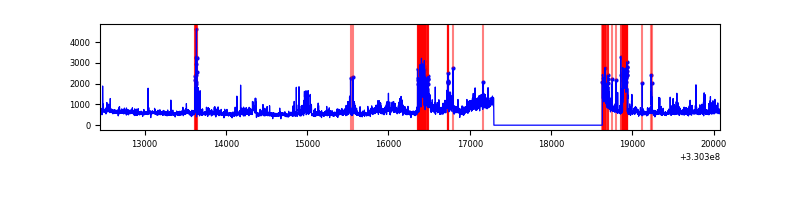 |
Top three noisy pixels from each quadrant. If the there are fewer than three noisy pixels in the level2.evt file, extra rows are filled as -1
| Pixel properties | Quadrant properties | ||||||
|---|---|---|---|---|---|---|---|
| Quadrant | DetID | PixID | Counts | Sigma | Mean | Median | Sigma |
| A | 13 | 254 | 9746 | 48.7 | 919 | 907 | 181.5 |
| A | 0 | 226 | 8098 | 39.62 | 919 | 907 | 181.5 |
| A | 3 | 137 | 7409 | 35.83 | 919 | 907 | 181.5 |
| B | 0 | 229 | 20036 | 112.45 | 912 | 896 | 170.2 |
| B | 12 | 111 | 19603 | 109.9 | 912 | 896 | 170.2 |
| B | 0 | 190 | 18042 | 100.73 | 912 | 896 | 170.2 |
| C | 14 | 238 | 140457 | 714.51 | 850 | 859 | 195.4 |
| C | 2 | 16 | 40111 | 200.91 | 850 | 859 | 195.4 |
| C | 3 | 233 | 19863 | 97.27 | 850 | 859 | 195.4 |
| D | 8 | 195 | 594093 | 2869.96 | 854 | 828 | 206.7 |
| D | 1 | 52 | 352662 | 1702.02 | 854 | 828 | 206.7 |
| D | 12 | 233 | 164524 | 791.89 | 854 | 828 | 206.7 |
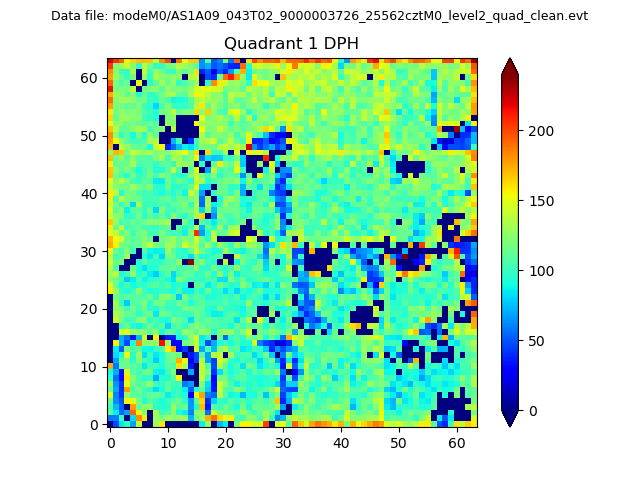
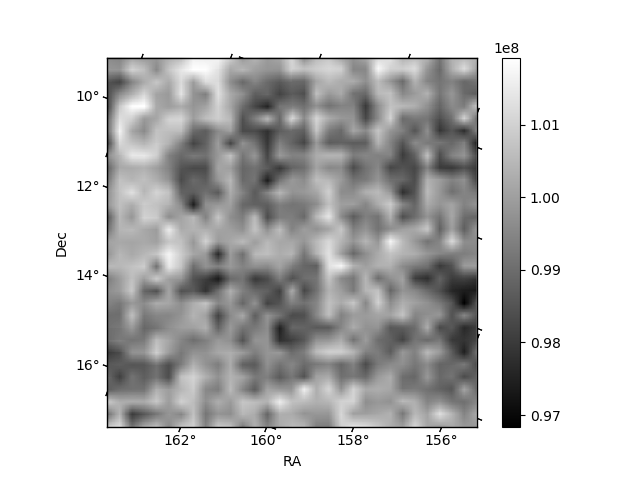
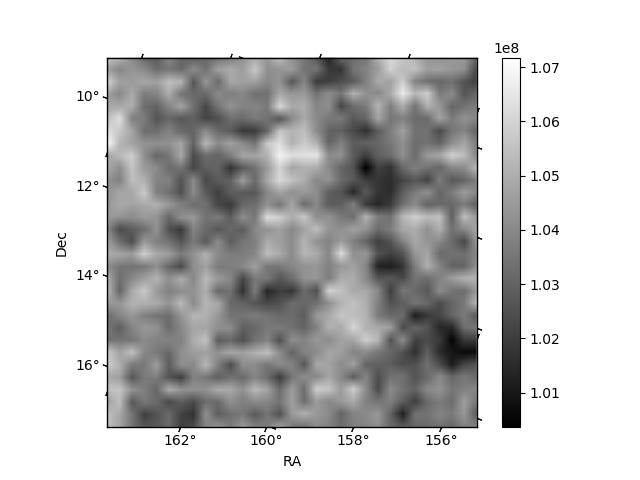
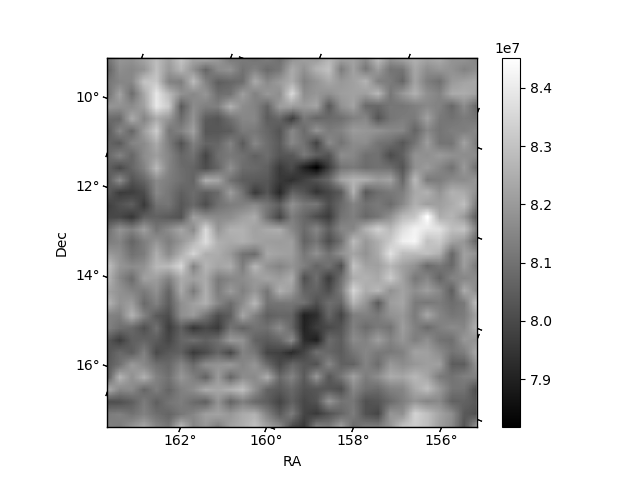
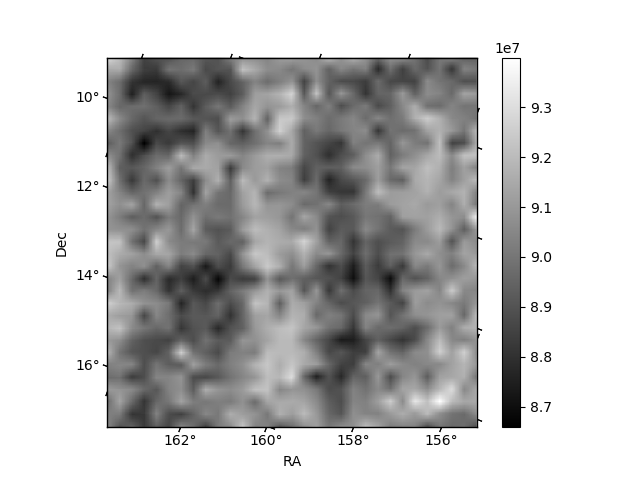
Histogram calculated using DETX and DETY for each event in the final _common_clean file
| Quadrant A | 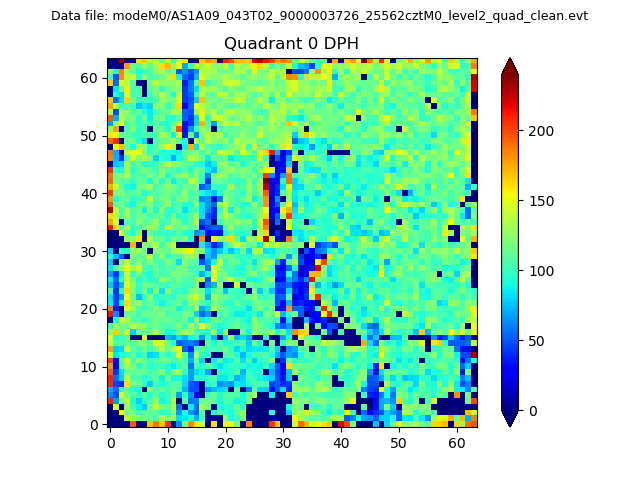 |
 |
Quadrant B |
|---|---|---|---|
| Quadrant D | 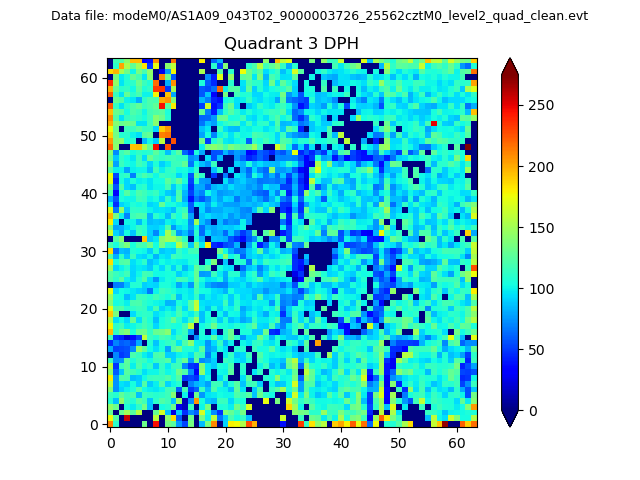 |
 |
Quadrant C |
| Plot type | Count rate plots | Images |
|---|---|---|
| Comparison with Poisson distribution Blue bars denote a histogram of data divided into 1 sec bins. Red curve is a Poisson curve with rate = median count rate of data. |
 |
 |
| Quadrant-wise count rates Data is divided into 100 sec bins |
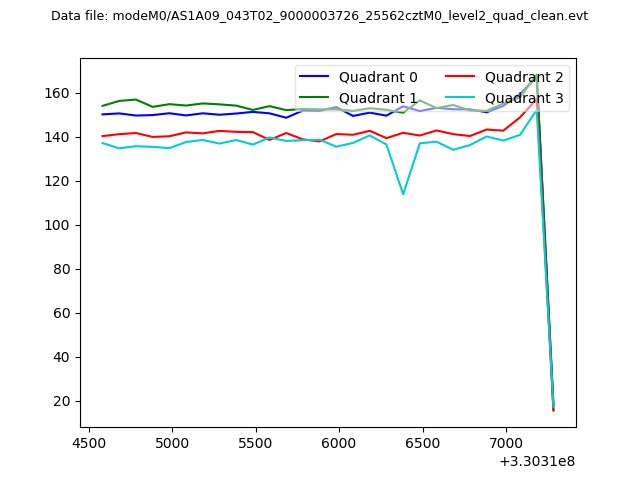 |
|
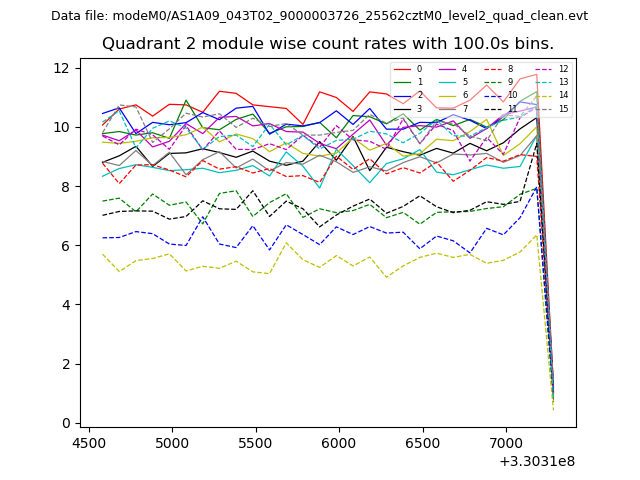
| Module-wise count rates for Quadrant A Data is divided into 100 sec bins |
 |
 |
| Module-wise count rates for Quadrant B Data is divided into 100 sec bins |
 |
 |
| Module-wise count rates for Quadrant C Data is divided into 100 sec bins |
 |
 |
| Module-wise count rates for Quadrant D Data is divided into 100 sec bins |
 |
 |
| Parameter | Plot |
|---|---|
| CZT HV Monitor | 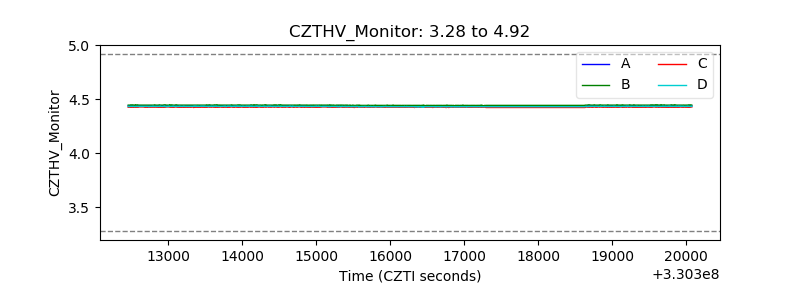 |
| D_VDD | 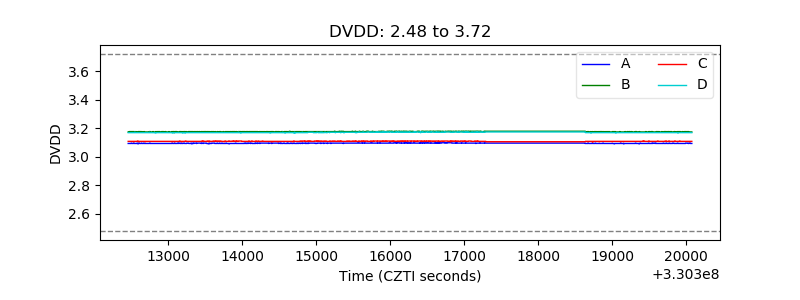 |
| Temperature 1 | 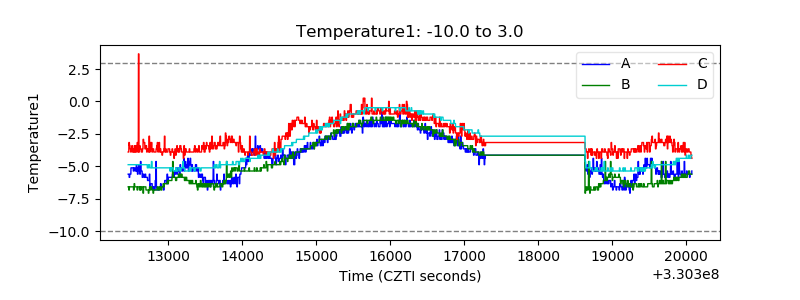 |
| Veto HV Monitor | 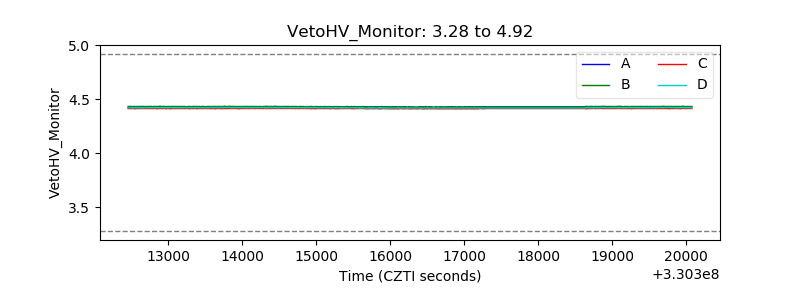 |
| Veto LLD | 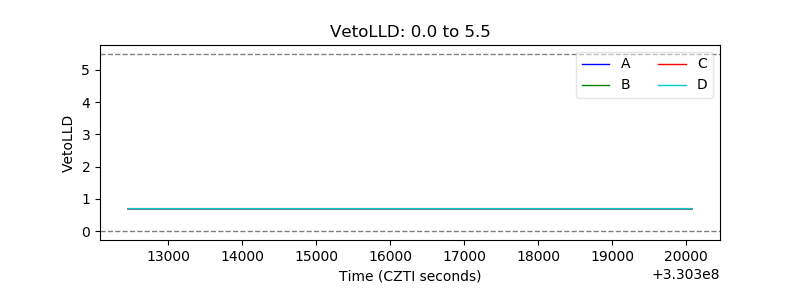 |
| Alpha Counter | 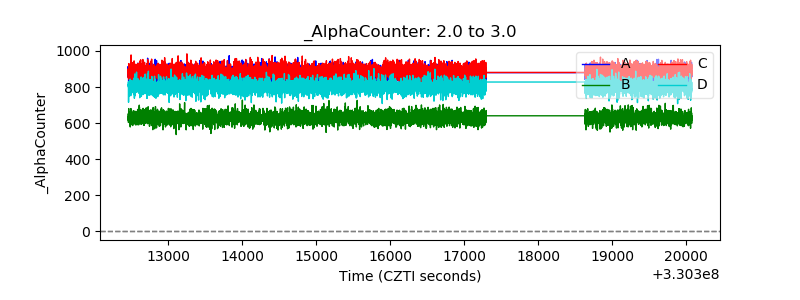 |
| _CPM_Rate | 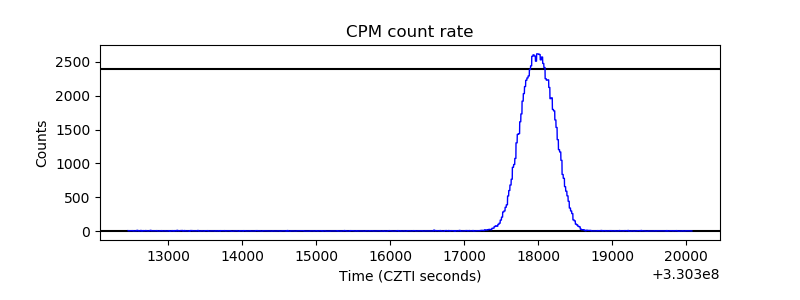 |
| CZT Counter | 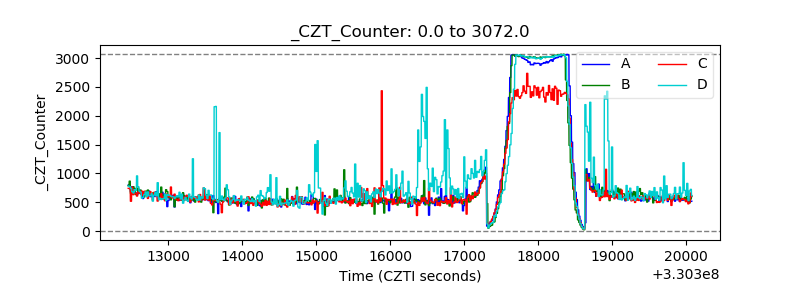 |
| +2.5 Volts monitor |  |
| +5 Volts monitor |  |
| _ROLL_ROT |  |
| _Roll_DEC |  |
| _Roll_RA | 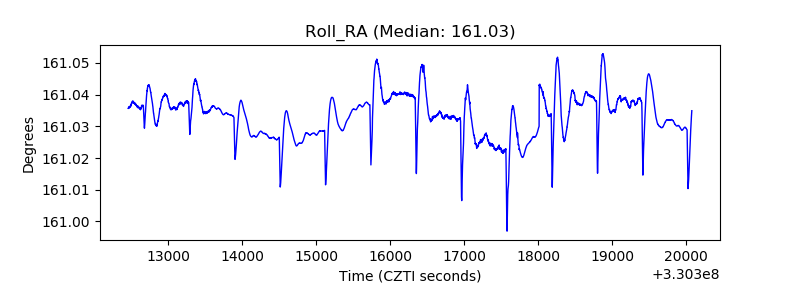 |
| Veto Counter | 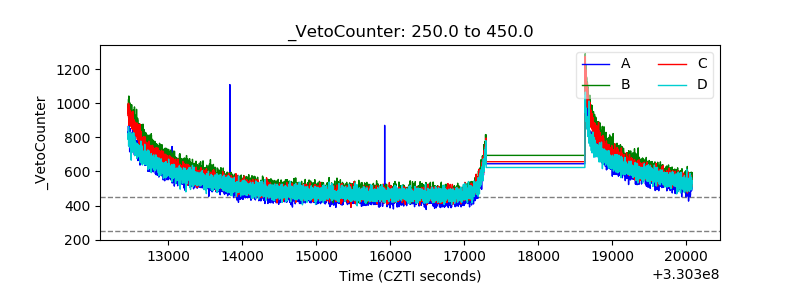 |