| Param | Original file | Final file |
|---|---|---|
| Filename | modeM0/AS1A09_043T02_9000003726_25563cztM0_level2.evt | modeM0/AS1A09_043T02_9000003726_25563cztM0_level2_quad_clean.evt |
| Size (bytes) | 540,768,960 | 75,568,320 |
| Size | 515.7 MB | 72.1 MB |
| Events in quadrant A | 3,513,347 | 482,817 |
| Events in quadrant B | 3,592,248 | 489,188 |
| Events in quadrant C | 3,501,031 | 448,996 |
| Events in quadrant D | 5,347,354 | 430,934 |
| Mode M0 | |||
|---|---|---|---|
| Quadrant | BADHDUFLAG | Total packets | Discarded packets |
| A | 0 | 14092 | 0 |
| B | 0 | 14433 | 0 |
| C | 0 | 14080 | 0 |
| D | 0 | 20446 | 0 |
| Mode M9 | |||
|---|---|---|---|
| Quadrant | BADHDUFLAG | Total packets | Discarded packets |
| A | 0 | 19 | 0 |
| B | 0 | 20 | 0 |
| C | 0 | 20 | 0 |
| D | 0 | 20 | 0 |
| Quadrant | Total seconds | Saturated seconds | Saturation percentage |
|---|---|---|---|
| A | 6255 | 105 | 1.678657% |
| B | 6255 | 118 | 1.886491% |
| C | 6255 | 153 | 2.446043% |
| D | 6255 | 271 | 4.332534% |
Noise dominated data is calculated using 1-second bins in cleaned event files. If a bin has >2000 counts, and if more than 50% of those come from <1% of pixels, then it is considered to be noise-dominated and hence unusable.
| Quadrant | # 1 sec bins | Bins with >0 counts | Bins with >2000 counts | High rate bins dominated by noise | Noise dominated (total time) | Noise dominated (detector-on time) | Marked lightcurve |
|---|---|---|---|---|---|---|---|
| A | 7600 | 6256 | 0 | 0 | 0.00% | 0.00% | 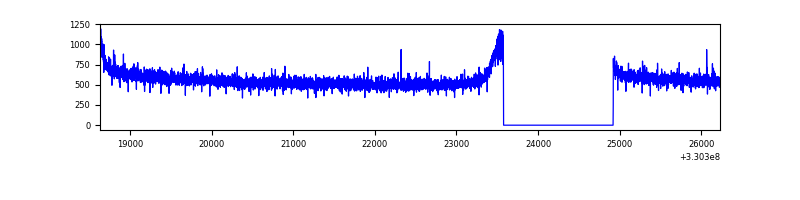 |
| B | 7600 | 6256 | 1 | 1 | 0.01% | 0.02% | 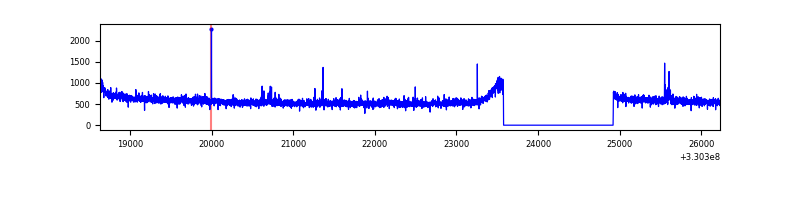 |
| C | 7600 | 6256 | 0 | 0 | 0.00% | 0.00% | 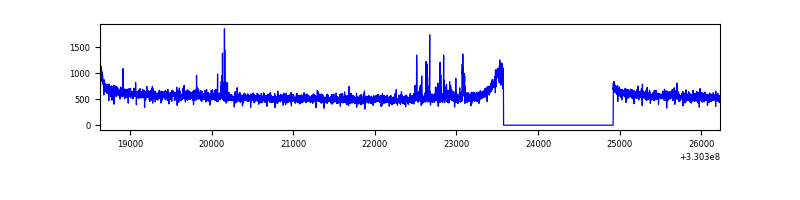 |
| D | 7600 | 6256 | 157 | 157 | 2.07% | 2.51% | 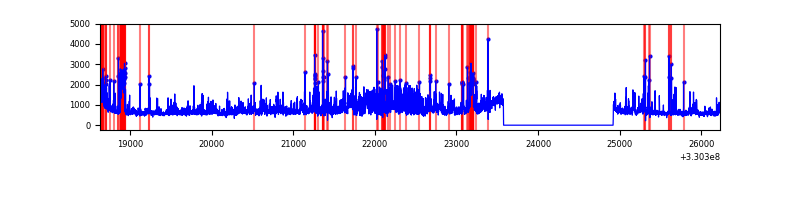 |
Top three noisy pixels from each quadrant. If the there are fewer than three noisy pixels in the level2.evt file, extra rows are filled as -1
| Pixel properties | Quadrant properties | ||||||
|---|---|---|---|---|---|---|---|
| Quadrant | DetID | PixID | Counts | Sigma | Mean | Median | Sigma |
| A | 13 | 254 | 10632 | 53.84 | 911 | 896 | 180.8 |
| A | 0 | 226 | 7960 | 39.07 | 911 | 896 | 180.8 |
| A | 3 | 137 | 7512 | 36.59 | 911 | 896 | 180.8 |
| B | 0 | 219 | 24016 | 137.54 | 900 | 885 | 168.2 |
| B | 12 | 111 | 19712 | 111.94 | 900 | 885 | 168.2 |
| B | 11 | 111 | 17598 | 99.37 | 900 | 885 | 168.2 |
| C | 14 | 238 | 139511 | 709.86 | 843 | 854 | 195.3 |
| C | 3 | 233 | 47500 | 238.81 | 843 | 854 | 195.3 |
| C | 5 | 112 | 28603 | 142.06 | 843 | 854 | 195.3 |
| D | 1 | 52 | 874308 | 4252.69 | 849 | 826 | 205.4 |
| D | 2 | 244 | 638959 | 3106.85 | 849 | 826 | 205.4 |
| D | 8 | 195 | 603513 | 2934.28 | 849 | 826 | 205.4 |
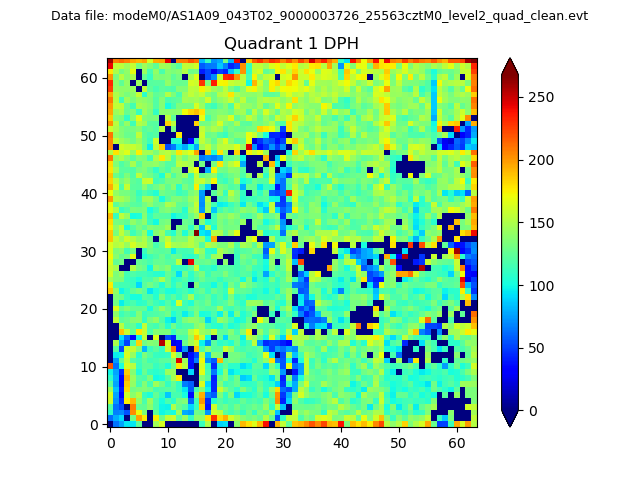
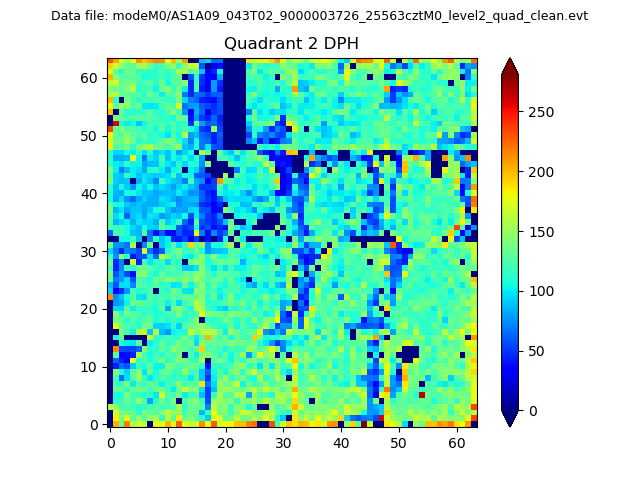
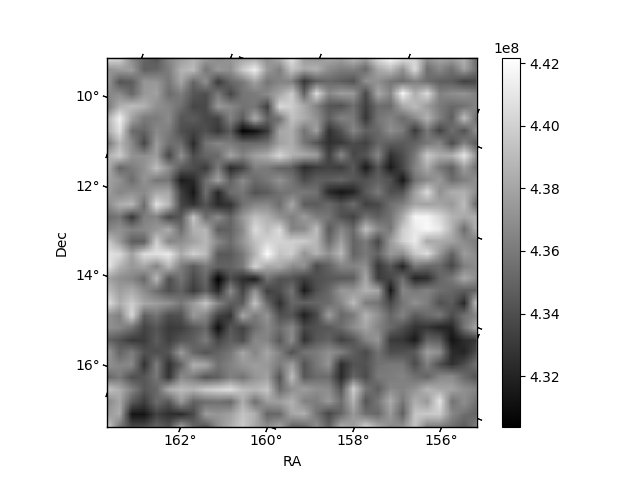
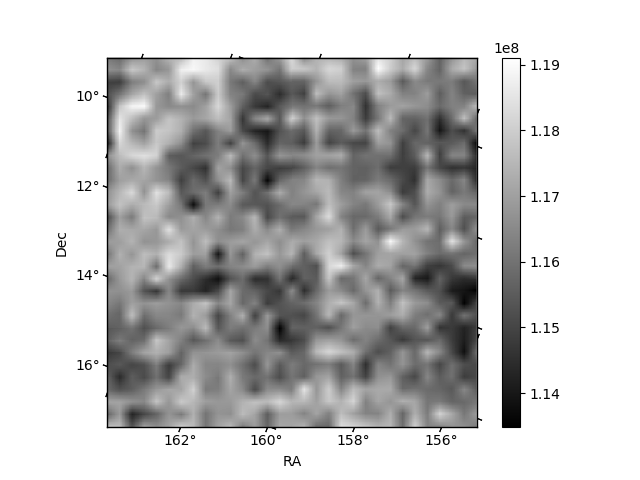
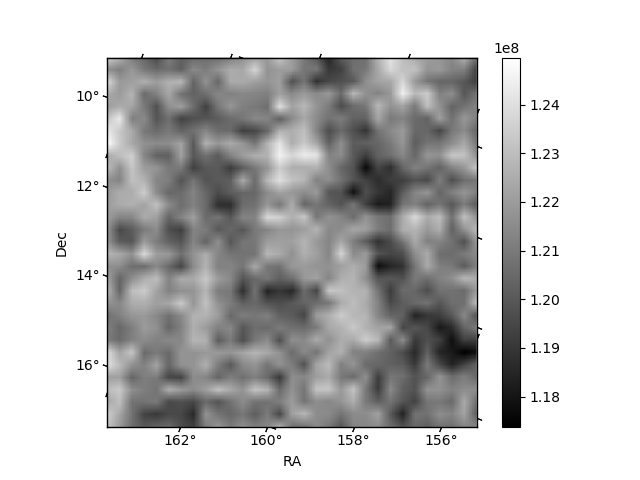
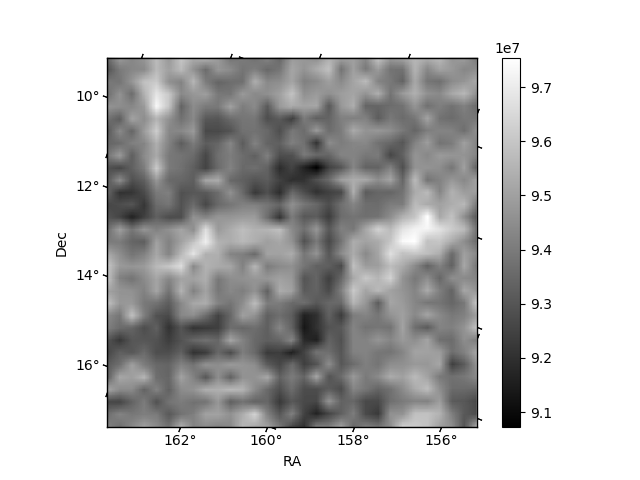
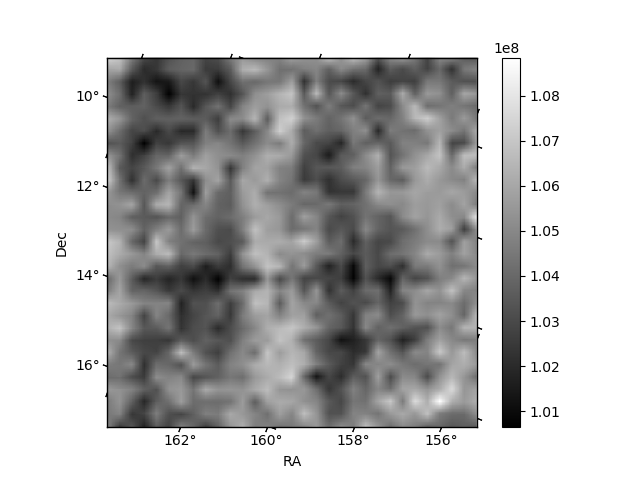
Histogram calculated using DETX and DETY for each event in the final _common_clean file
| Quadrant A |  |
 |
Quadrant B |
|---|---|---|---|
| Quadrant D | 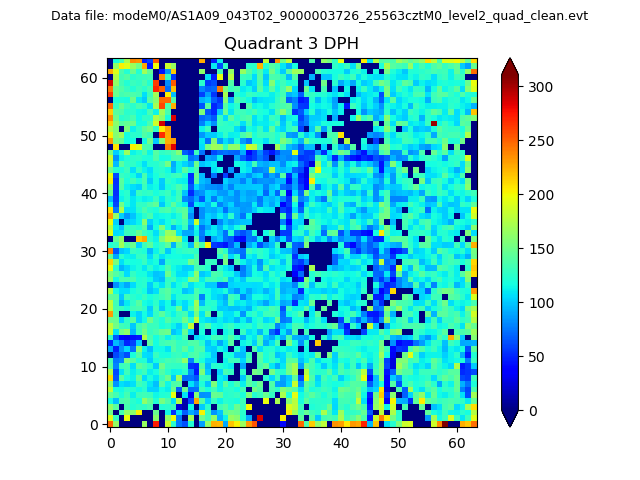 |
 |
Quadrant C |
| Plot type | Count rate plots | Images |
|---|---|---|
| Comparison with Poisson distribution Blue bars denote a histogram of data divided into 1 sec bins. Red curve is a Poisson curve with rate = median count rate of data. |
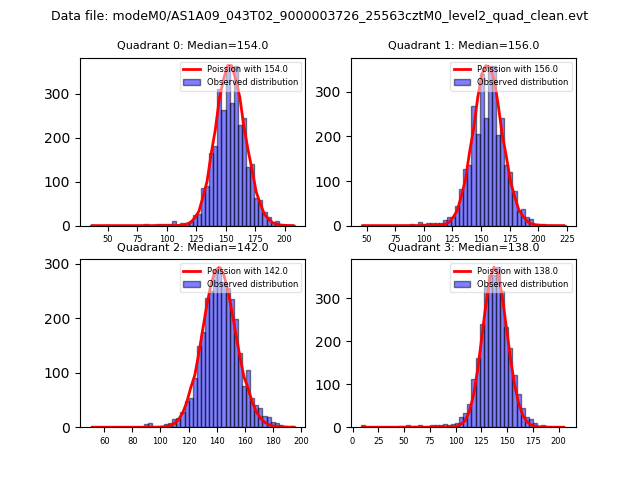 |
 |
| Quadrant-wise count rates Data is divided into 100 sec bins |
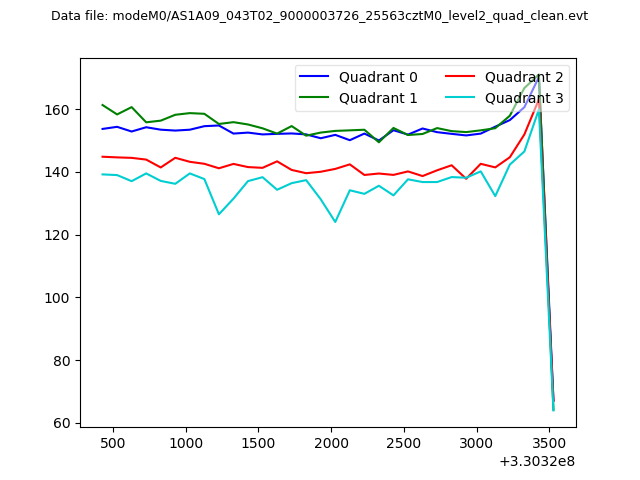 |
|
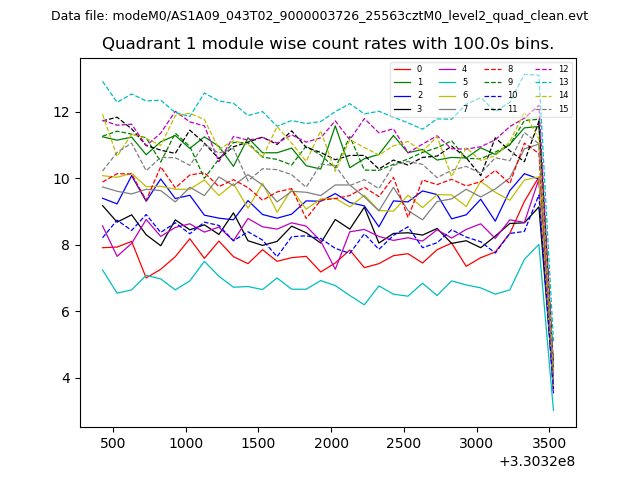
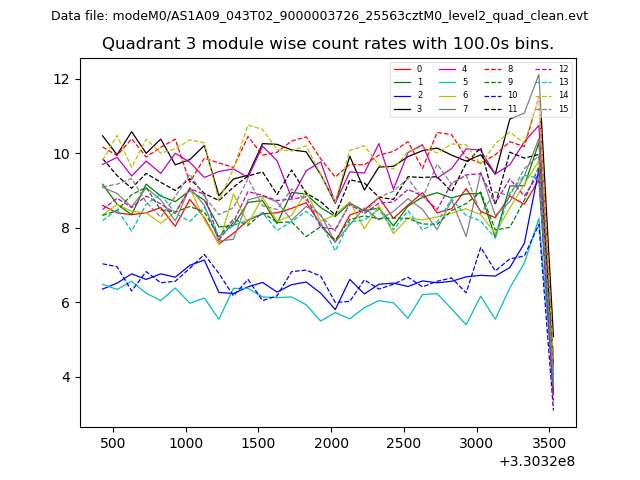
| Module-wise count rates for Quadrant A Data is divided into 100 sec bins |
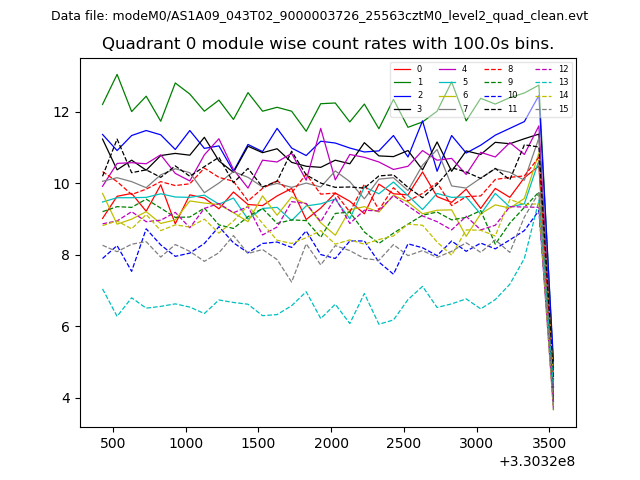 |
 |
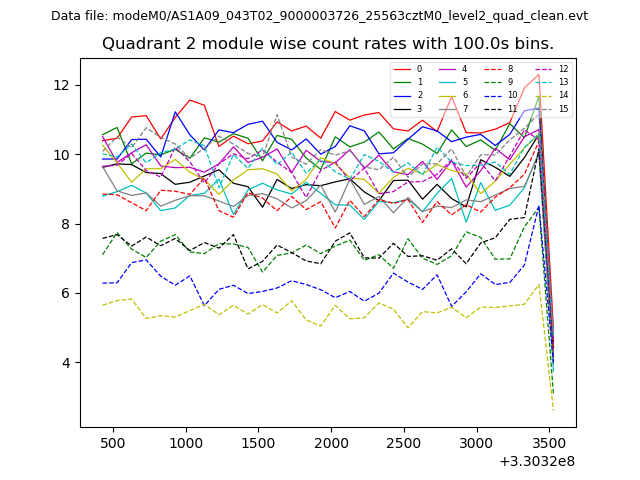
| Module-wise count rates for Quadrant B Data is divided into 100 sec bins |
 |
 |
| Module-wise count rates for Quadrant C Data is divided into 100 sec bins |
 |
 |
| Module-wise count rates for Quadrant D Data is divided into 100 sec bins |
 |
 |
| Parameter | Plot |
|---|---|
| CZT HV Monitor | 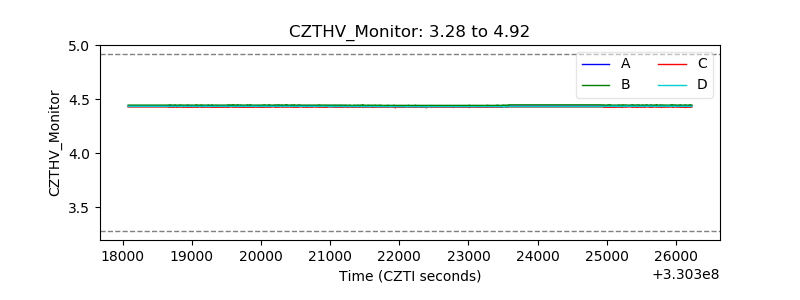 |
| D_VDD | 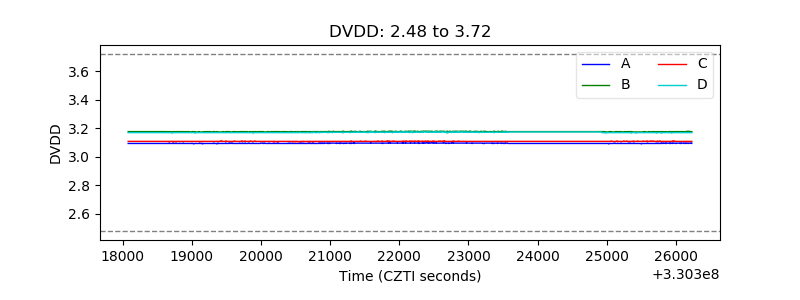 |
| Temperature 1 | 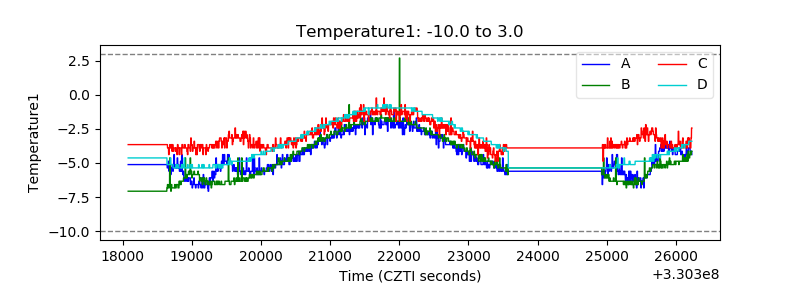 |
| Veto HV Monitor | 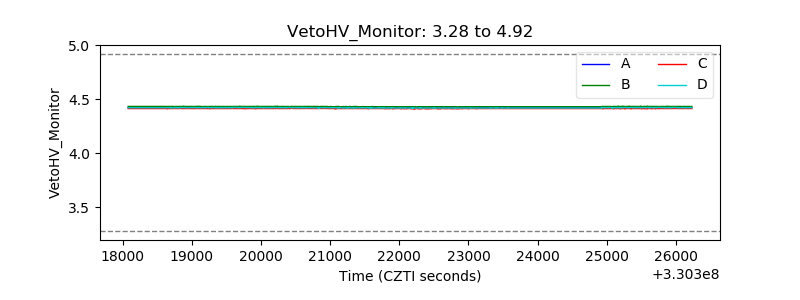 |
| Veto LLD | 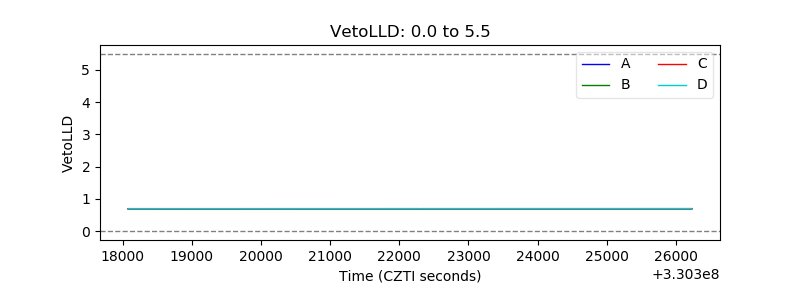 |
| Alpha Counter | 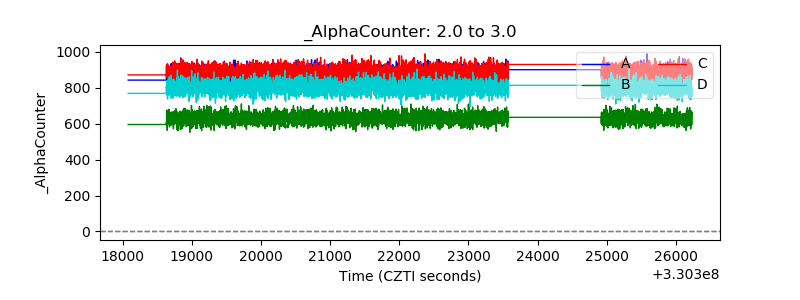 |
| _CPM_Rate | 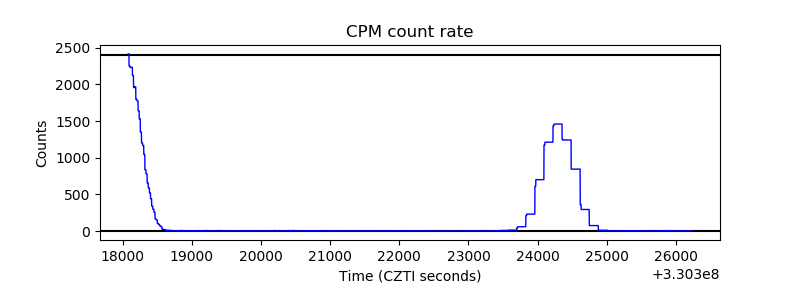 |
| CZT Counter | 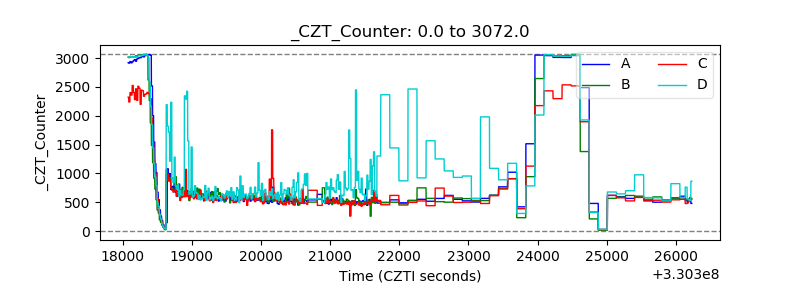 |
| +2.5 Volts monitor |  |
| +5 Volts monitor |  |
| _ROLL_ROT | 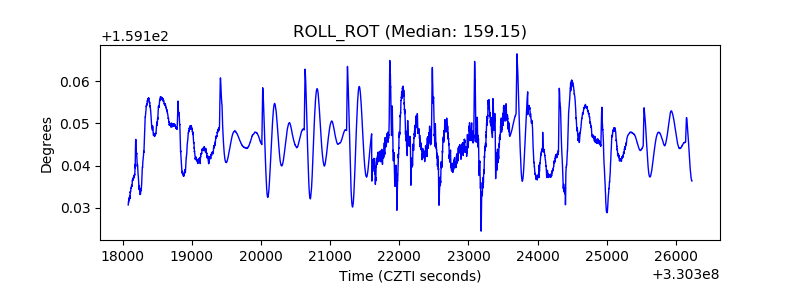 |
| _Roll_DEC | 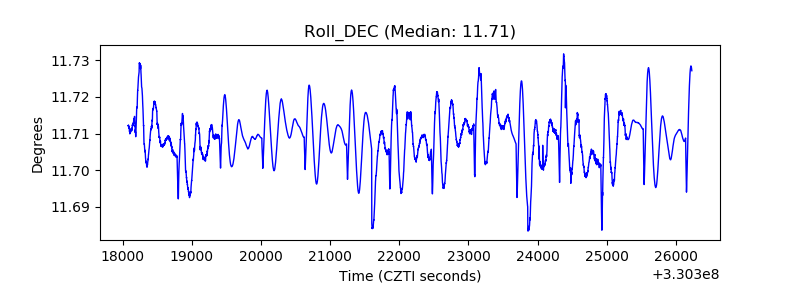 |
| _Roll_RA | 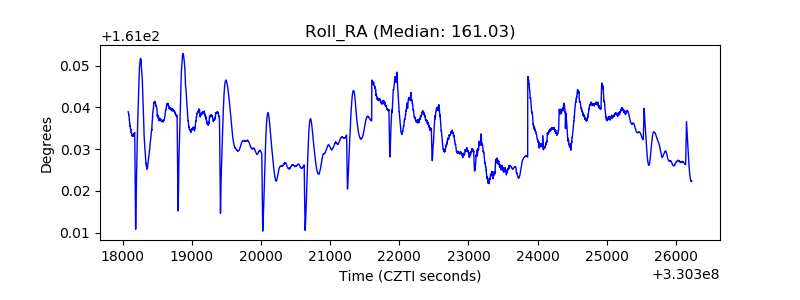 |
| Veto Counter | 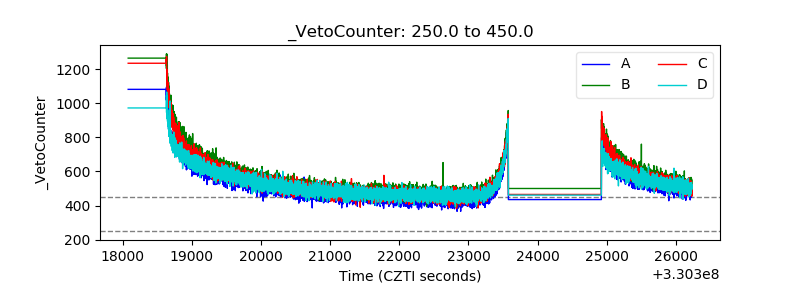 |