| Param | Original file | Final file |
|---|---|---|
| Filename | modeM0/AS1A09_043T02_9000003726_25564cztM0_level2.evt | modeM0/AS1A09_043T02_9000003726_25564cztM0_level2_quad_clean.evt |
| Size (bytes) | 560,266,560 | 87,768,000 |
| Size | 534.3 MB | 83.7 MB |
| Events in quadrant A | 3,388,225 | 581,288 |
| Events in quadrant B | 3,482,638 | 586,768 |
| Events in quadrant C | 3,364,276 | 542,624 |
| Events in quadrant D | 6,304,880 | 506,357 |
| Mode M0 | |||
|---|---|---|---|
| Quadrant | BADHDUFLAG | Total packets | Discarded packets |
| A | 0 | 13607 | 0 |
| B | 0 | 13934 | 0 |
| C | 0 | 13593 | 0 |
| D | 0 | 23172 | 0 |
| Mode M9 | |||
|---|---|---|---|
| Quadrant | BADHDUFLAG | Total packets | Discarded packets |
| A | 0 | 12 | 0 |
| B | 0 | 12 | 0 |
| C | 0 | 12 | 0 |
| D | 0 | 12 | 0 |
| Quadrant | Total seconds | Saturated seconds | Saturation percentage |
|---|---|---|---|
| A | 6323 | 87 | 1.375929% |
| B | 6323 | 110 | 1.739681% |
| C | 6323 | 127 | 2.008540% |
| D | 6323 | 673 | 10.643682% |
Noise dominated data is calculated using 1-second bins in cleaned event files. If a bin has >2000 counts, and if more than 50% of those come from <1% of pixels, then it is considered to be noise-dominated and hence unusable.
| Quadrant | # 1 sec bins | Bins with >0 counts | Bins with >2000 counts | High rate bins dominated by noise | Noise dominated (total time) | Noise dominated (detector-on time) | Marked lightcurve |
|---|---|---|---|---|---|---|---|
| A | 7483 | 6324 | 0 | 0 | 0.00% | 0.00% | 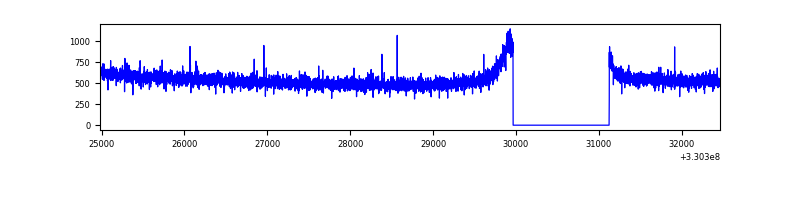 |
| B | 7483 | 6324 | 0 | 0 | 0.00% | 0.00% | 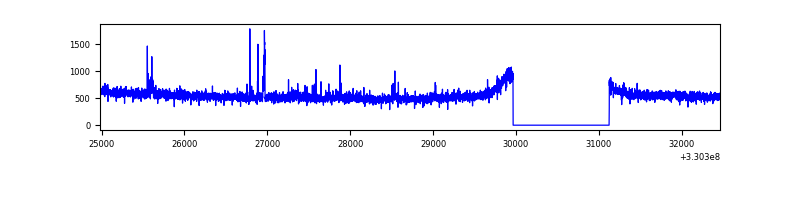 |
| C | 7483 | 6324 | 1 | 1 | 0.01% | 0.02% | 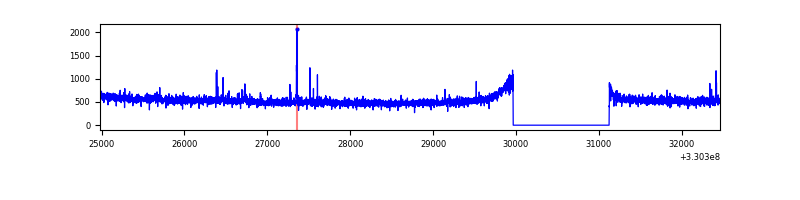 |
| D | 7483 | 6324 | 573 | 573 | 7.66% | 9.06% | 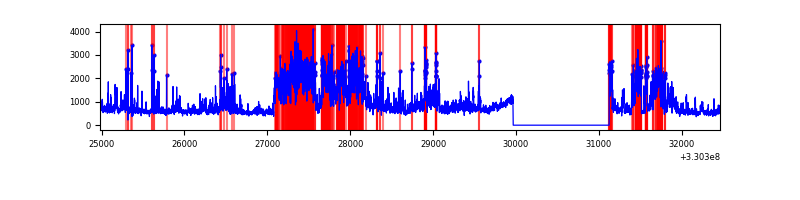 |
Top three noisy pixels from each quadrant. If the there are fewer than three noisy pixels in the level2.evt file, extra rows are filled as -1
| Pixel properties | Quadrant properties | ||||||
|---|---|---|---|---|---|---|---|
| Quadrant | DetID | PixID | Counts | Sigma | Mean | Median | Sigma |
| A | 13 | 254 | 10544 | 55.14 | 878 | 862 | 175.6 |
| A | 3 | 137 | 7602 | 38.39 | 878 | 862 | 175.6 |
| A | 0 | 226 | 7562 | 38.16 | 878 | 862 | 175.6 |
| B | 3 | 112 | 33635 | 201.35 | 862 | 842 | 162.9 |
| B | 0 | 219 | 31022 | 185.31 | 862 | 842 | 162.9 |
| B | 0 | 190 | 24224 | 143.57 | 862 | 842 | 162.9 |
| C | 14 | 238 | 131040 | 685.21 | 817 | 822 | 190.0 |
| C | 2 | 16 | 26269 | 133.9 | 817 | 822 | 190.0 |
| C | 3 | 233 | 25983 | 132.4 | 817 | 822 | 190.0 |
| D | 8 | 195 | 1581468 | 7912.52 | 816 | 793 | 199.8 |
| D | 1 | 52 | 1014876 | 5076.28 | 816 | 793 | 199.8 |
| D | 2 | 244 | 307710 | 1536.36 | 816 | 793 | 199.8 |
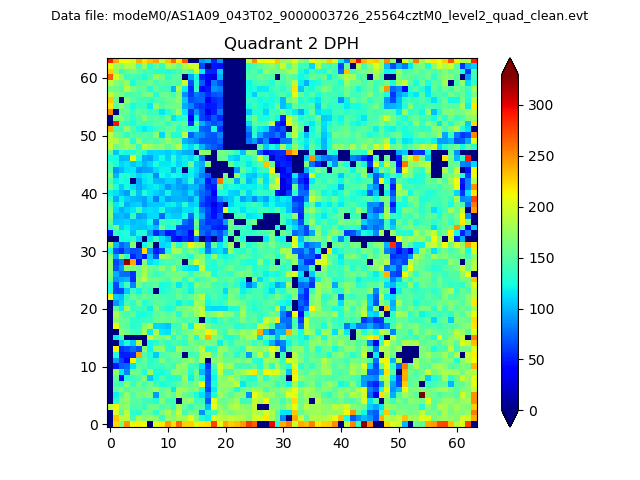
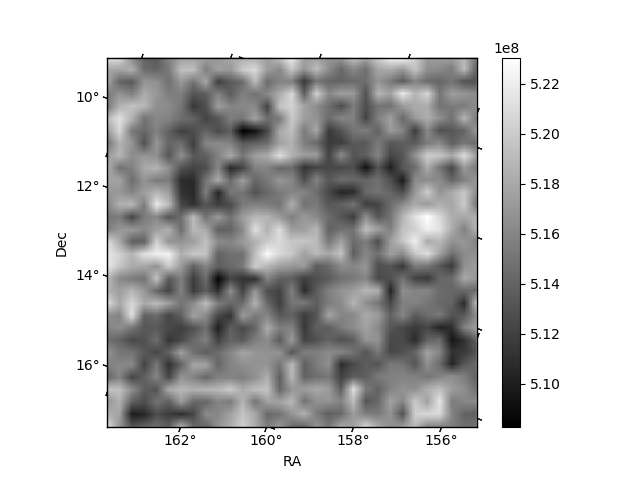
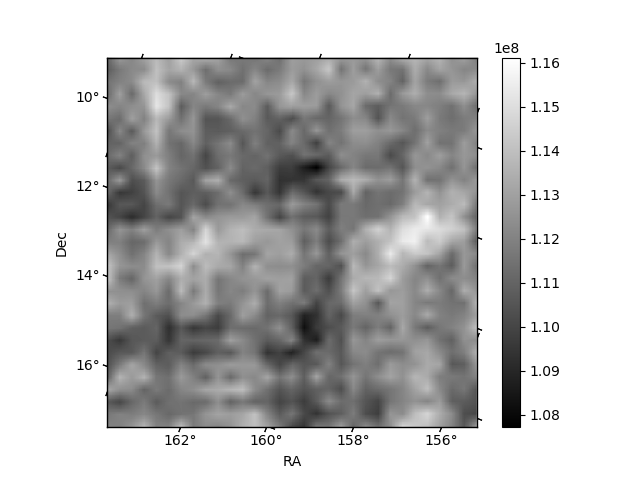
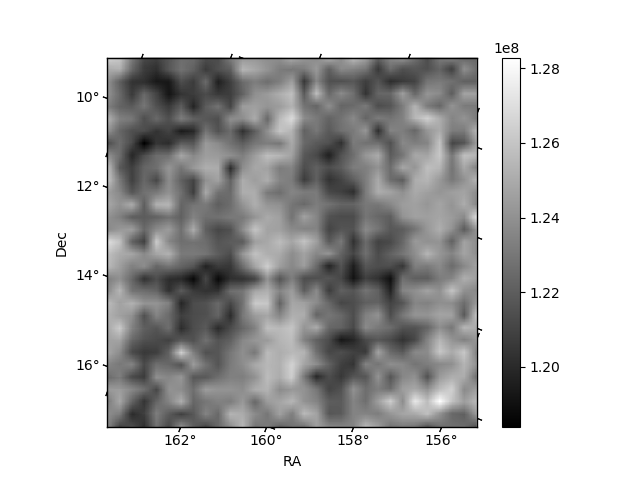
Histogram calculated using DETX and DETY for each event in the final _common_clean file
| Quadrant A | 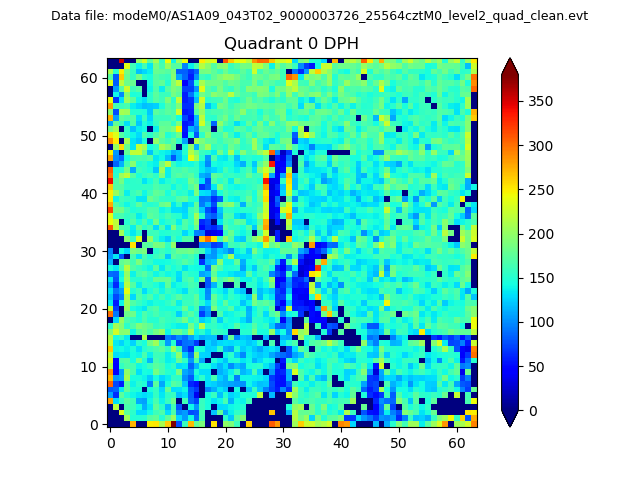 |
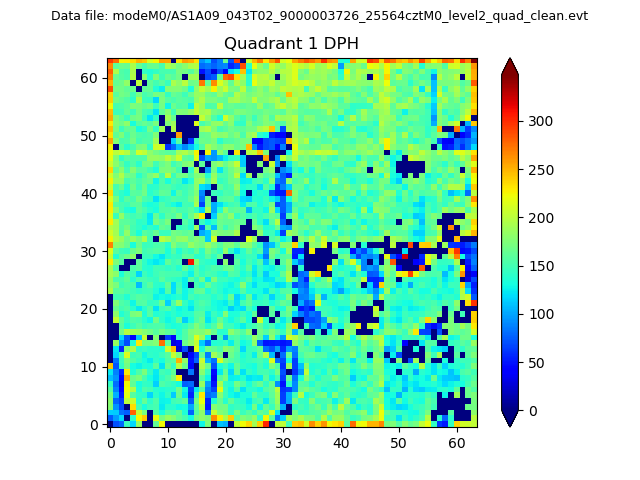 |
Quadrant B |
|---|---|---|---|
| Quadrant D | 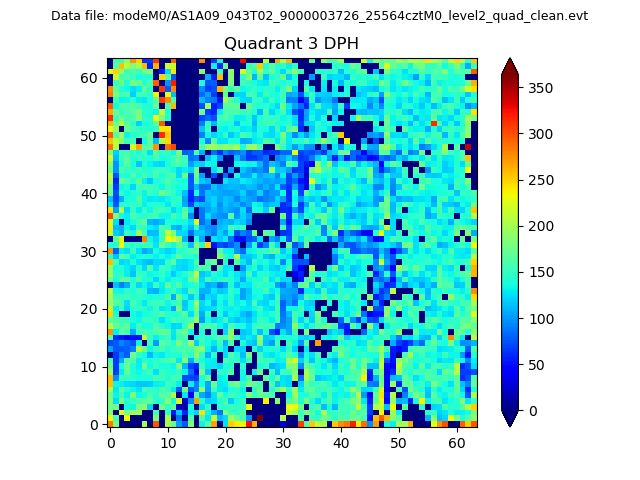 |
 |
Quadrant C |
| Plot type | Count rate plots | Images |
|---|---|---|
| Comparison with Poisson distribution Blue bars denote a histogram of data divided into 1 sec bins. Red curve is a Poisson curve with rate = median count rate of data. |
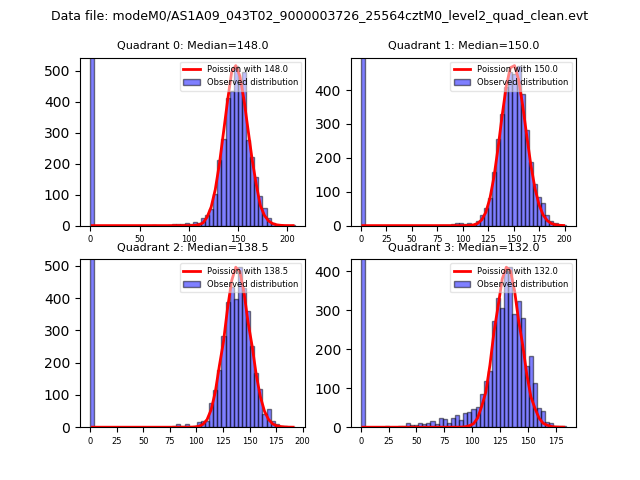 |
 |
| Quadrant-wise count rates Data is divided into 100 sec bins |
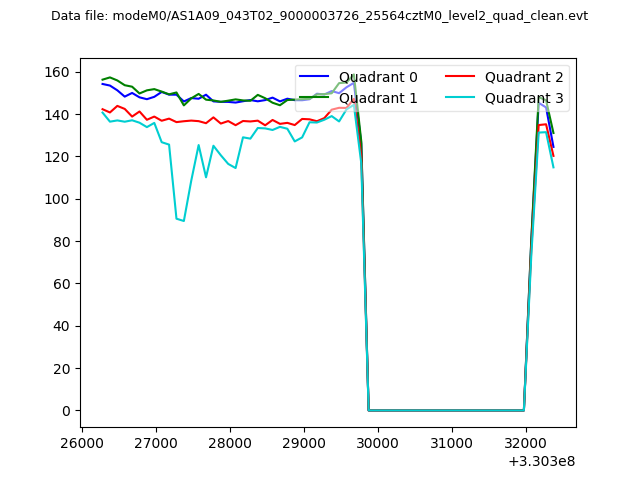 |
|
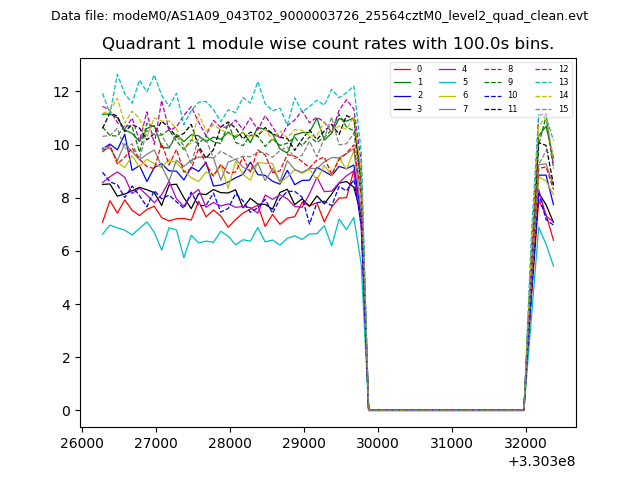
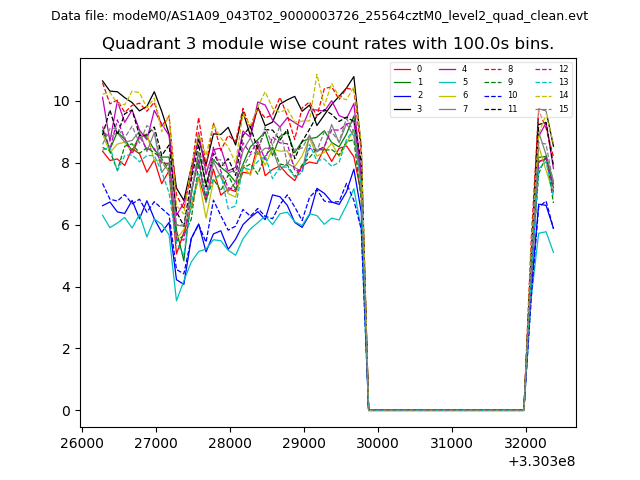
| Module-wise count rates for Quadrant A Data is divided into 100 sec bins |
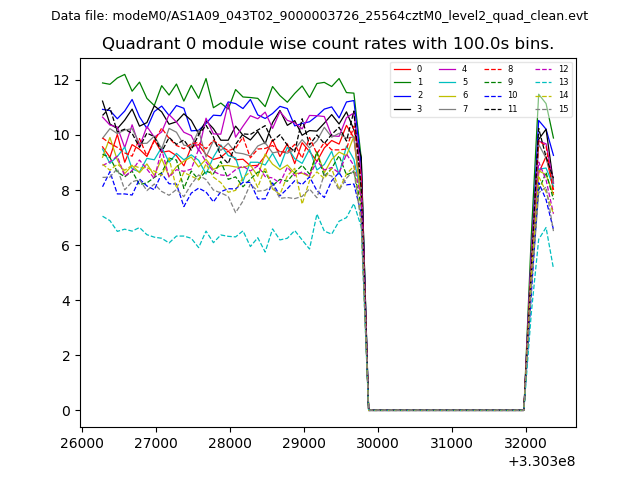 |
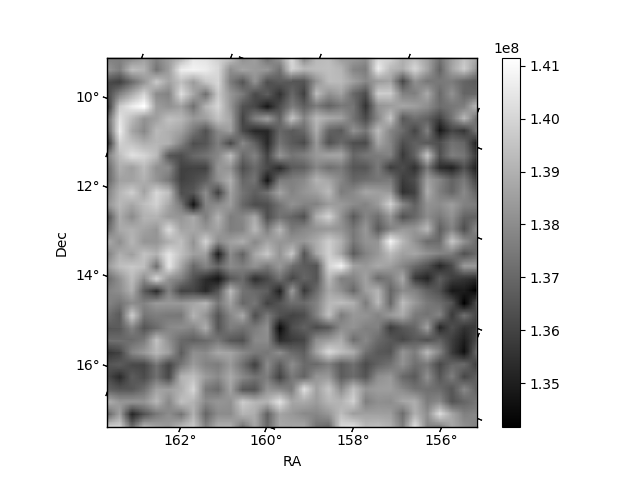 |
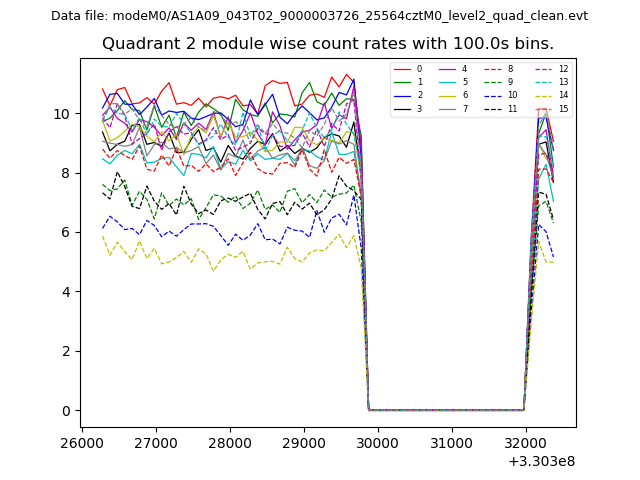
| Module-wise count rates for Quadrant B Data is divided into 100 sec bins |
 |
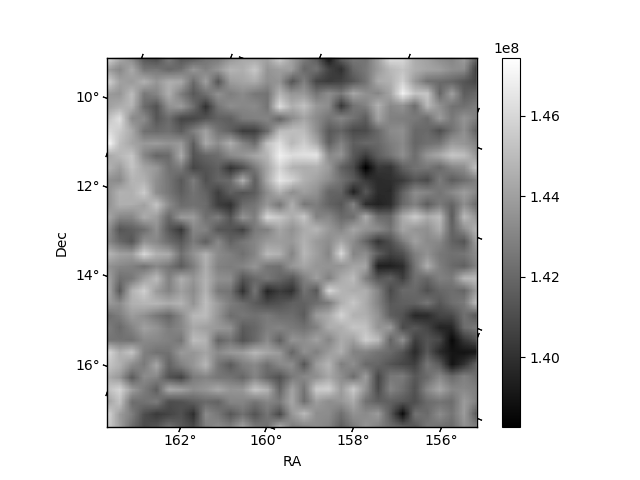 |
| Module-wise count rates for Quadrant C Data is divided into 100 sec bins |
 |
 |
| Module-wise count rates for Quadrant D Data is divided into 100 sec bins |
 |
 |
| Parameter | Plot |
|---|---|
| CZT HV Monitor | 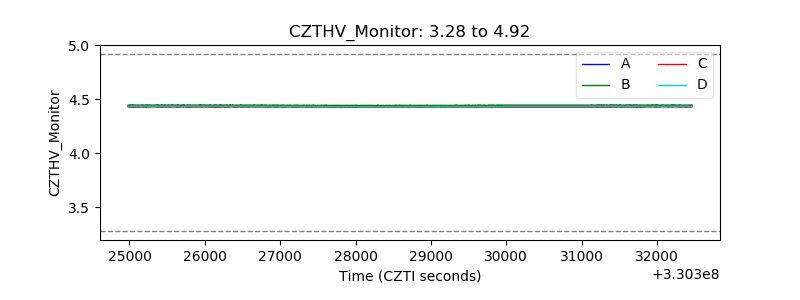 |
| D_VDD | 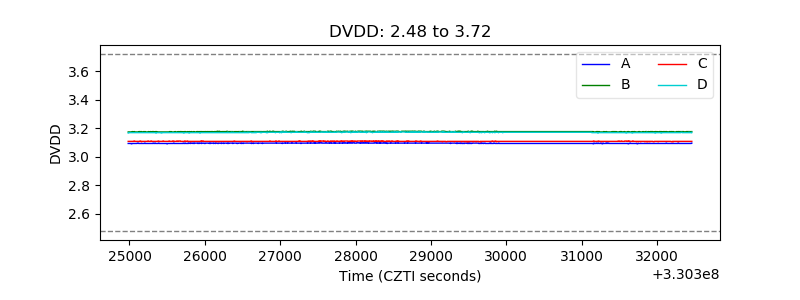 |
| Temperature 1 | 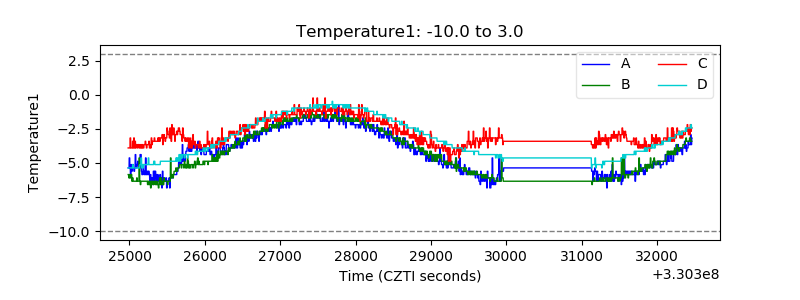 |
| Veto HV Monitor | 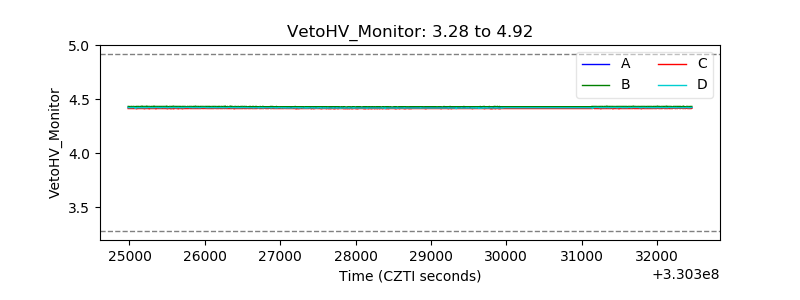 |
| Veto LLD | 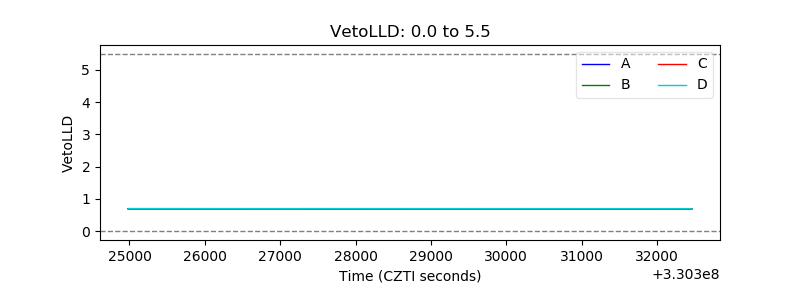 |
| Alpha Counter | 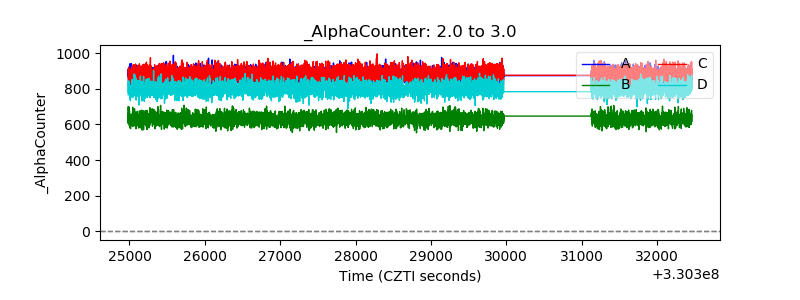 |
| _CPM_Rate | 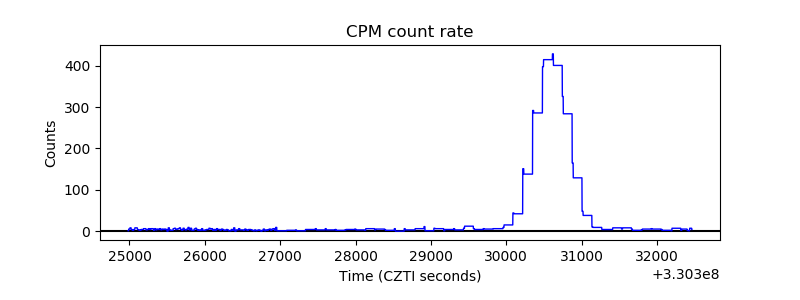 |
| CZT Counter | 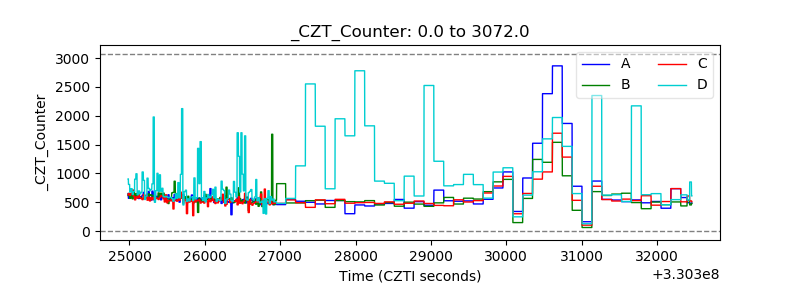 |
| +2.5 Volts monitor |  |
| +5 Volts monitor | 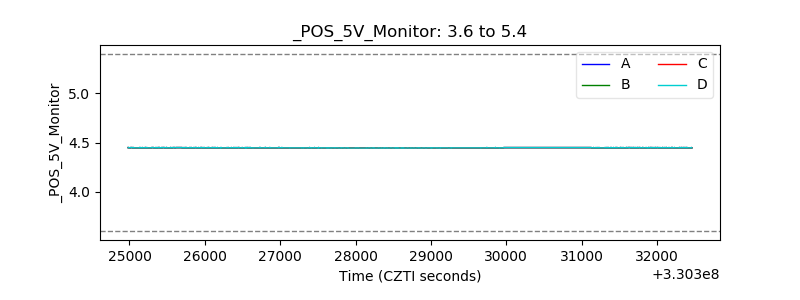 |
| _ROLL_ROT | 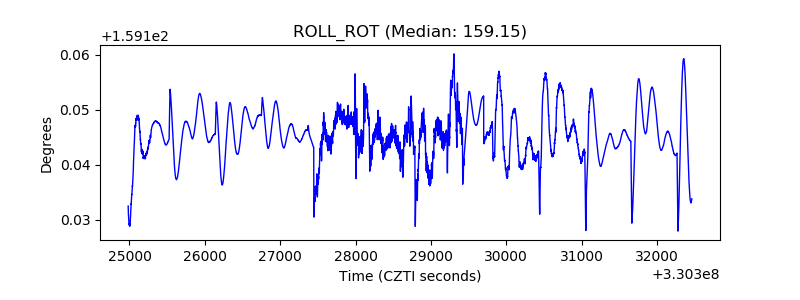 |
| _Roll_DEC | 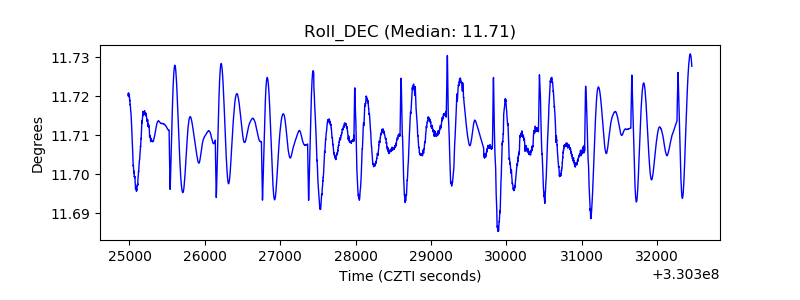 |
| _Roll_RA | 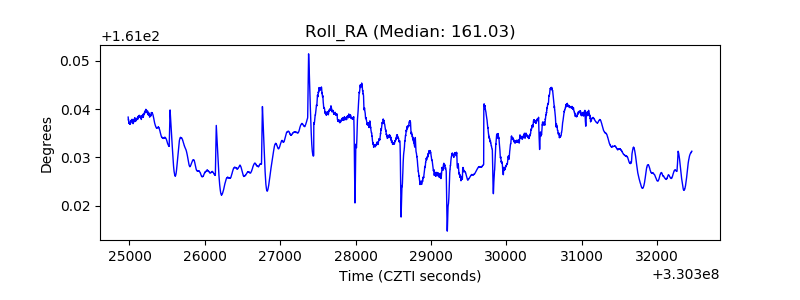 |
| Veto Counter | 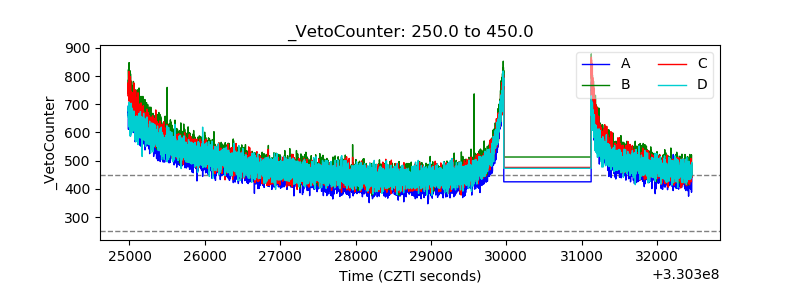 |