| Param | Original file | Final file |
|---|---|---|
| Filename | modeM0/AS1A09_043T02_9000003726_25565cztM0_level2.evt | modeM0/AS1A09_043T02_9000003726_25565cztM0_level2_quad_clean.evt |
| Size (bytes) | 544,060,800 | 94,282,560 |
| Size | 518.9 MB | 89.9 MB |
| Events in quadrant A | 3,502,385 | 616,478 |
| Events in quadrant B | 3,603,002 | 620,758 |
| Events in quadrant C | 3,510,489 | 580,876 |
| Events in quadrant D | 5,393,242 | 556,709 |
| Mode M0 | |||
|---|---|---|---|
| Quadrant | BADHDUFLAG | Total packets | Discarded packets |
| A | 0 | 14386 | 0 |
| B | 0 | 14636 | 0 |
| C | 0 | 14447 | 0 |
| D | 0 | 20458 | 0 |
| Mode M9 | |||
|---|---|---|---|
| Quadrant | BADHDUFLAG | Total packets | Discarded packets |
| A | 0 | 12 | 0 |
| B | 0 | 13 | 0 |
| C | 0 | 13 | 0 |
| D | 0 | 13 | 0 |
| Quadrant | Total seconds | Saturated seconds | Saturation percentage |
|---|---|---|---|
| A | 6896 | 131 | 1.899652% |
| B | 6895 | 168 | 2.436548% |
| C | 6895 | 186 | 2.697607% |
| D | 6895 | 403 | 5.844815% |
Noise dominated data is calculated using 1-second bins in cleaned event files. If a bin has >2000 counts, and if more than 50% of those come from <1% of pixels, then it is considered to be noise-dominated and hence unusable.
| Quadrant | # 1 sec bins | Bins with >0 counts | Bins with >2000 counts | High rate bins dominated by noise | Noise dominated (total time) | Noise dominated (detector-on time) | Marked lightcurve |
|---|---|---|---|---|---|---|---|
| A | 7696 | 6897 | 0 | 0 | 0.00% | 0.00% | 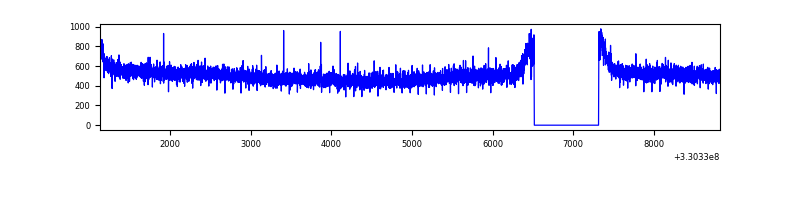 |
| B | 7695 | 6896 | 0 | 0 | 0.00% | 0.00% | 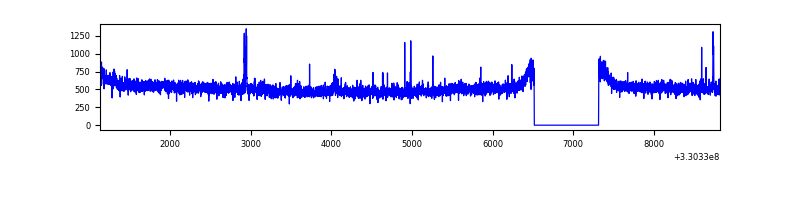 |
| C | 7695 | 6896 | 3 | 3 | 0.04% | 0.04% | 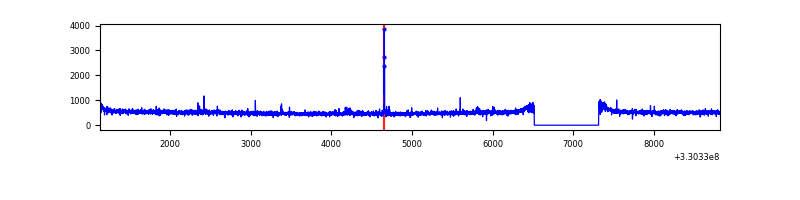 |
| D | 7695 | 6896 | 270 | 270 | 3.51% | 3.92% | 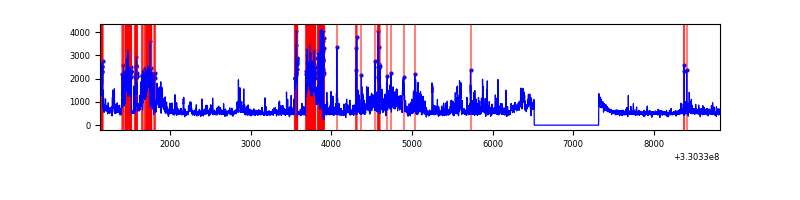 |
Top three noisy pixels from each quadrant. If the there are fewer than three noisy pixels in the level2.evt file, extra rows are filled as -1
| Pixel properties | Quadrant properties | ||||||
|---|---|---|---|---|---|---|---|
| Quadrant | DetID | PixID | Counts | Sigma | Mean | Median | Sigma |
| A | 13 | 254 | 11578 | 58.54 | 908 | 890 | 182.6 |
| A | 3 | 137 | 8126 | 39.63 | 908 | 890 | 182.6 |
| A | 0 | 226 | 7858 | 38.16 | 908 | 890 | 182.6 |
| B | 0 | 219 | 50709 | 292.04 | 893 | 872 | 170.7 |
| B | 0 | 190 | 26551 | 150.48 | 893 | 872 | 170.7 |
| B | 3 | 112 | 26205 | 148.45 | 893 | 872 | 170.7 |
| C | 14 | 238 | 136890 | 679.52 | 852 | 856 | 200.2 |
| C | 2 | 16 | 41098 | 201.02 | 852 | 856 | 200.2 |
| C | 3 | 233 | 14204 | 66.68 | 852 | 856 | 200.2 |
| D | 1 | 52 | 1098295 | 5165.51 | 861 | 834 | 212.5 |
| D | 2 | 244 | 532886 | 2504.25 | 861 | 834 | 212.5 |
| D | 8 | 195 | 352153 | 1653.58 | 861 | 834 | 212.5 |
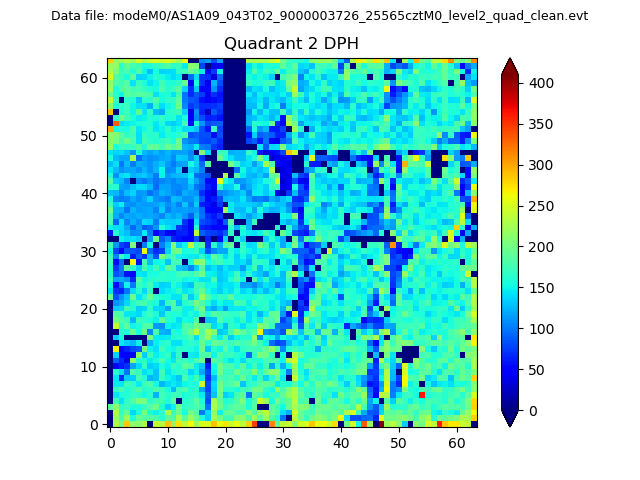
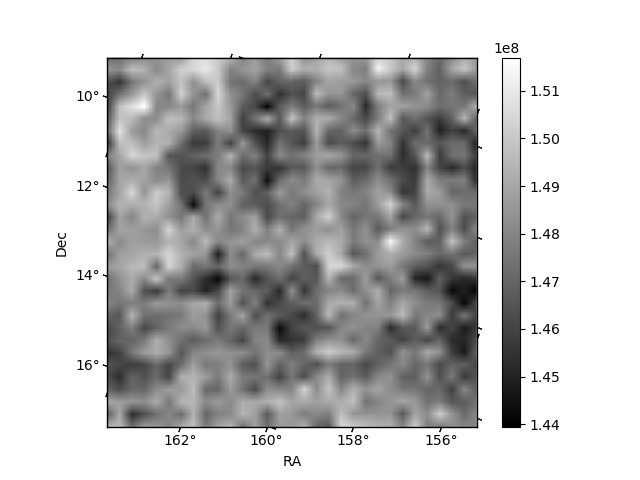
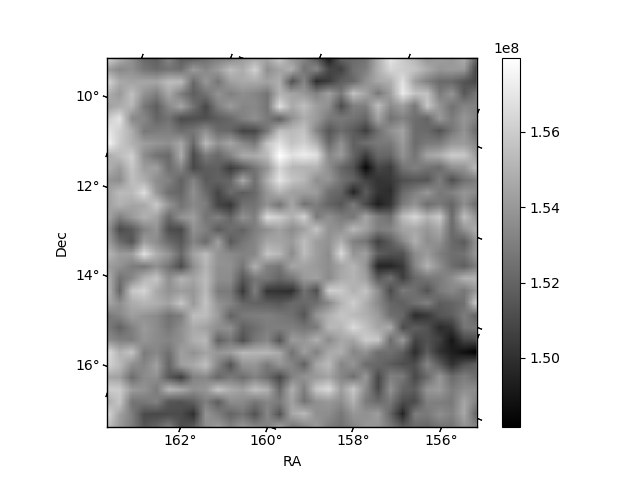
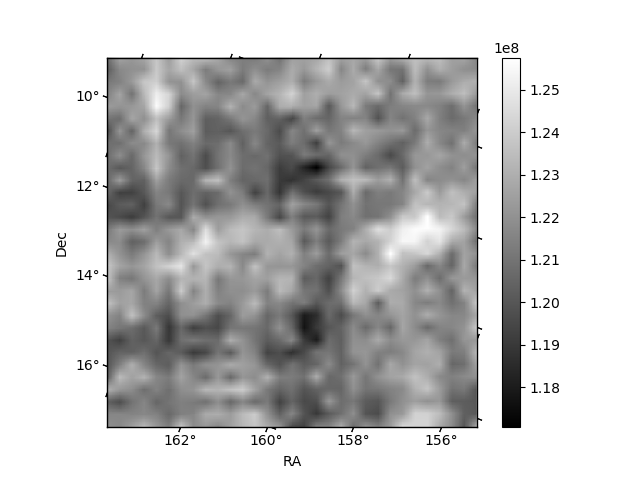
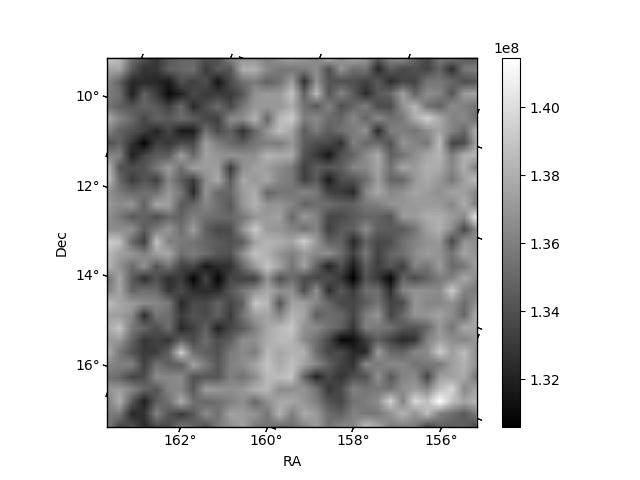
Histogram calculated using DETX and DETY for each event in the final _common_clean file
| Quadrant A | 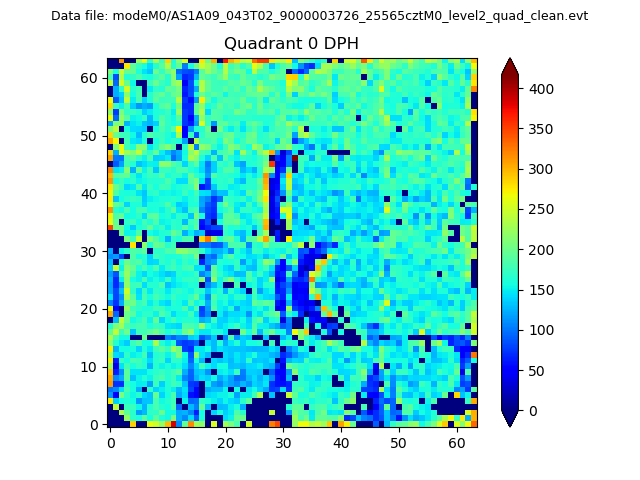 |
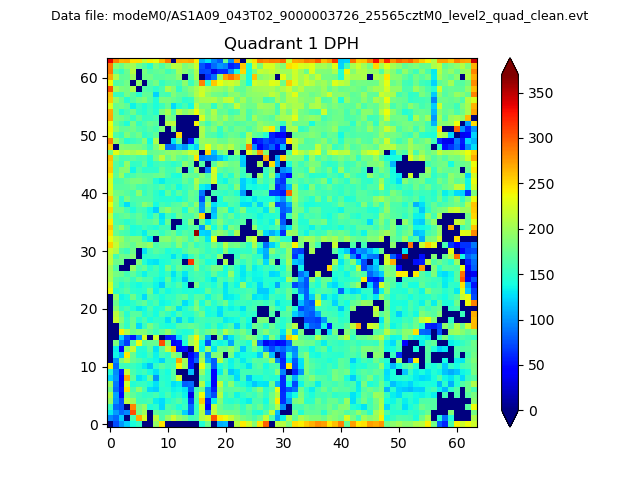 |
Quadrant B |
|---|---|---|---|
| Quadrant D | 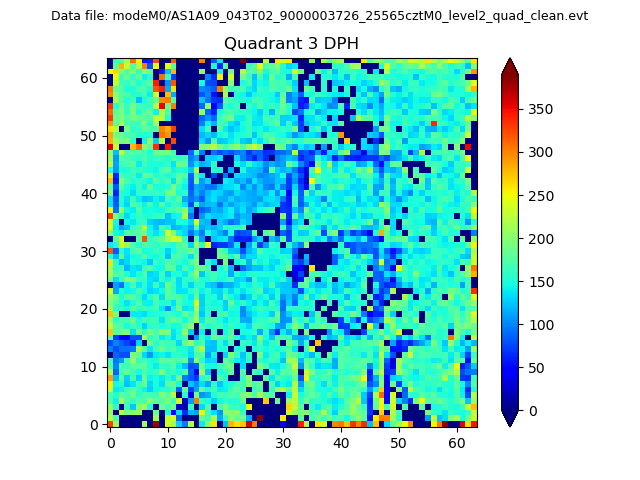 |
 |
Quadrant C |
| Plot type | Count rate plots | Images |
|---|---|---|
| Comparison with Poisson distribution Blue bars denote a histogram of data divided into 1 sec bins. Red curve is a Poisson curve with rate = median count rate of data. |
 |
 |
| Quadrant-wise count rates Data is divided into 100 sec bins |
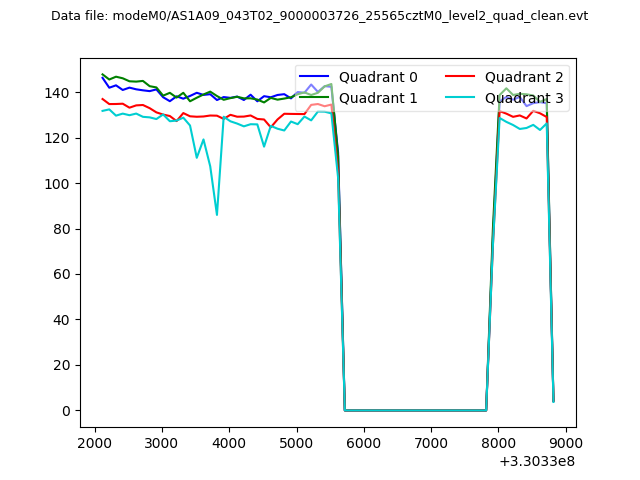 |
|
| Module-wise count rates for Quadrant A Data is divided into 100 sec bins |
 |
 |
| Module-wise count rates for Quadrant B Data is divided into 100 sec bins |
 |
 |
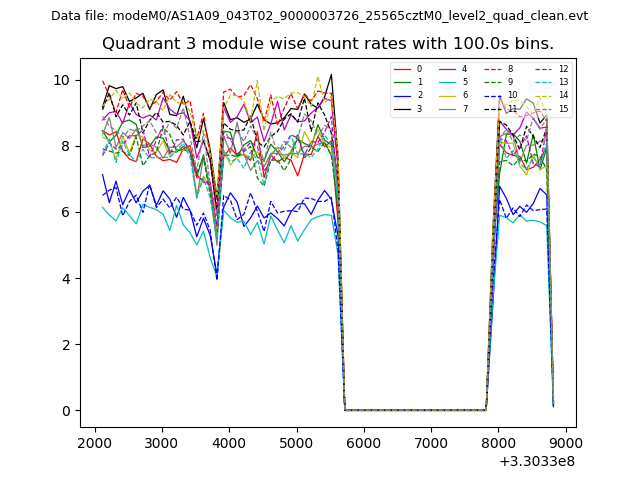
| Module-wise count rates for Quadrant C Data is divided into 100 sec bins |
 |
 |
| Module-wise count rates for Quadrant D Data is divided into 100 sec bins |
 |
 |
| Parameter | Plot |
|---|---|
| CZT HV Monitor |  |
| D_VDD | 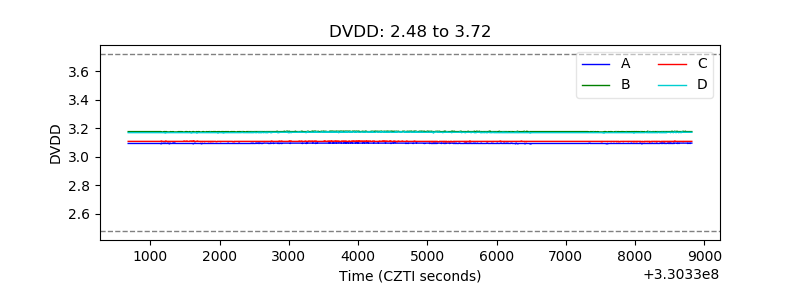 |
| Temperature 1 | 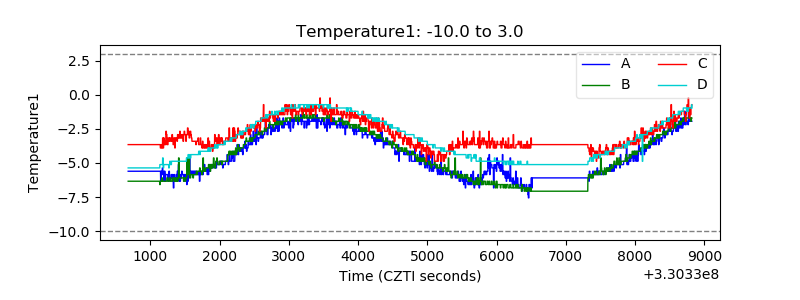 |
| Veto HV Monitor | 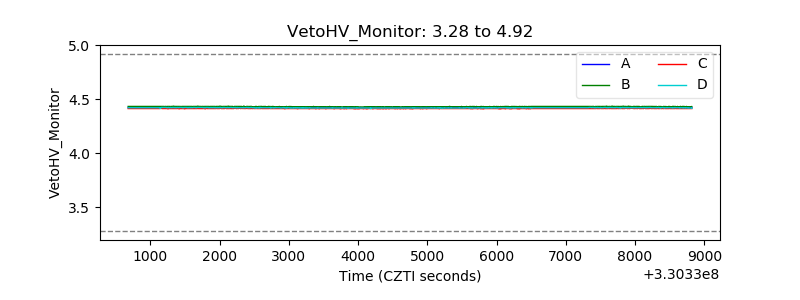 |
| Veto LLD | 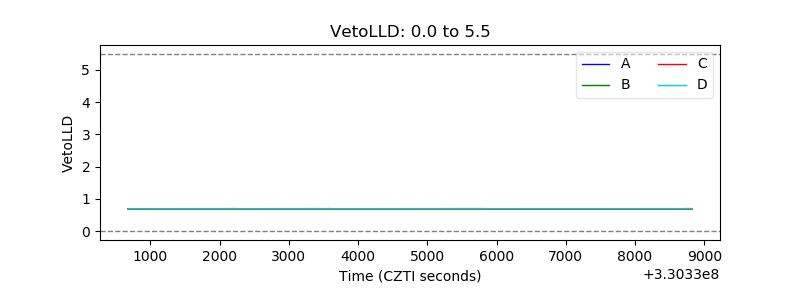 |
| Alpha Counter | 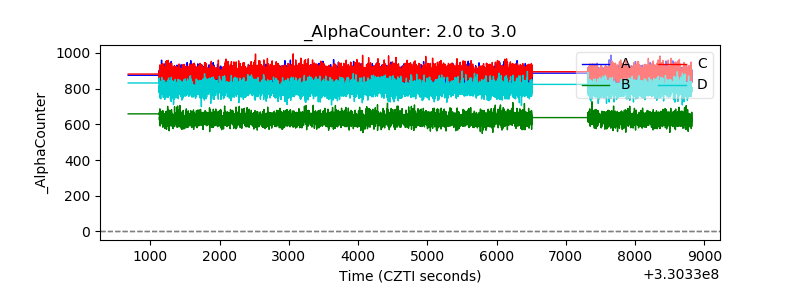 |
| _CPM_Rate | 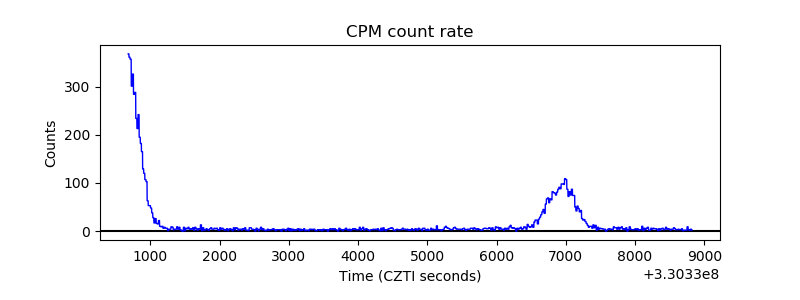 |
| CZT Counter | 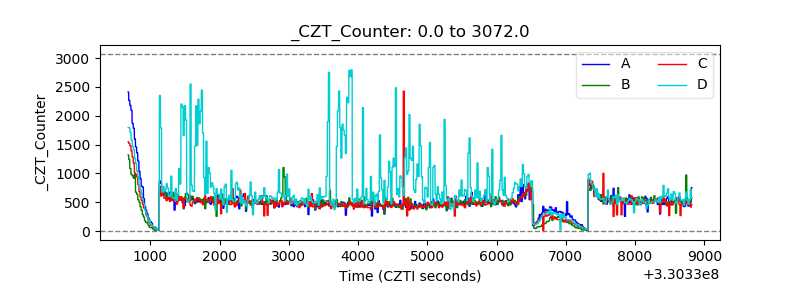 |
| +2.5 Volts monitor |  |
| +5 Volts monitor |  |
| _ROLL_ROT |  |
| _Roll_DEC | 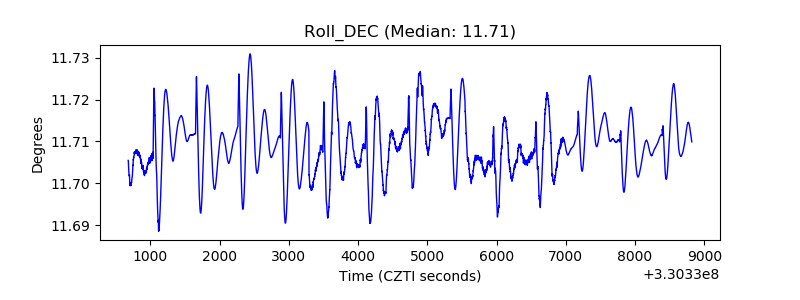 |
| _Roll_RA |  |
| Veto Counter | 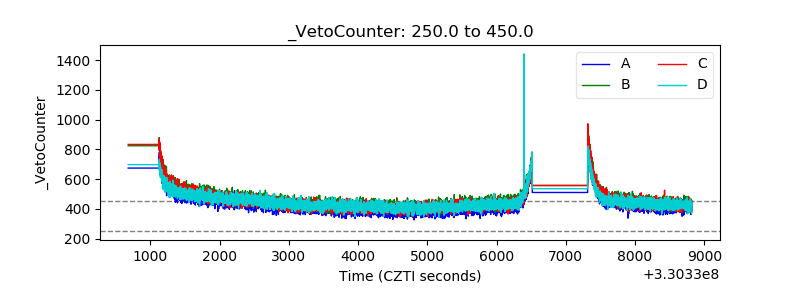 |