| Param | Original file | Final file |
|---|---|---|
| Filename | modeM0/AS1A09_043T02_9000003726_25567cztM0_level2.evt | modeM0/AS1A09_043T02_9000003726_25567cztM0_level2_quad_clean.evt |
| Size (bytes) | 567,642,240 | 101,871,360 |
| Size | 541.3 MB | 97.2 MB |
| Events in quadrant A | 3,621,361 | 664,600 |
| Events in quadrant B | 3,840,429 | 667,342 |
| Events in quadrant C | 3,894,765 | 630,516 |
| Events in quadrant D | 5,338,147 | 613,096 |
| Mode M0 | |||
|---|---|---|---|
| Quadrant | BADHDUFLAG | Total packets | Discarded packets |
| A | 0 | 15355 | 0 |
| B | 0 | 15789 | 0 |
| C | 0 | 16150 | 0 |
| D | 0 | 20882 | 0 |
| Mode M9 | |||
|---|---|---|---|
| Quadrant | BADHDUFLAG | Total packets | Discarded packets |
| A | 0 | 2 | 0 |
| B | 0 | 2 | 0 |
| C | 0 | 2 | 0 |
| D | 0 | 2 | 0 |
| Quadrant | Total seconds | Saturated seconds | Saturation percentage |
|---|---|---|---|
| A | 7320 | 223 | 3.046448% |
| B | 7320 | 242 | 3.306011% |
| C | 7320 | 257 | 3.510929% |
| D | 7320 | 347 | 4.740437% |
Noise dominated data is calculated using 1-second bins in cleaned event files. If a bin has >2000 counts, and if more than 50% of those come from <1% of pixels, then it is considered to be noise-dominated and hence unusable.
| Quadrant | # 1 sec bins | Bins with >0 counts | Bins with >2000 counts | High rate bins dominated by noise | Noise dominated (total time) | Noise dominated (detector-on time) | Marked lightcurve |
|---|---|---|---|---|---|---|---|
| A | 7470 | 7322 | 0 | 0 | 0.00% | 0.00% | 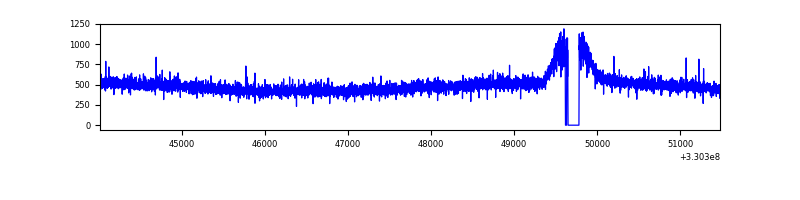 |
| B | 7470 | 7322 | 0 | 0 | 0.00% | 0.00% | 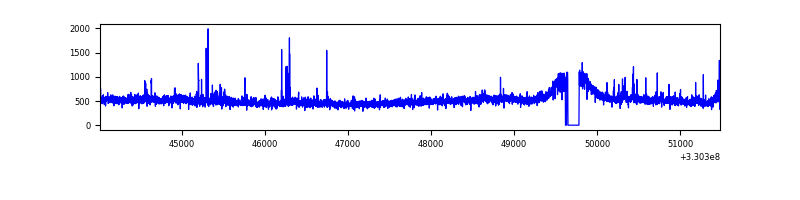 |
| C | 7470 | 7322 | 12 | 12 | 0.16% | 0.16% | 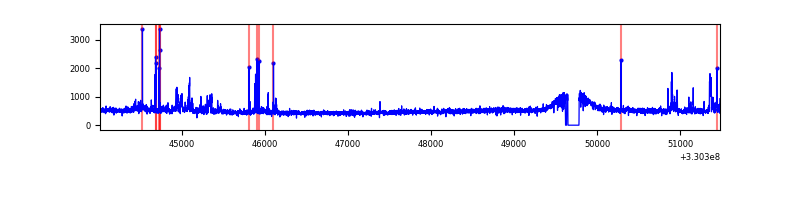 |
| D | 7470 | 7322 | 130 | 130 | 1.74% | 1.78% | 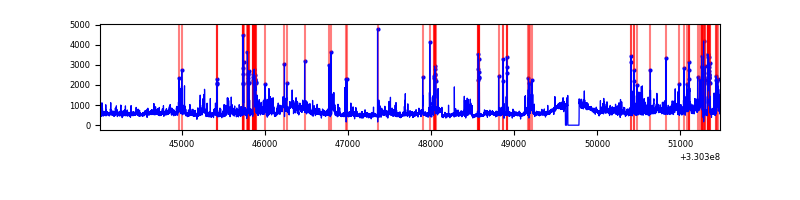 |
Top three noisy pixels from each quadrant. If the there are fewer than three noisy pixels in the level2.evt file, extra rows are filled as -1
| Pixel properties | Quadrant properties | ||||||
|---|---|---|---|---|---|---|---|
| Quadrant | DetID | PixID | Counts | Sigma | Mean | Median | Sigma |
| A | 13 | 254 | 12472 | 60.26 | 937 | 918 | 191.7 |
| A | 3 | 137 | 8827 | 41.25 | 937 | 918 | 191.7 |
| A | 0 | 226 | 8329 | 38.65 | 937 | 918 | 191.7 |
| B | 0 | 219 | 123763 | 684.94 | 924 | 900 | 179.4 |
| B | 12 | 111 | 21952 | 117.36 | 924 | 900 | 179.4 |
| B | 0 | 190 | 21399 | 114.28 | 924 | 900 | 179.4 |
| C | 3 | 233 | 164211 | 775.12 | 886 | 891 | 210.7 |
| C | 14 | 238 | 137745 | 649.52 | 886 | 891 | 210.7 |
| C | 0 | 207 | 132636 | 625.27 | 886 | 891 | 210.7 |
| D | 1 | 52 | 957469 | 4249.13 | 903 | 875 | 225.1 |
| D | 8 | 195 | 595574 | 2641.61 | 903 | 875 | 225.1 |
| D | 7 | 38 | 202265 | 894.56 | 903 | 875 | 225.1 |
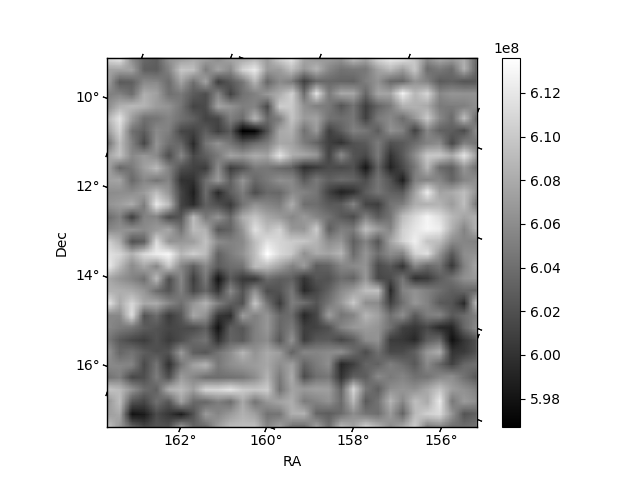
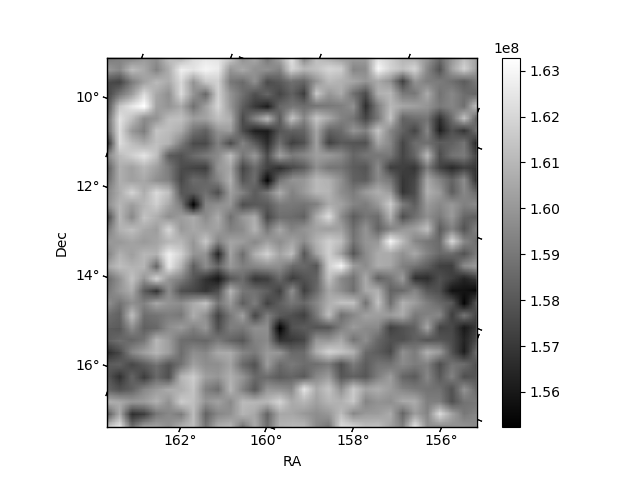
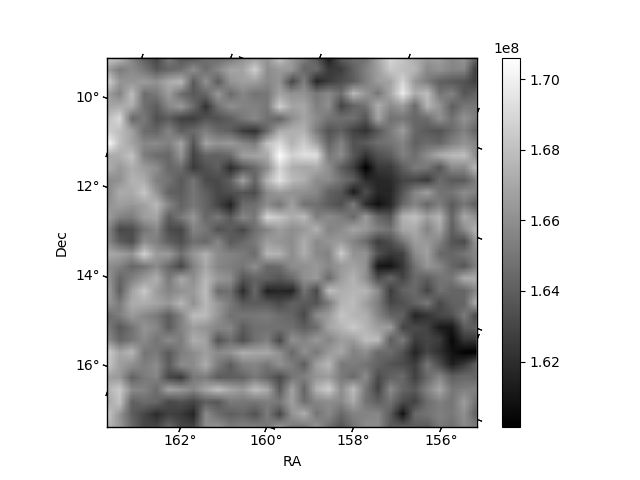
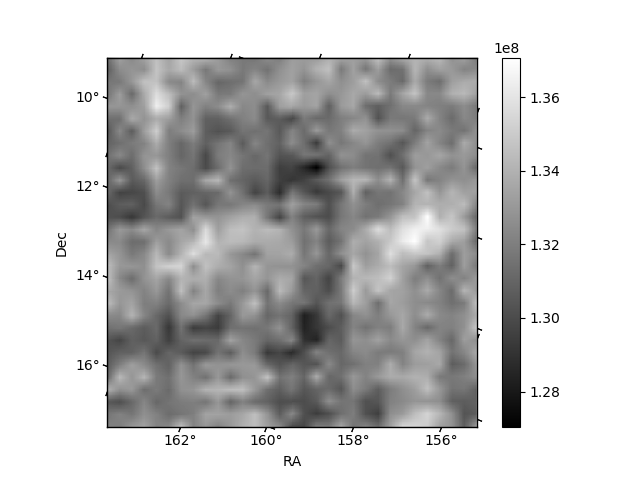
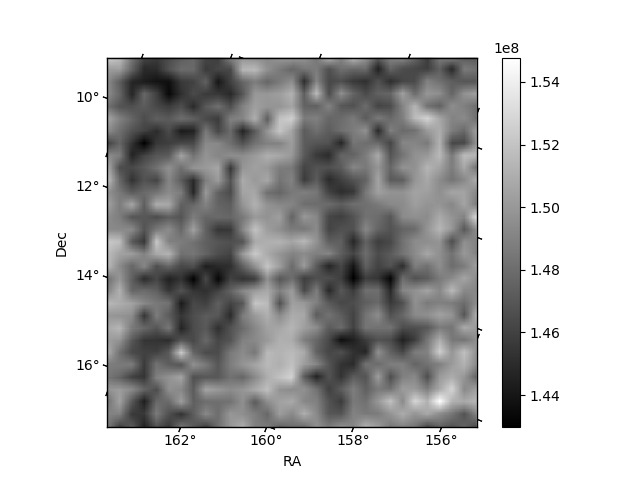
Histogram calculated using DETX and DETY for each event in the final _common_clean file
| Quadrant A | 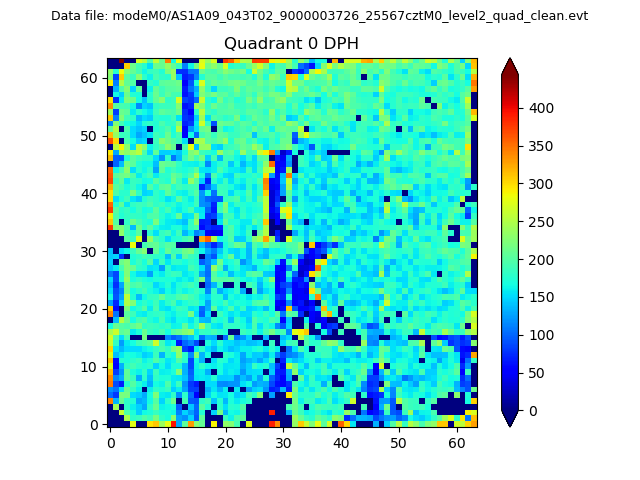 |
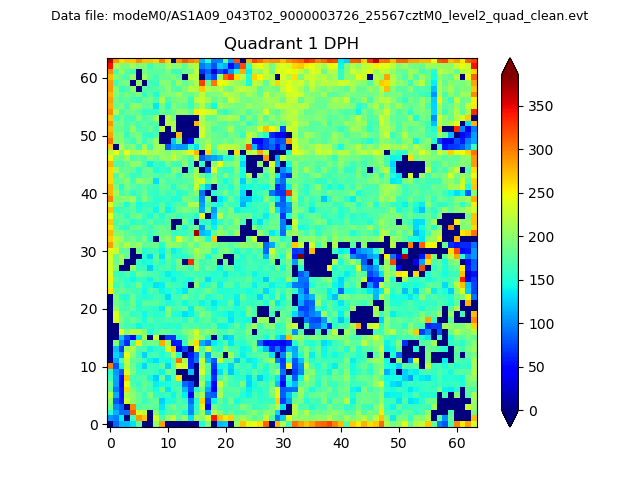 |
Quadrant B |
|---|---|---|---|
| Quadrant D | 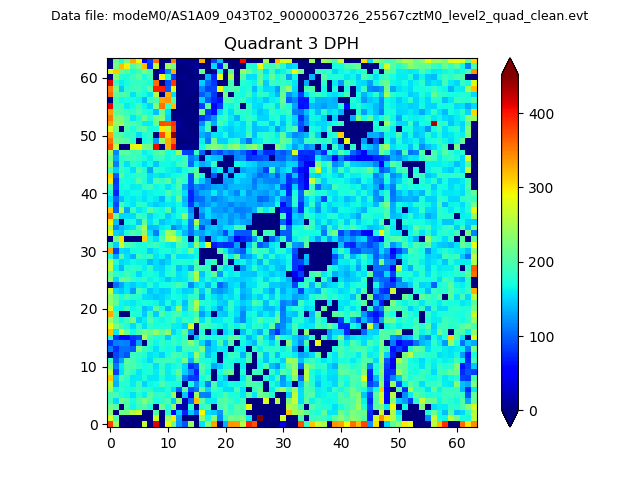 |
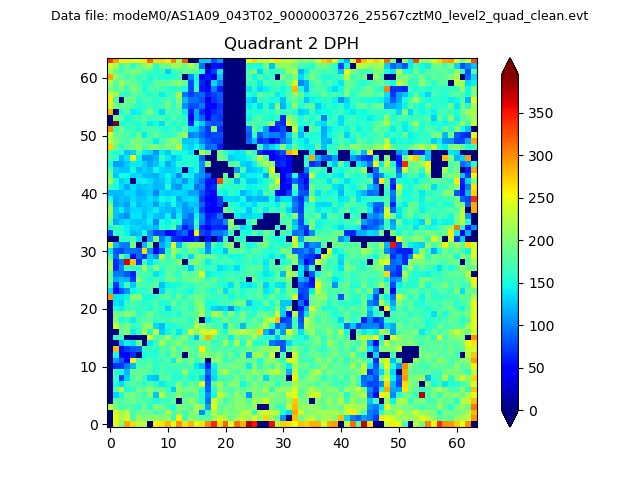 |
Quadrant C |
| Plot type | Count rate plots | Images |
|---|---|---|
| Comparison with Poisson distribution Blue bars denote a histogram of data divided into 1 sec bins. Red curve is a Poisson curve with rate = median count rate of data. |
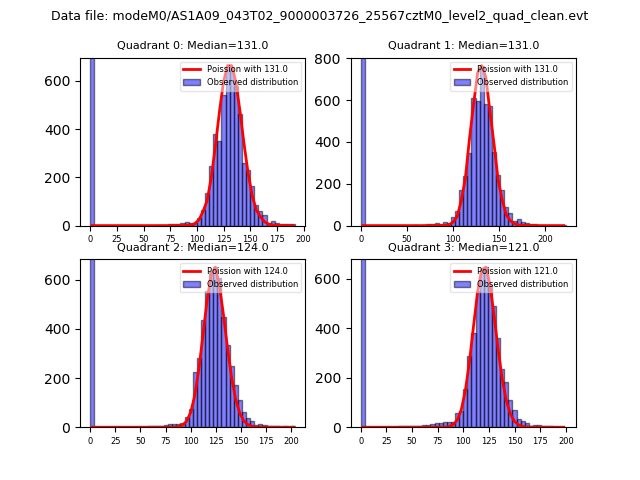 |
 |
| Quadrant-wise count rates Data is divided into 100 sec bins |
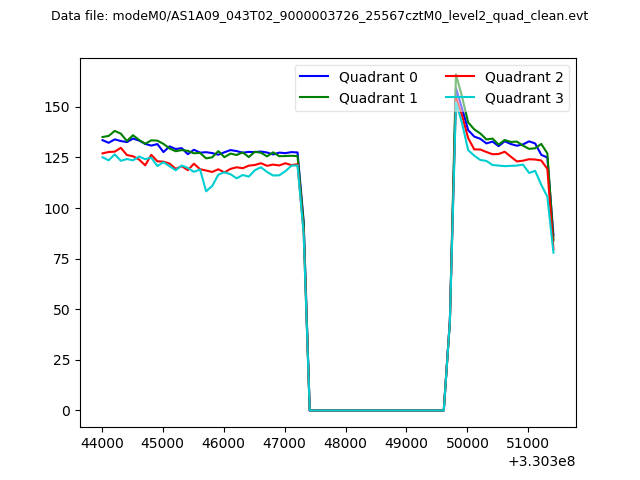 |
|
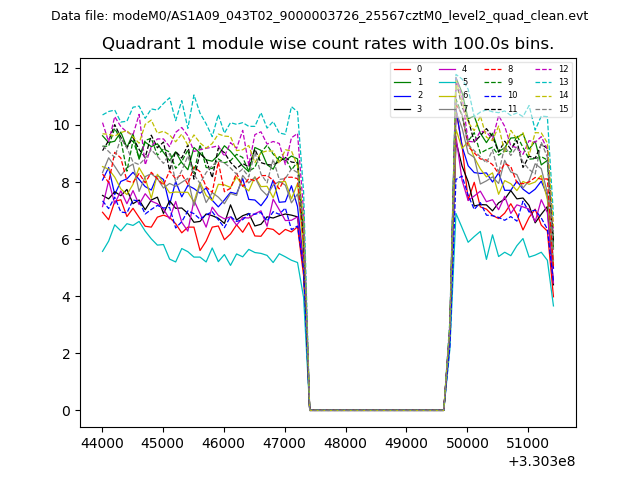
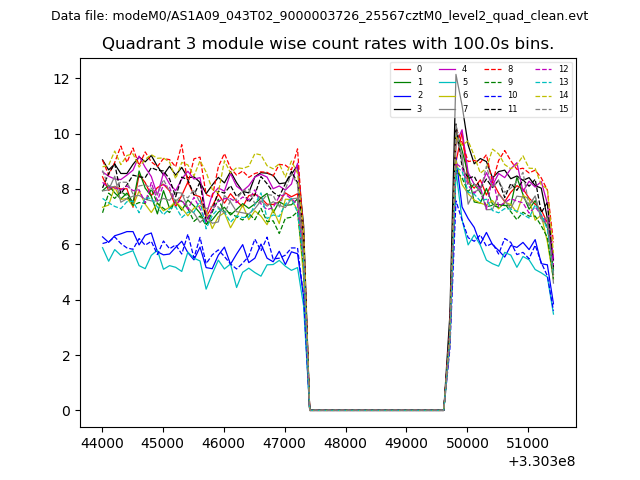
| Module-wise count rates for Quadrant A Data is divided into 100 sec bins |
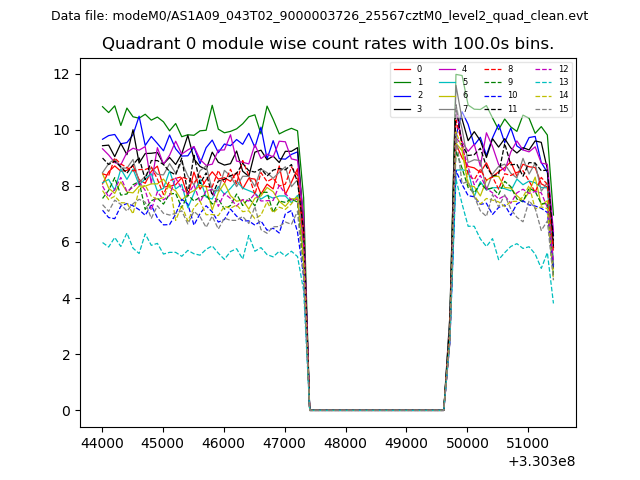 |
 |
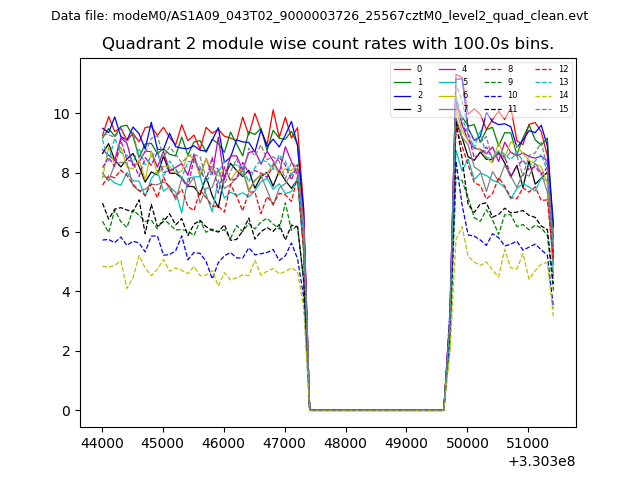
| Module-wise count rates for Quadrant B Data is divided into 100 sec bins |
 |
 |
| Module-wise count rates for Quadrant C Data is divided into 100 sec bins |
 |
 |
| Module-wise count rates for Quadrant D Data is divided into 100 sec bins |
 |
 |
| Parameter | Plot |
|---|---|
| CZT HV Monitor | 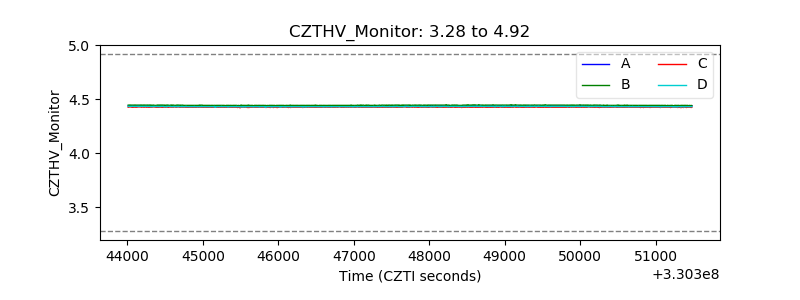 |
| D_VDD | 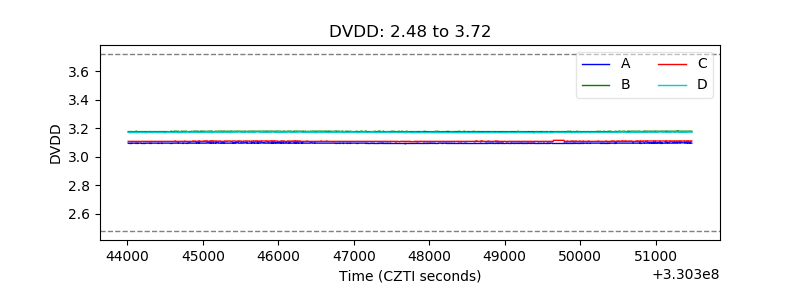 |
| Temperature 1 | 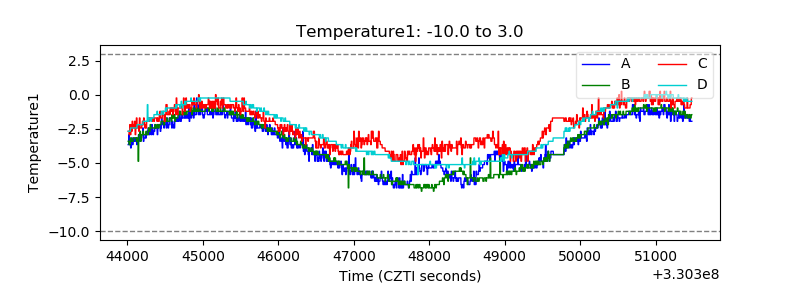 |
| Veto HV Monitor | 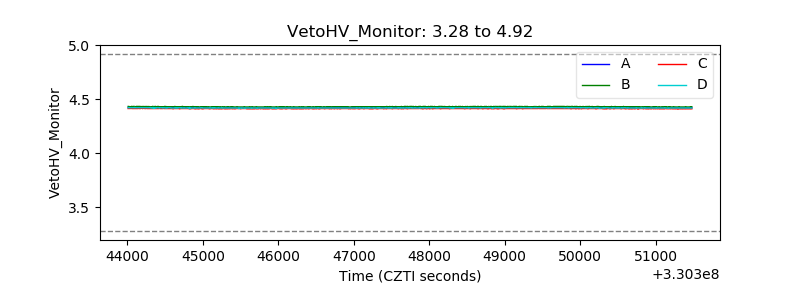 |
| Veto LLD | 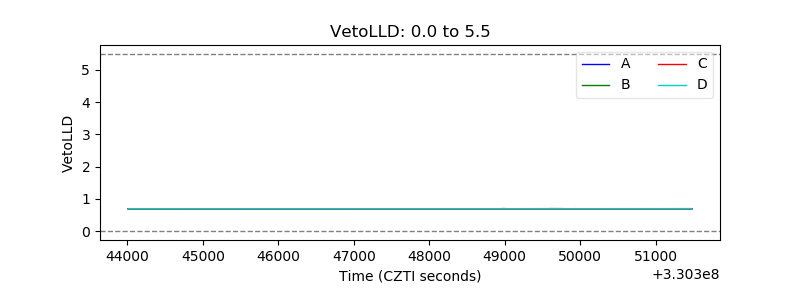 |
| Alpha Counter | 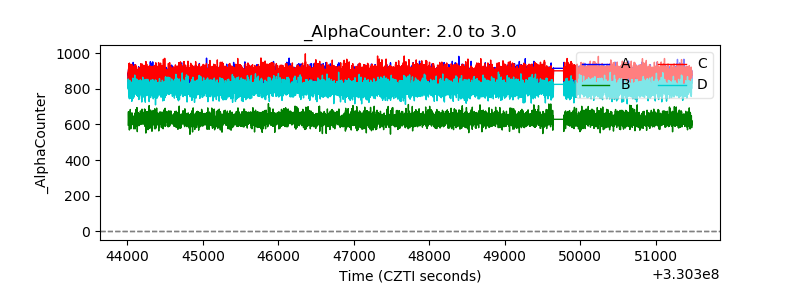 |
| _CPM_Rate | 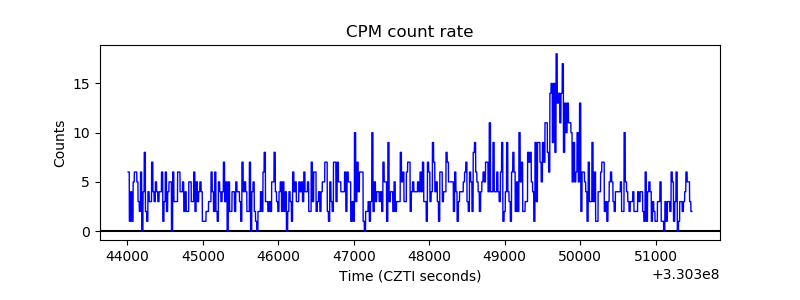 |
| CZT Counter |  |
| +2.5 Volts monitor |  |
| +5 Volts monitor | 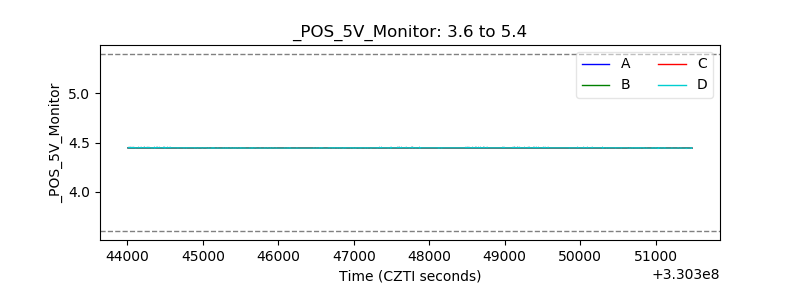 |
| _ROLL_ROT | 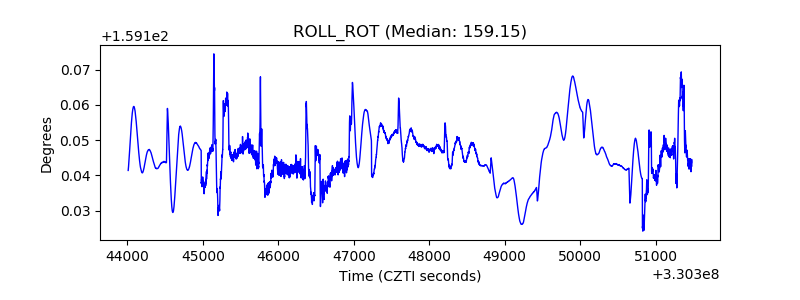 |
| _Roll_DEC | 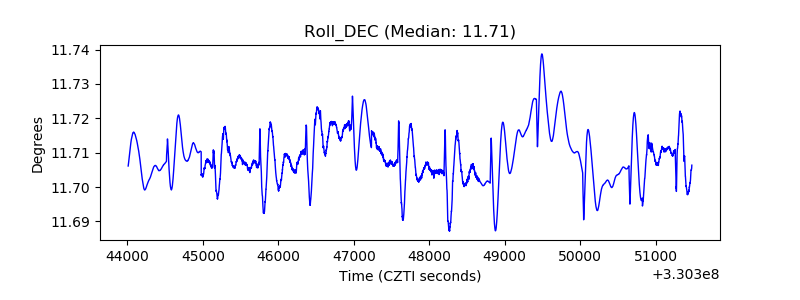 |
| _Roll_RA | 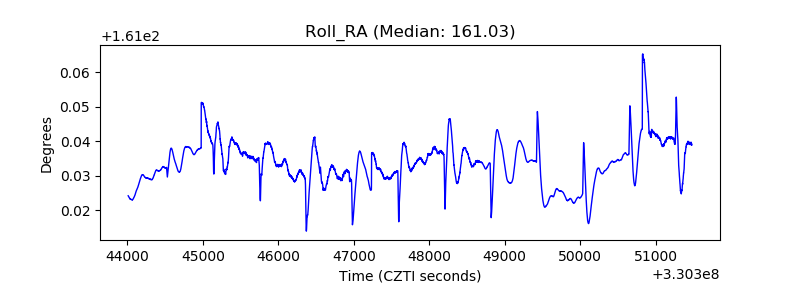 |
| Veto Counter | 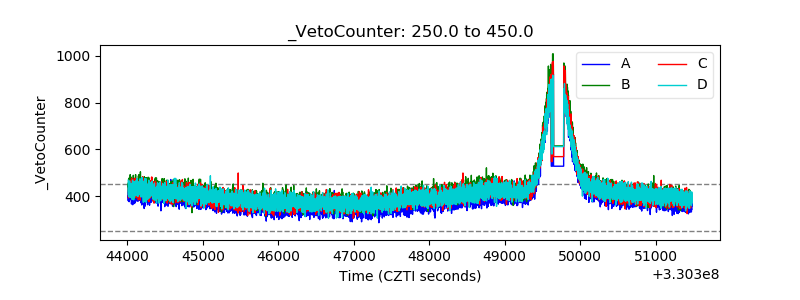 |