| Param | Original file | Final file |
|---|---|---|
| Filename | modeM0/AS1A09_043T02_9000003726_25568cztM0_level2.evt | modeM0/AS1A09_043T02_9000003726_25568cztM0_level2_quad_clean.evt |
| Size (bytes) | 523,897,920 | 91,071,360 |
| Size | 499.6 MB | 86.9 MB |
| Events in quadrant A | 3,296,136 | 588,619 |
| Events in quadrant B | 3,424,980 | 592,566 |
| Events in quadrant C | 3,505,999 | 559,978 |
| Events in quadrant D | 5,176,085 | 541,033 |
| Mode M0 | |||
|---|---|---|---|
| Quadrant | BADHDUFLAG | Total packets | Discarded packets |
| A | 0 | 14178 | 0 |
| B | 0 | 14326 | 0 |
| C | 0 | 14758 | 0 |
| D | 0 | 20015 | 0 |
| Mode M9 | |||
|---|---|---|---|
| Quadrant | BADHDUFLAG | Total packets | Discarded packets |
| A | 0 | 4 | 0 |
| B | 0 | 4 | 0 |
| C | 0 | 4 | 0 |
| D | 0 | 4 | 0 |
| Quadrant | Total seconds | Saturated seconds | Saturation percentage |
|---|---|---|---|
| A | 6827 | 79 | 1.157170% |
| B | 6828 | 98 | 1.435267% |
| C | 6828 | 126 | 1.845343% |
| D | 6828 | 299 | 4.379028% |
Noise dominated data is calculated using 1-second bins in cleaned event files. If a bin has >2000 counts, and if more than 50% of those come from <1% of pixels, then it is considered to be noise-dominated and hence unusable.
| Quadrant | # 1 sec bins | Bins with >0 counts | Bins with >2000 counts | High rate bins dominated by noise | Noise dominated (total time) | Noise dominated (detector-on time) | Marked lightcurve |
|---|---|---|---|---|---|---|---|
| A | 7202 | 6828 | 0 | 0 | 0.00% | 0.00% | 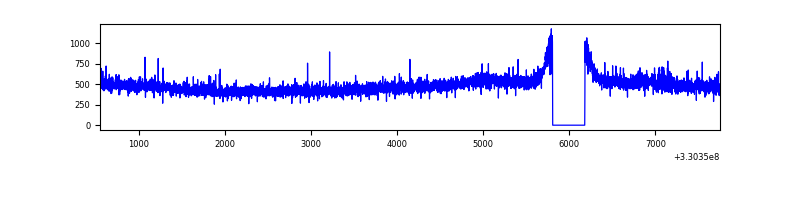 |
| B | 7203 | 6829 | 0 | 0 | 0.00% | 0.00% | 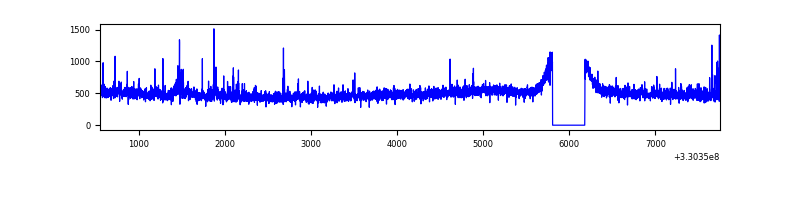 |
| C | 7203 | 6829 | 5 | 5 | 0.07% | 0.07% | 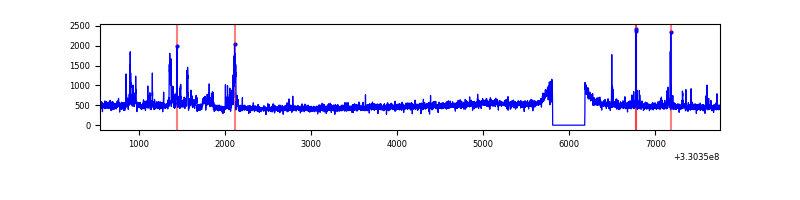 |
| D | 7203 | 6829 | 187 | 187 | 2.60% | 2.74% | 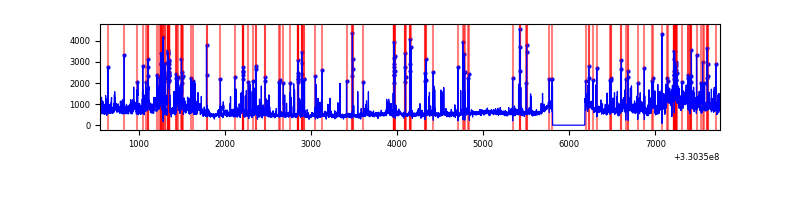 |
Top three noisy pixels from each quadrant. If the there are fewer than three noisy pixels in the level2.evt file, extra rows are filled as -1
| Pixel properties | Quadrant properties | ||||||
|---|---|---|---|---|---|---|---|
| Quadrant | DetID | PixID | Counts | Sigma | Mean | Median | Sigma |
| A | 10 | 17 | 41557 | 235.48 | 843 | 823 | 173.0 |
| A | 13 | 254 | 12049 | 64.9 | 843 | 823 | 173.0 |
| A | 3 | 137 | 7827 | 40.49 | 843 | 823 | 173.0 |
| B | 0 | 219 | 89264 | 551.26 | 833 | 812 | 160.5 |
| B | 0 | 190 | 31806 | 193.17 | 833 | 812 | 160.5 |
| B | 12 | 111 | 19062 | 113.74 | 833 | 812 | 160.5 |
| C | 3 | 233 | 147369 | 778.34 | 801 | 808 | 188.3 |
| C | 14 | 238 | 125200 | 660.6 | 801 | 808 | 188.3 |
| C | 0 | 207 | 104236 | 549.27 | 801 | 808 | 188.3 |
| D | 1 | 52 | 1194084 | 5951.22 | 808 | 785 | 200.5 |
| D | 8 | 195 | 733100 | 3652.2 | 808 | 785 | 200.5 |
| D | 7 | 38 | 70374 | 347.05 | 808 | 785 | 200.5 |
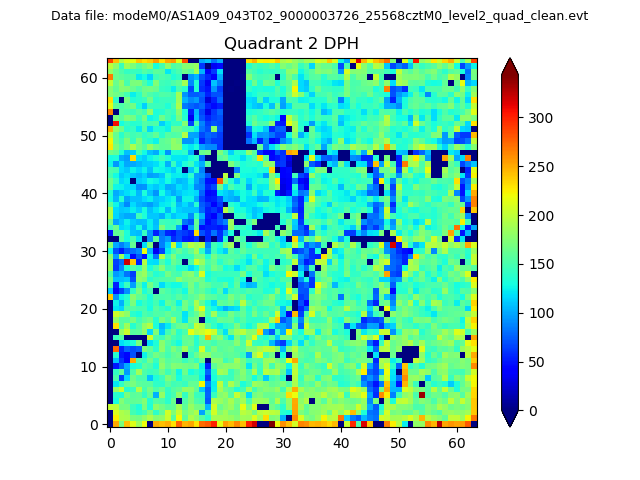
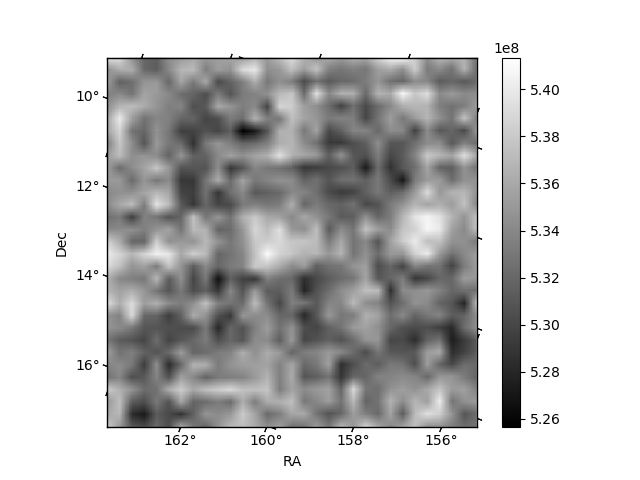
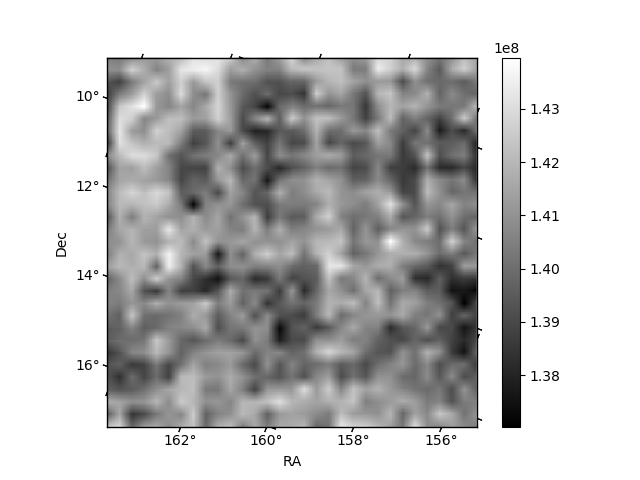
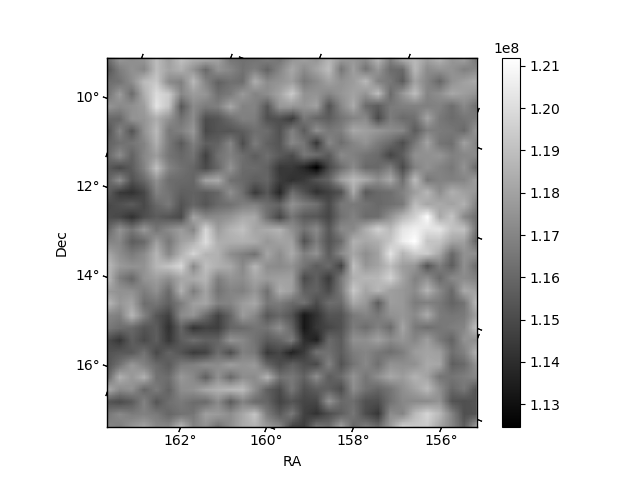
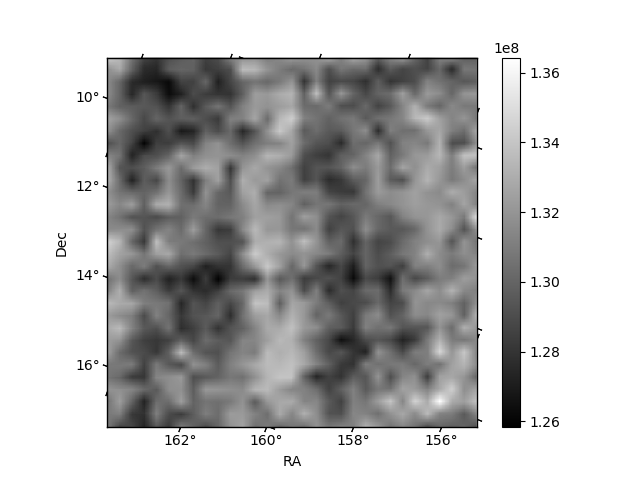
Histogram calculated using DETX and DETY for each event in the final _common_clean file
| Quadrant A | 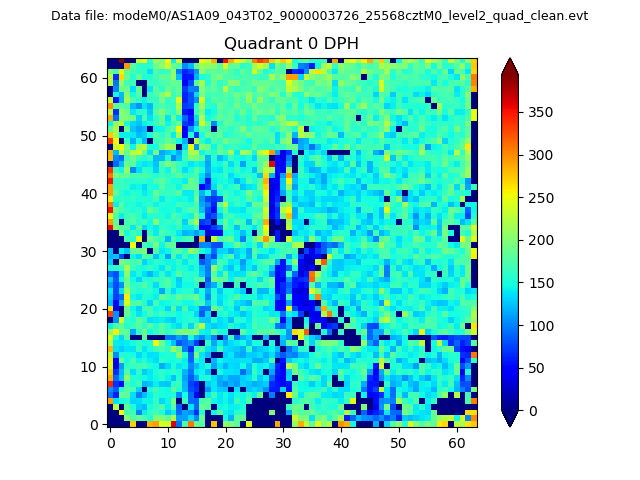 |
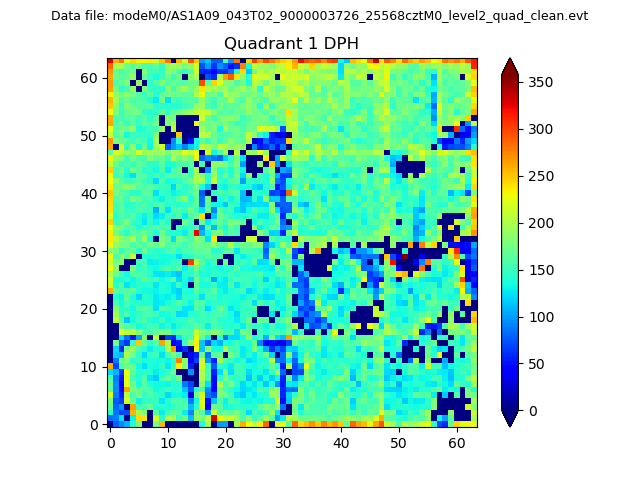 |
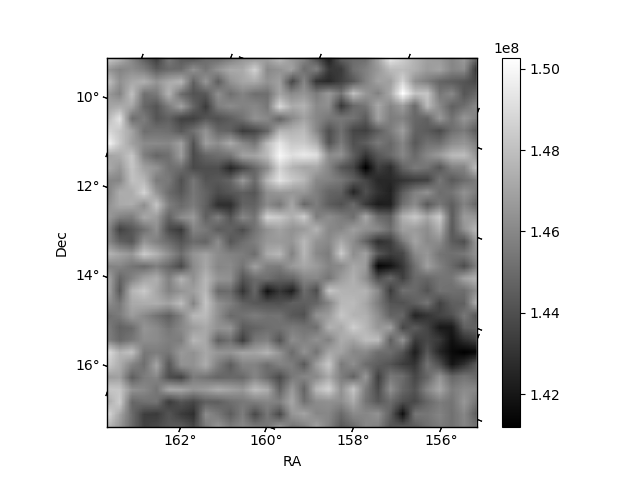
Quadrant B |
|---|---|---|---|
| Quadrant D | 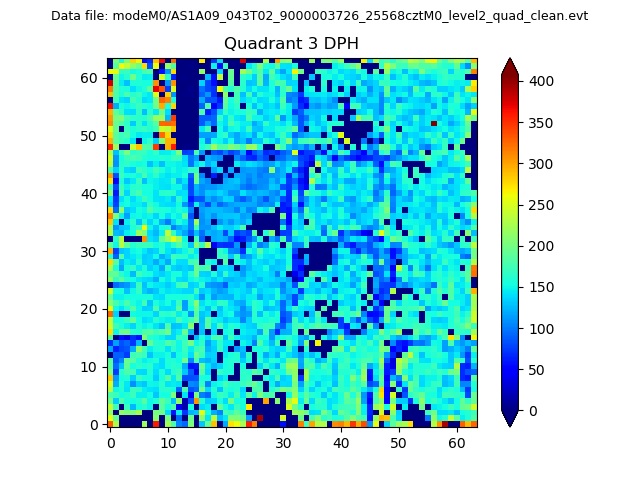 |
 |
Quadrant C |
| Plot type | Count rate plots | Images |
|---|---|---|
| Comparison with Poisson distribution Blue bars denote a histogram of data divided into 1 sec bins. Red curve is a Poisson curve with rate = median count rate of data. |
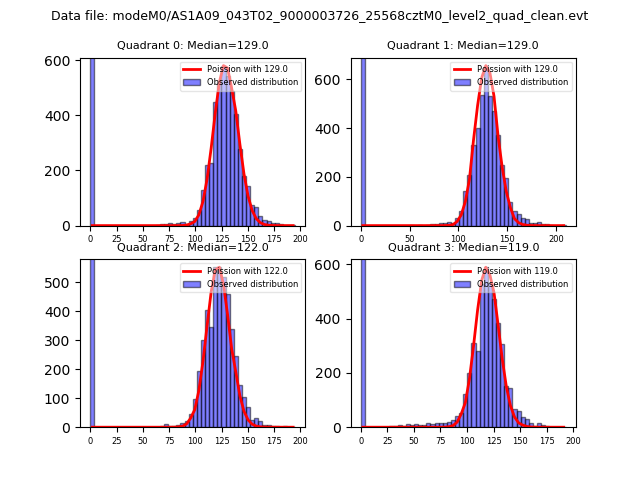 |
 |
| Quadrant-wise count rates Data is divided into 100 sec bins |
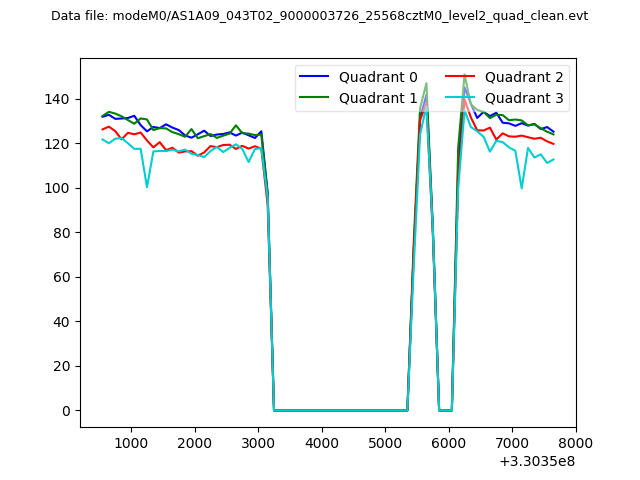 |
|
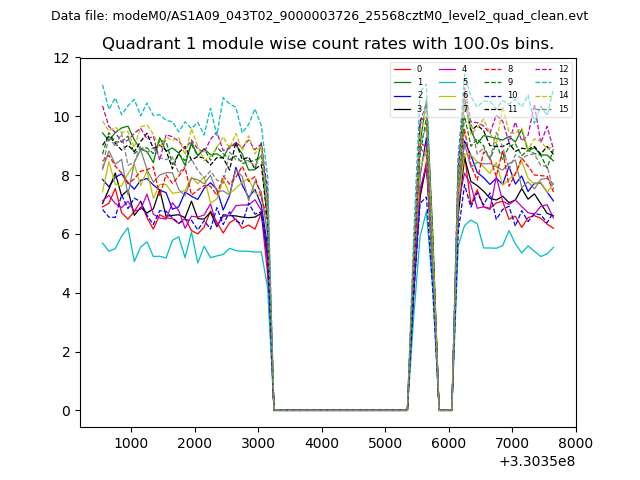
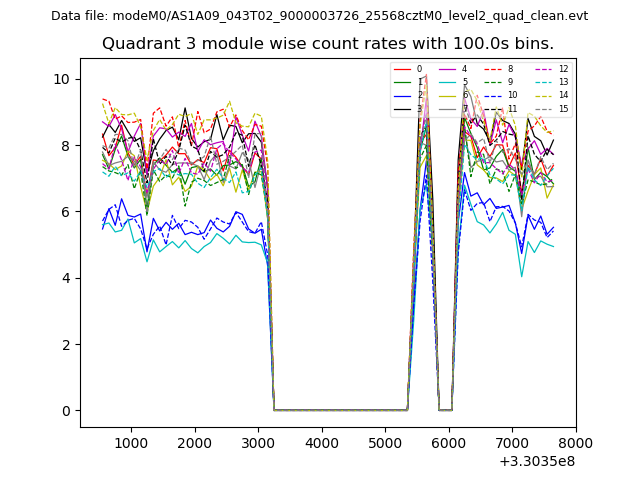
| Module-wise count rates for Quadrant A Data is divided into 100 sec bins |
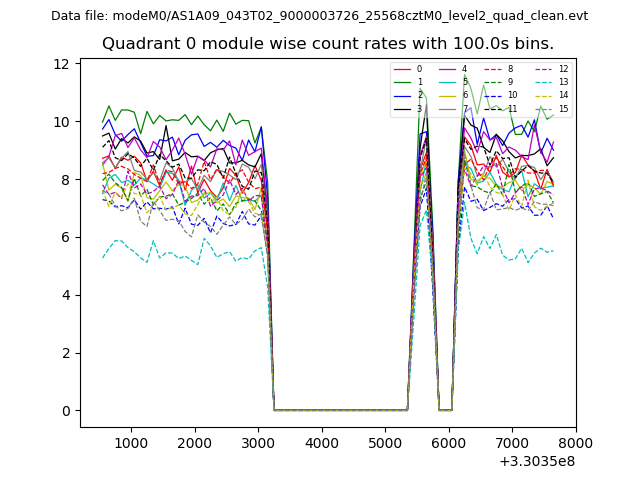 |
 |
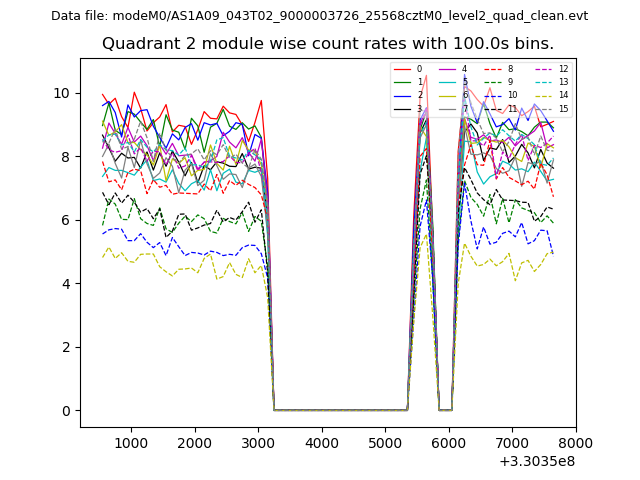
| Module-wise count rates for Quadrant B Data is divided into 100 sec bins |
 |
 |
| Module-wise count rates for Quadrant C Data is divided into 100 sec bins |
 |
 |
| Module-wise count rates for Quadrant D Data is divided into 100 sec bins |
 |
 |
| Parameter | Plot |
|---|---|
| CZT HV Monitor | 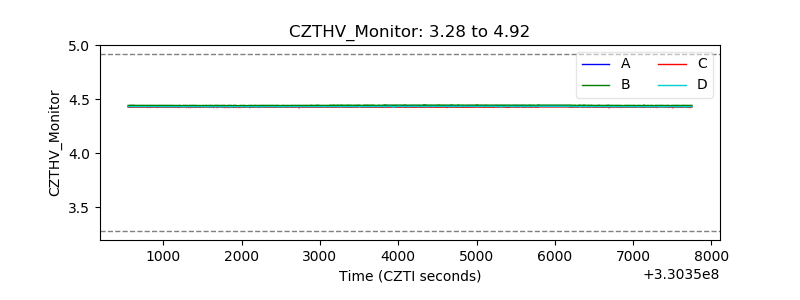 |
| D_VDD | 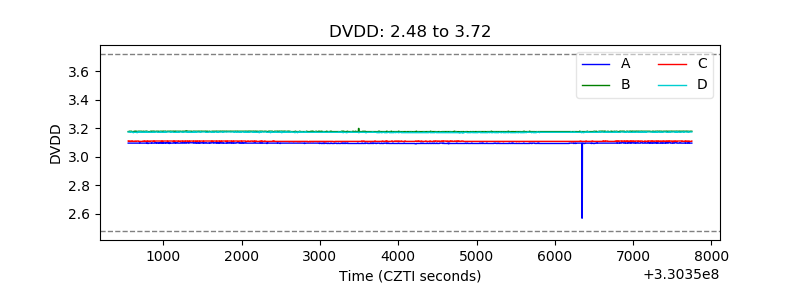 |
| Temperature 1 | 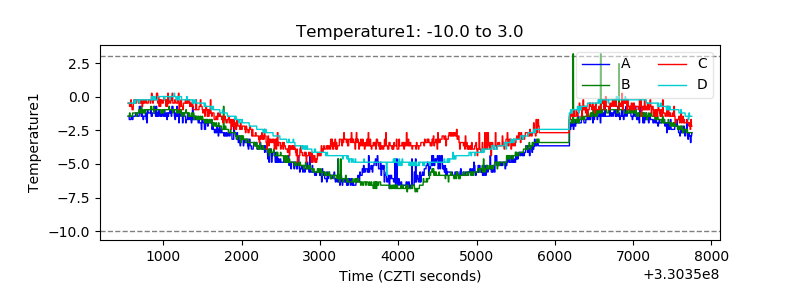 |
| Veto HV Monitor | 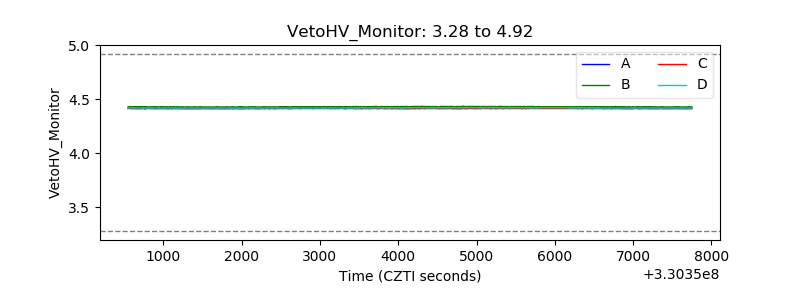 |
| Veto LLD | 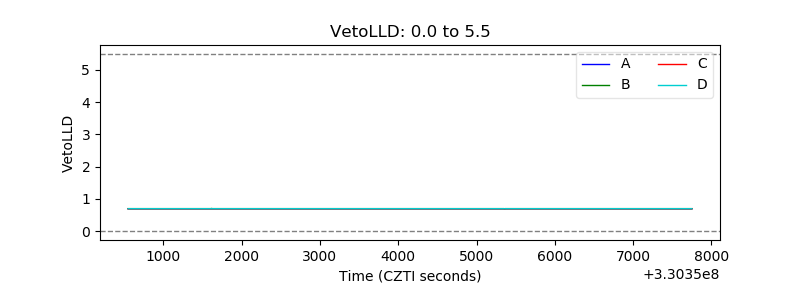 |
| Alpha Counter | 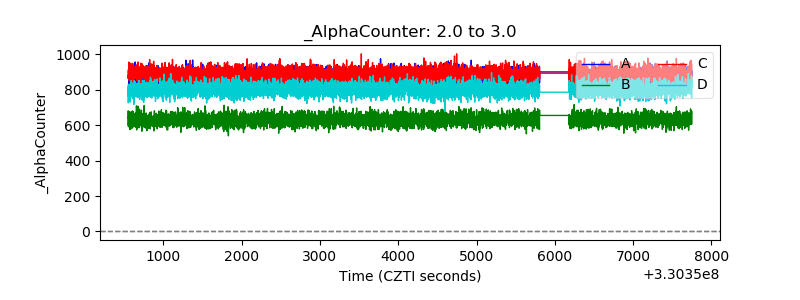 |
| _CPM_Rate | 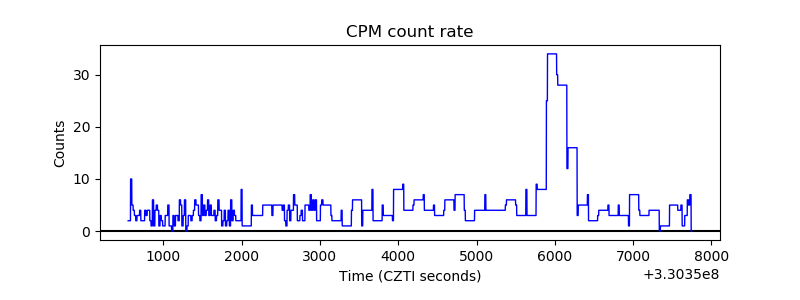 |
| CZT Counter | 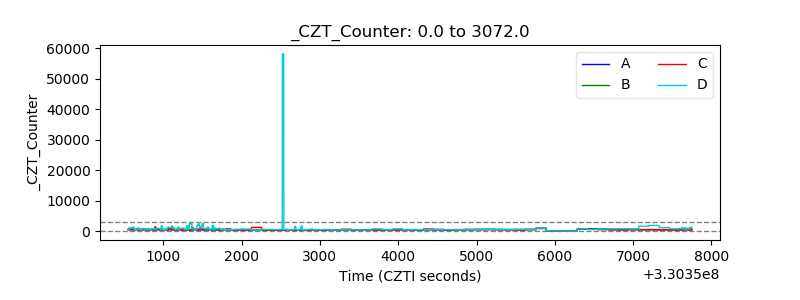 |
| +2.5 Volts monitor |  |
| +5 Volts monitor |  |
| _ROLL_ROT | 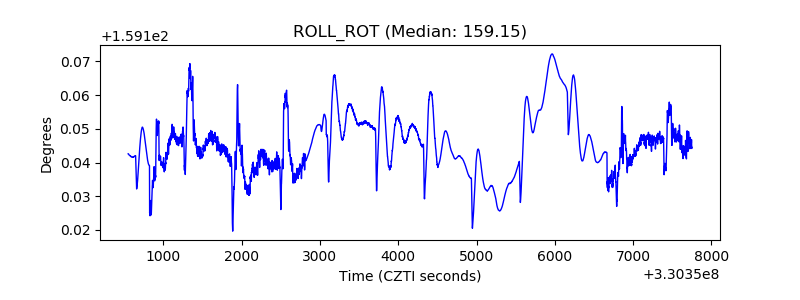 |
| _Roll_DEC | 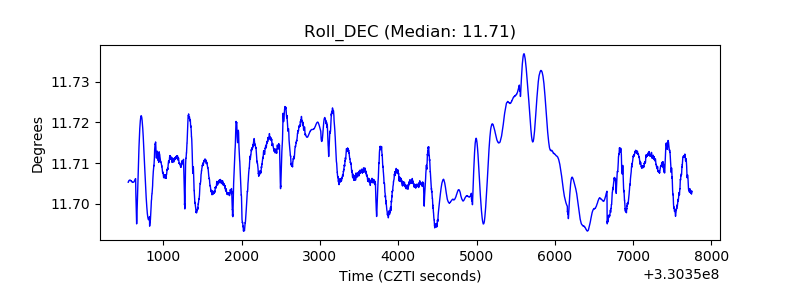 |
| _Roll_RA | 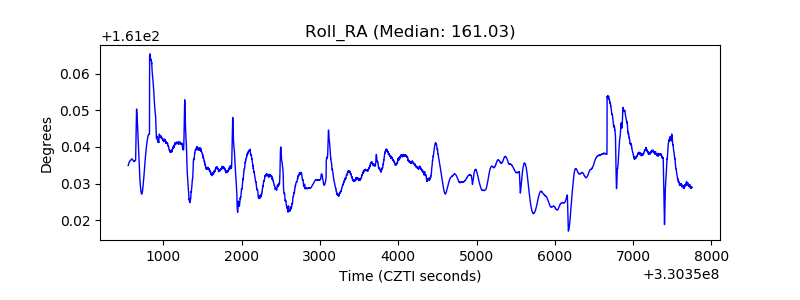 |
| Veto Counter | 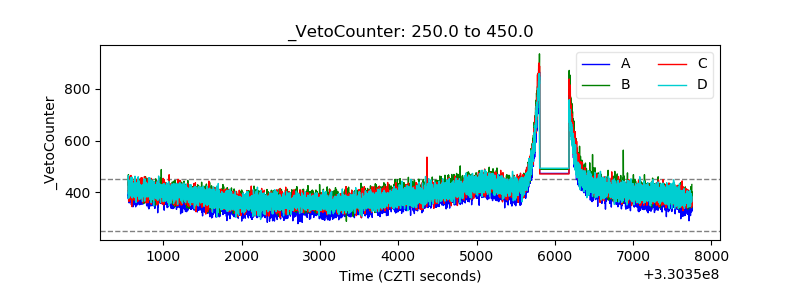 |