| Param | Original file | Final file |
|---|---|---|
| Filename | modeM0/AS1A09_043T02_9000003726_25571cztM0_level2.evt | modeM0/AS1A09_043T02_9000003726_25571cztM0_level2_quad_clean.evt |
| Size (bytes) | 1,361,957,760 | 224,870,400 |
| Size | 1.3 GB | 214.5 MB |
| Events in quadrant A | 8,726,870 | 1,440,867 |
| Events in quadrant B | 9,057,592 | 1,446,093 |
| Events in quadrant C | 8,461,407 | 1,375,811 |
| Events in quadrant D | 13,799,609 | 1,320,459 |
| Mode M0 | |||
|---|---|---|---|
| Quadrant | BADHDUFLAG | Total packets | Discarded packets |
| A | 0 | 37315 | 0 |
| B | 0 | 38011 | 0 |
| C | 0 | 36627 | 0 |
| D | 0 | 53346 | 0 |
| Mode M9 | |||
|---|---|---|---|
| Quadrant | BADHDUFLAG | Total packets | Discarded packets |
| A | 0 | 22 | 0 |
| B | 0 | 22 | 0 |
| C | 0 | 22 | 0 |
| D | 0 | 22 | 0 |
| Quadrant | Total seconds | Saturated seconds | Saturation percentage |
|---|---|---|---|
| A | 17806 | 89 | 0.499832% |
| B | 17807 | 151 | 0.847981% |
| C | 17807 | 155 | 0.870444% |
| D | 17806 | 492 | 2.763114% |
Noise dominated data is calculated using 1-second bins in cleaned event files. If a bin has >2000 counts, and if more than 50% of those come from <1% of pixels, then it is considered to be noise-dominated and hence unusable.
| Quadrant | # 1 sec bins | Bins with >0 counts | Bins with >2000 counts | High rate bins dominated by noise | Noise dominated (total time) | Noise dominated (detector-on time) | Marked lightcurve |
|---|---|---|---|---|---|---|---|
| A | 19987 | 17810 | 0 | 0 | 0.00% | 0.00% | 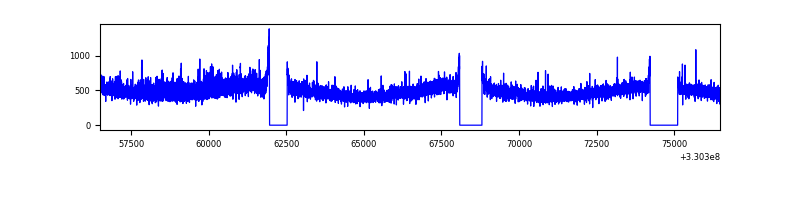 |
| B | 19988 | 17811 | 11 | 11 | 0.06% | 0.06% | 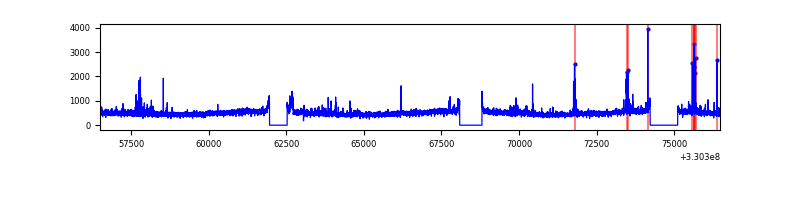 |
| C | 19988 | 17811 | 3 | 3 | 0.02% | 0.02% | 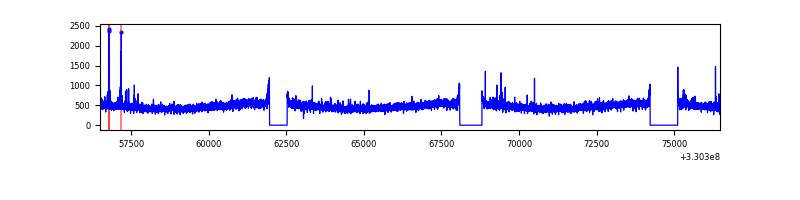 |
| D | 19987 | 17810 | 280 | 280 | 1.40% | 1.57% | 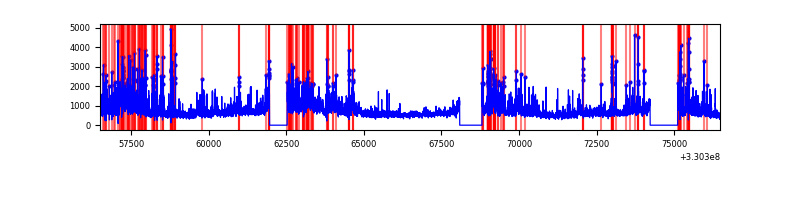 |
Top three noisy pixels from each quadrant. If the there are fewer than three noisy pixels in the level2.evt file, extra rows are filled as -1
| Pixel properties | Quadrant properties | ||||||
|---|---|---|---|---|---|---|---|
| Quadrant | DetID | PixID | Counts | Sigma | Mean | Median | Sigma |
| A | 10 | 17 | 314122 | 716.19 | 2160 | 2113 | 435.6 |
| A | 6 | 16 | 79088 | 176.69 | 2160 | 2113 | 435.6 |
| A | 13 | 254 | 31682 | 67.87 | 2160 | 2113 | 435.6 |
| B | 0 | 219 | 256723 | 622.18 | 2147 | 2092 | 409.3 |
| B | 0 | 190 | 135792 | 326.69 | 2147 | 2092 | 409.3 |
| B | 15 | 33 | 67519 | 159.87 | 2147 | 2092 | 409.3 |
| C | 14 | 238 | 325089 | 668.23 | 2060 | 2076 | 483.4 |
| C | 3 | 233 | 49386 | 97.87 | 2060 | 2076 | 483.4 |
| C | 0 | 207 | 46983 | 92.9 | 2060 | 2076 | 483.4 |
| D | 8 | 195 | 3340227 | 6571.73 | 2073 | 2015 | 508.0 |
| D | 1 | 52 | 2367538 | 4656.86 | 2073 | 2015 | 508.0 |
| D | 10 | 33 | 94136 | 181.35 | 2073 | 2015 | 508.0 |
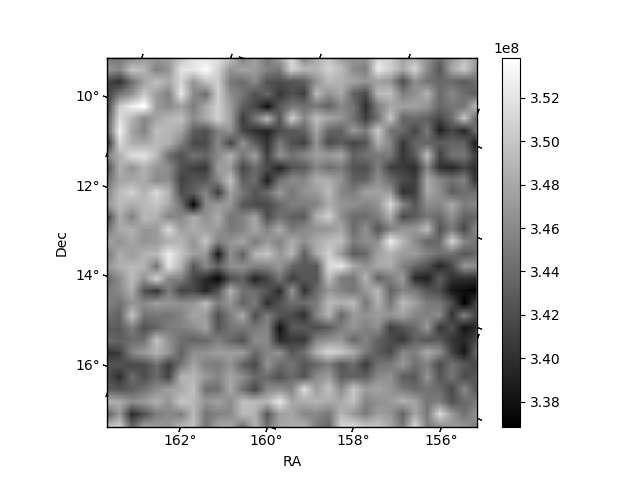
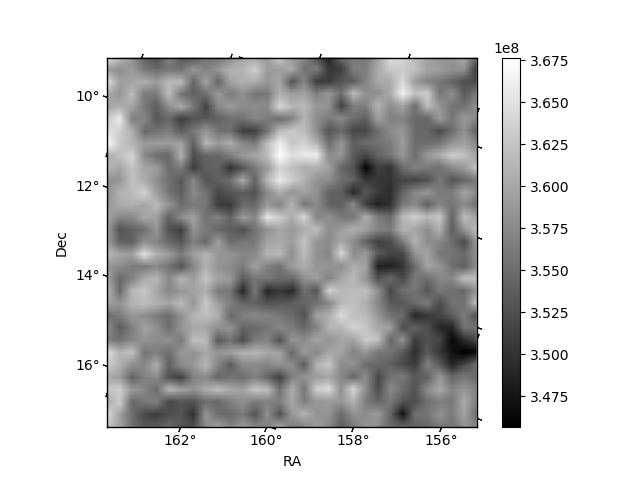
Histogram calculated using DETX and DETY for each event in the final _common_clean file
| Quadrant A | 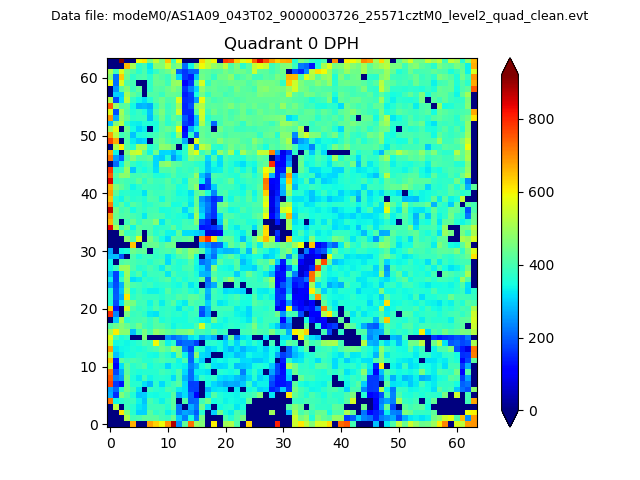 |
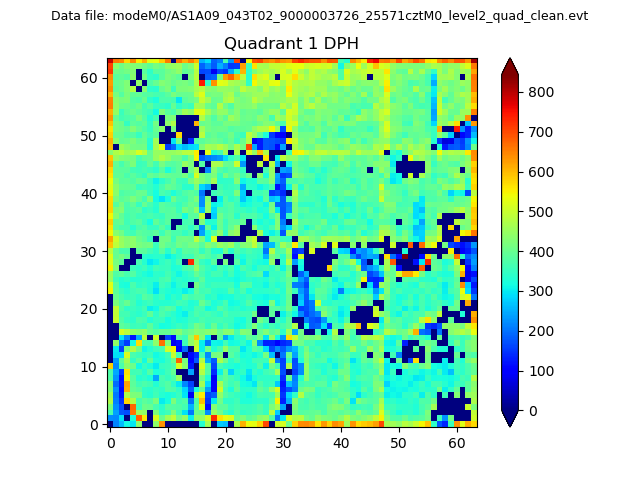 |
Quadrant B |
|---|---|---|---|
| Quadrant D |  |
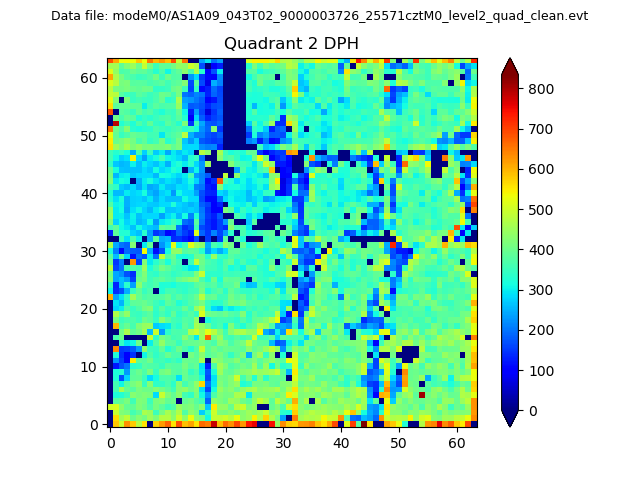 |
Quadrant C |
| Plot type | Count rate plots | Images |
|---|---|---|
| Comparison with Poisson distribution Blue bars denote a histogram of data divided into 1 sec bins. Red curve is a Poisson curve with rate = median count rate of data. |
 |
 |
| Quadrant-wise count rates Data is divided into 100 sec bins |
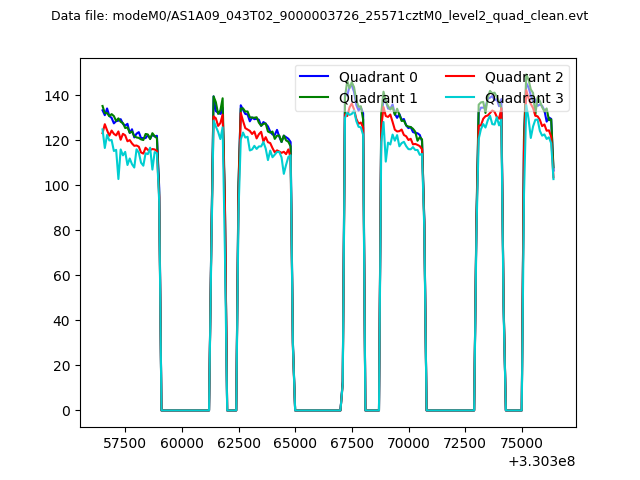 |
|
| Module-wise count rates for Quadrant A Data is divided into 100 sec bins |
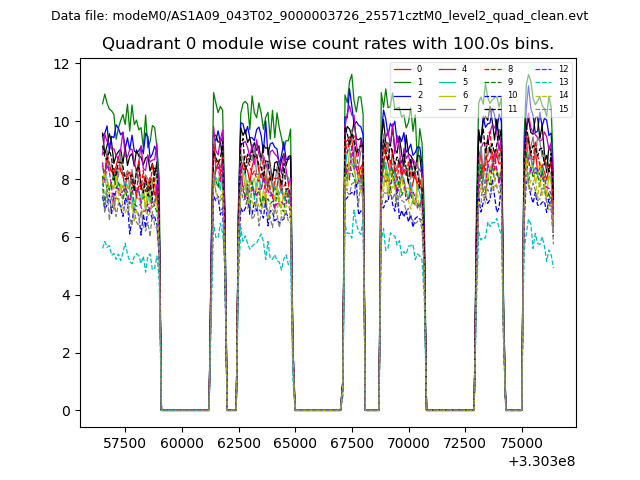 |
 |
| Module-wise count rates for Quadrant B Data is divided into 100 sec bins |
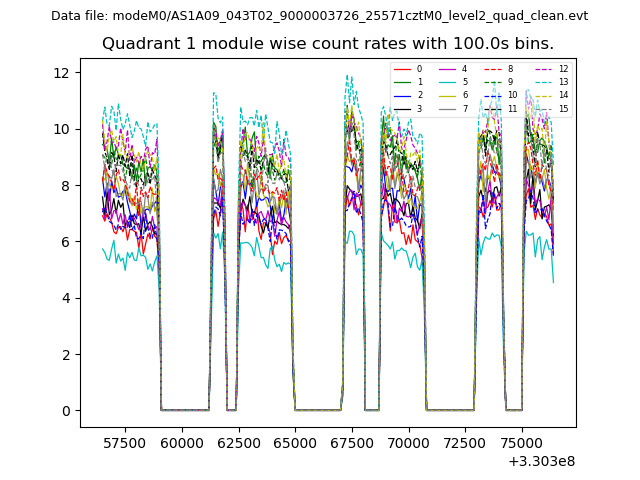 |
 |
| Module-wise count rates for Quadrant C Data is divided into 100 sec bins |
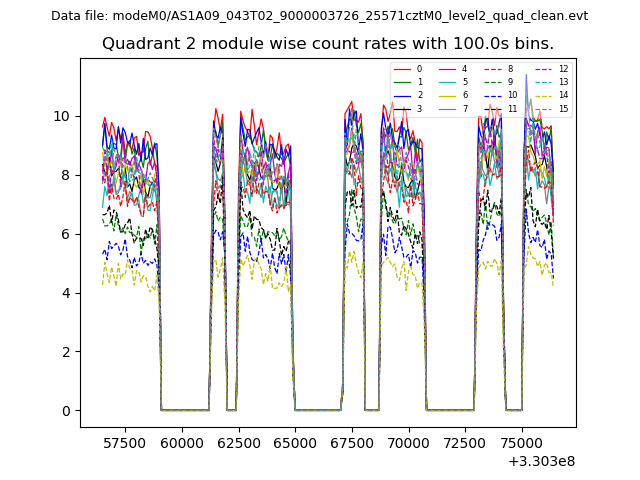 |
 |
| Module-wise count rates for Quadrant D Data is divided into 100 sec bins |
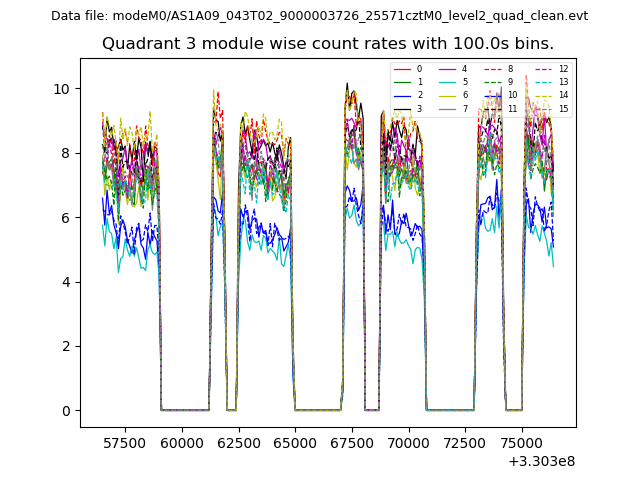 |
 |
| Parameter | Plot |
|---|---|
| CZT HV Monitor | 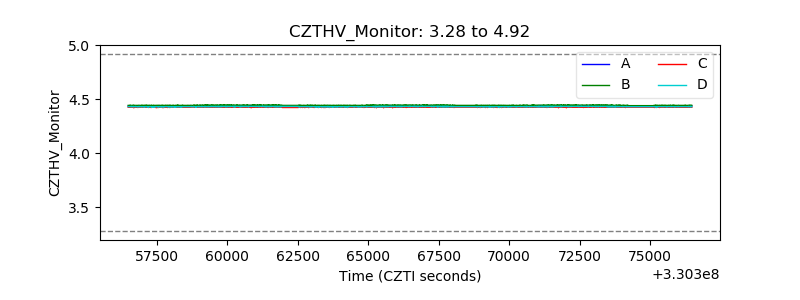 |
| D_VDD | 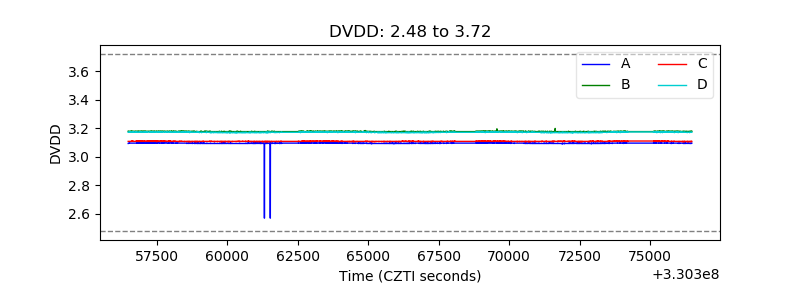 |
| Temperature 1 | 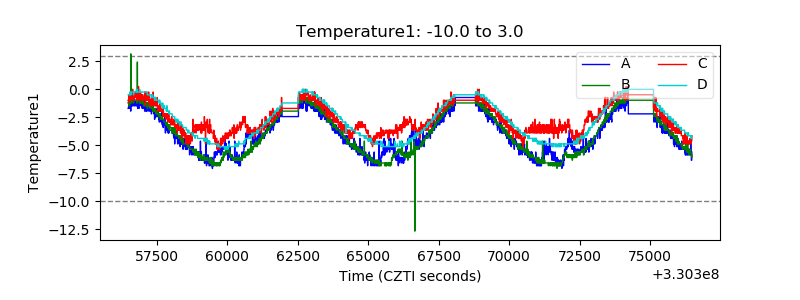 |
| Veto HV Monitor | 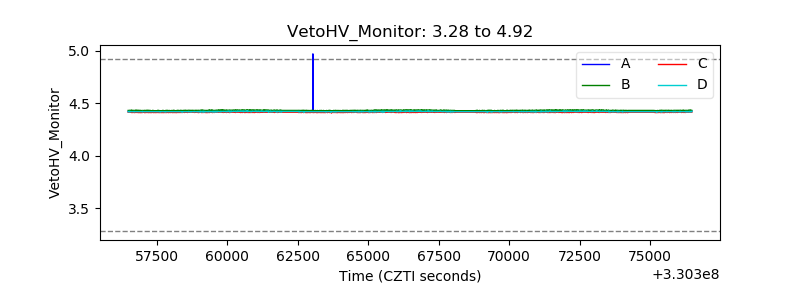 |
| Veto LLD | 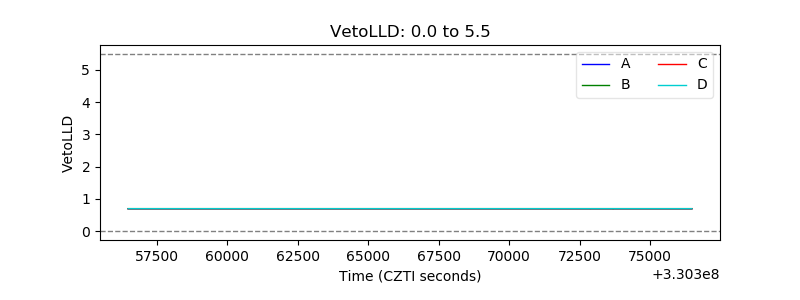 |
| Alpha Counter | 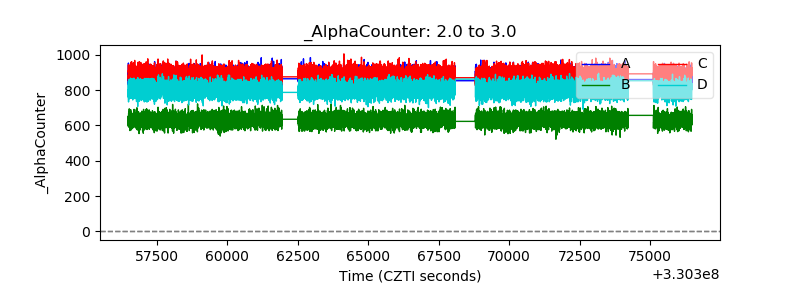 |
| _CPM_Rate | 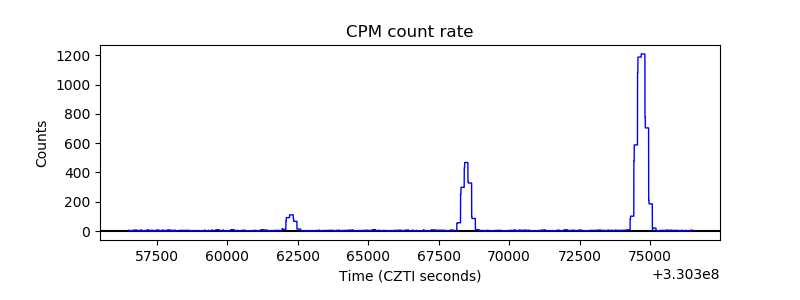 |
| CZT Counter |  |
| +2.5 Volts monitor |  |
| +5 Volts monitor | 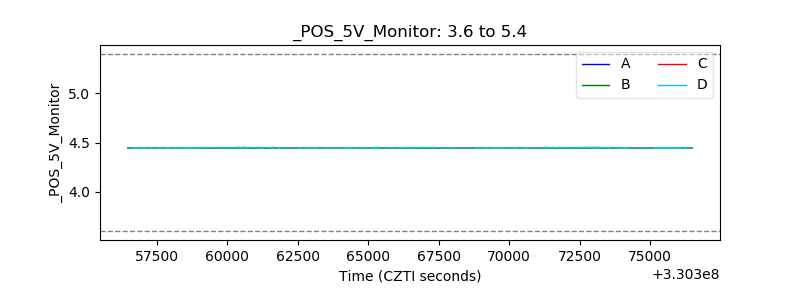 |
| _ROLL_ROT |  |
| _Roll_DEC |  |
| _Roll_RA |  |
| Veto Counter | 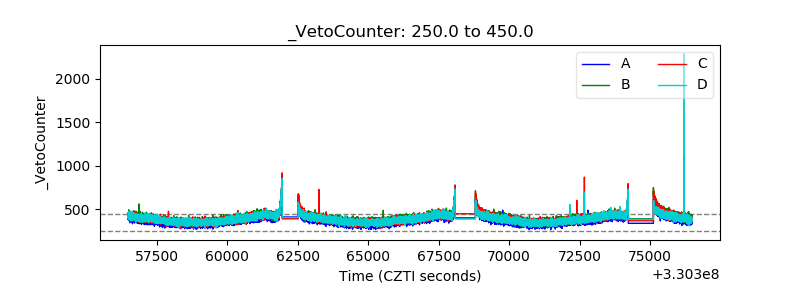 |