| Param | Original file | Final file |
|---|---|---|
| Filename | modeM0/AS1A09_043T02_9000003726_25572cztM0_level2.evt | modeM0/AS1A09_043T02_9000003726_25572cztM0_level2_quad_clean.evt |
| Size (bytes) | 468,262,080 | 83,721,600 |
| Size | 446.6 MB | 79.8 MB |
| Events in quadrant A | 3,082,846 | 538,600 |
| Events in quadrant B | 3,301,778 | 547,475 |
| Events in quadrant C | 3,071,386 | 512,433 |
| Events in quadrant D | 4,294,603 | 494,049 |
| Mode M0 | |||
|---|---|---|---|
| Quadrant | BADHDUFLAG | Total packets | Discarded packets |
| A | 0 | 13002 | 0 |
| B | 0 | 13706 | 0 |
| C | 0 | 13045 | 0 |
| D | 0 | 17021 | 0 |
| Mode M9 | |||
|---|---|---|---|
| Quadrant | BADHDUFLAG | Total packets | Discarded packets |
| A | 0 | 11 | 0 |
| B | 0 | 11 | 0 |
| C | 0 | 11 | 0 |
| D | 0 | 11 | 0 |
| Quadrant | Total seconds | Saturated seconds | Saturation percentage |
|---|---|---|---|
| A | 6347 | 21 | 0.330865% |
| B | 6348 | 32 | 0.504096% |
| C | 6348 | 55 | 0.866415% |
| D | 6348 | 156 | 2.457467% |
Noise dominated data is calculated using 1-second bins in cleaned event files. If a bin has >2000 counts, and if more than 50% of those come from <1% of pixels, then it is considered to be noise-dominated and hence unusable.
| Quadrant | # 1 sec bins | Bins with >0 counts | Bins with >2000 counts | High rate bins dominated by noise | Noise dominated (total time) | Noise dominated (detector-on time) | Marked lightcurve |
|---|---|---|---|---|---|---|---|
| A | 7392 | 6348 | 3 | 3 | 0.04% | 0.05% | 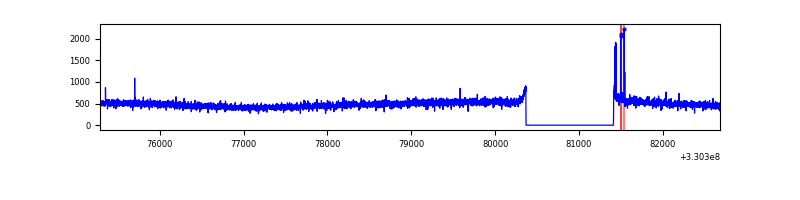 |
| B | 7393 | 6349 | 7 | 7 | 0.09% | 0.11% | 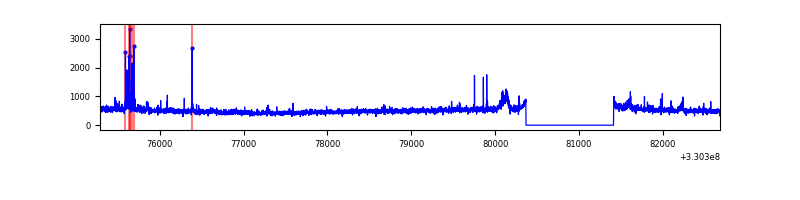 |
| C | 7393 | 6349 | 0 | 0 | 0.00% | 0.00% | 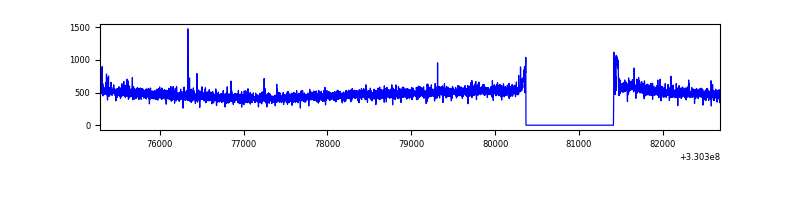 |
| D | 7393 | 6349 | 111 | 111 | 1.50% | 1.75% | 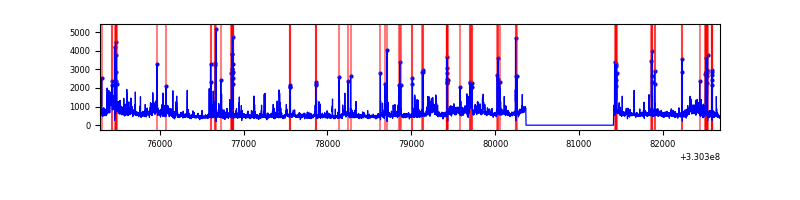 |
Top three noisy pixels from each quadrant. If the there are fewer than three noisy pixels in the level2.evt file, extra rows are filled as -1
| Pixel properties | Quadrant properties | ||||||
|---|---|---|---|---|---|---|---|
| Quadrant | DetID | PixID | Counts | Sigma | Mean | Median | Sigma |
| A | 10 | 17 | 27540 | 169.8 | 784 | 770 | 157.7 |
| A | 6 | 16 | 17578 | 106.61 | 784 | 770 | 157.7 |
| A | 15 | 173 | 15456 | 93.15 | 784 | 770 | 157.7 |
| B | 0 | 219 | 70440 | 467.94 | 784 | 765 | 148.9 |
| B | 15 | 33 | 50391 | 333.29 | 784 | 765 | 148.9 |
| B | 5 | 172 | 44800 | 295.74 | 784 | 765 | 148.9 |
| C | 14 | 238 | 120232 | 672.25 | 747 | 751 | 177.7 |
| C | 3 | 233 | 26545 | 145.12 | 747 | 751 | 177.7 |
| C | 1 | 90 | 9904 | 51.5 | 747 | 751 | 177.7 |
| D | 1 | 52 | 998407 | 5455.5 | 745 | 722 | 182.9 |
| D | 8 | 195 | 430186 | 2348.38 | 745 | 722 | 182.9 |
| D | 2 | 234 | 27251 | 145.06 | 745 | 722 | 182.9 |
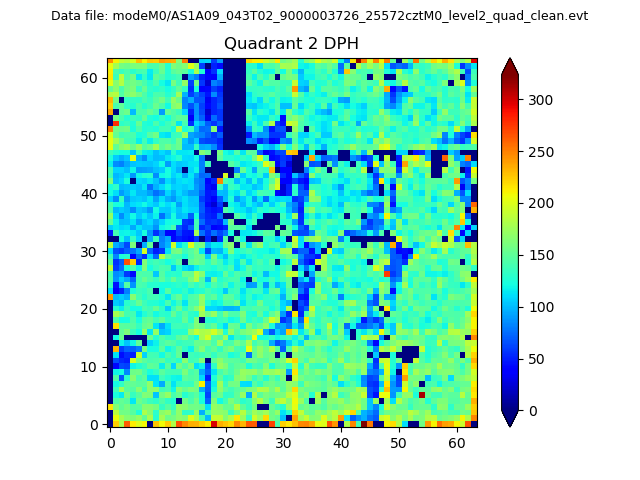
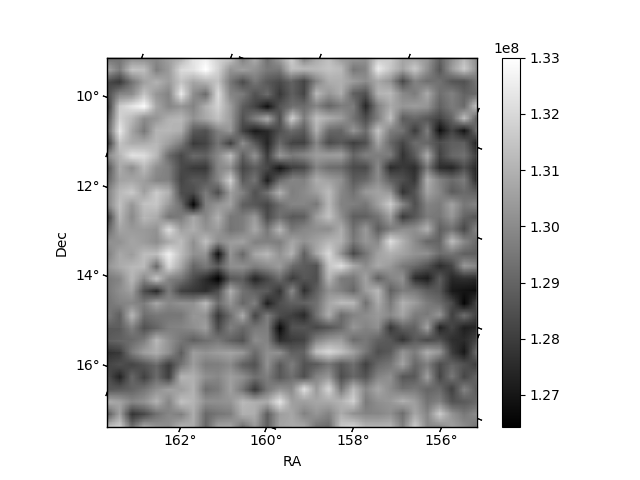
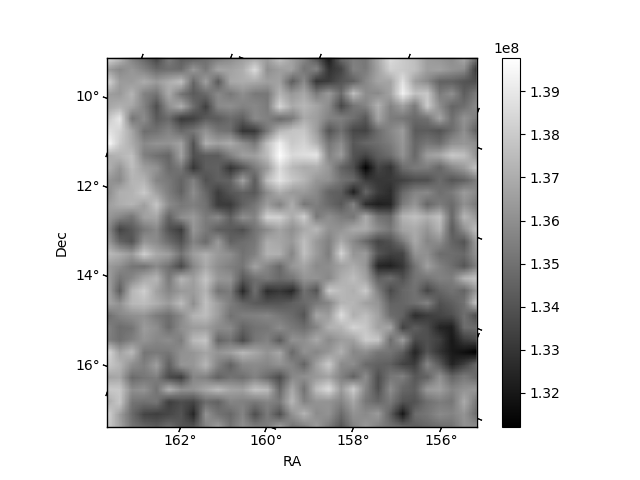
Histogram calculated using DETX and DETY for each event in the final _common_clean file
| Quadrant A | 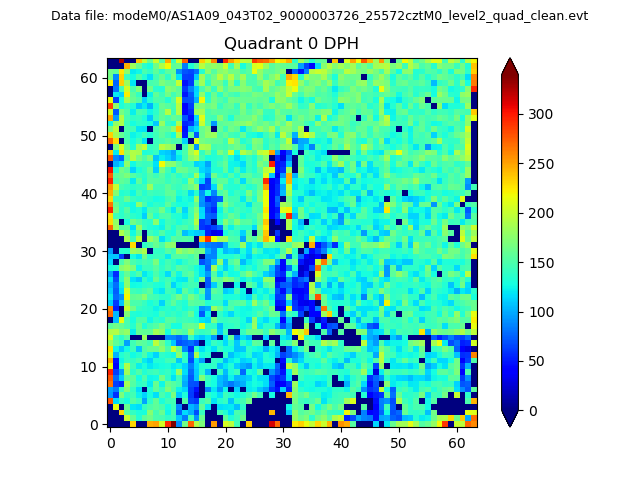 |
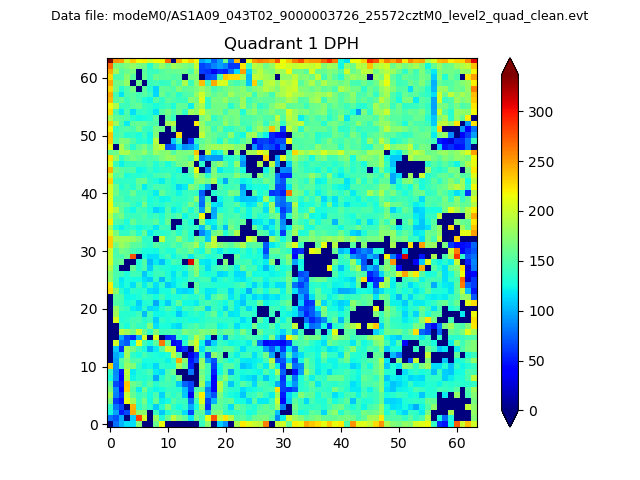 |
Quadrant B |
|---|---|---|---|
| Quadrant D | 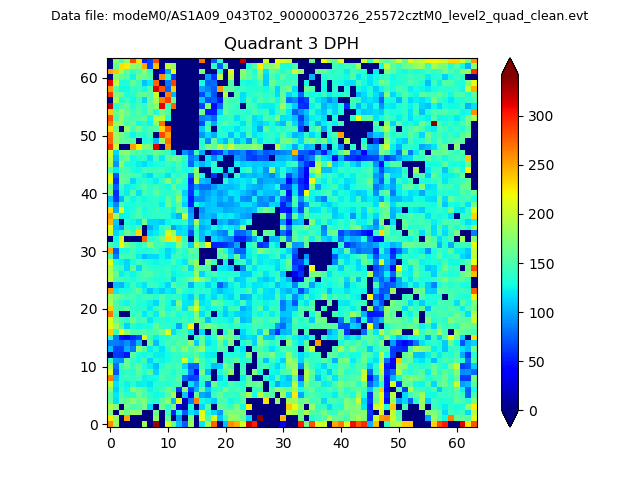 |
 |
Quadrant C |
| Plot type | Count rate plots | Images |
|---|---|---|
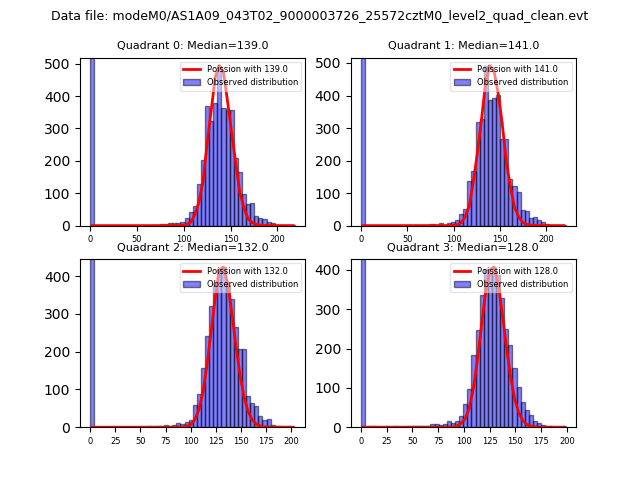
| Comparison with Poisson distribution Blue bars denote a histogram of data divided into 1 sec bins. Red curve is a Poisson curve with rate = median count rate of data. |
 |
 |
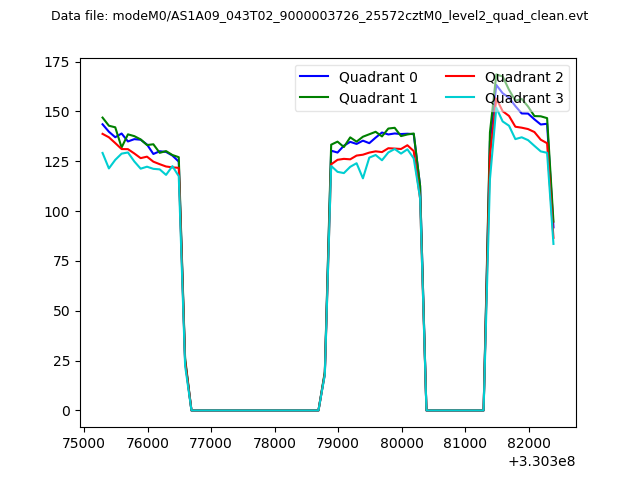
| Quadrant-wise count rates Data is divided into 100 sec bins |
 |
|
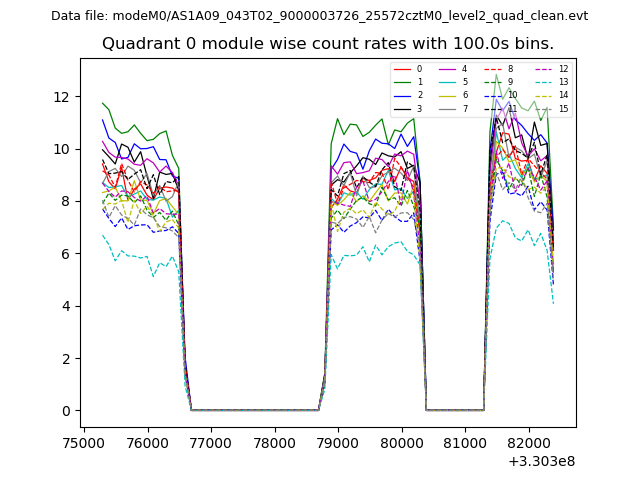
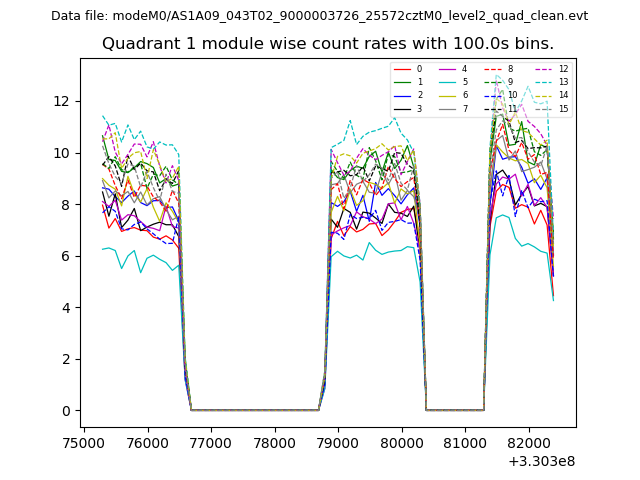
| Module-wise count rates for Quadrant A Data is divided into 100 sec bins |
 |
 |
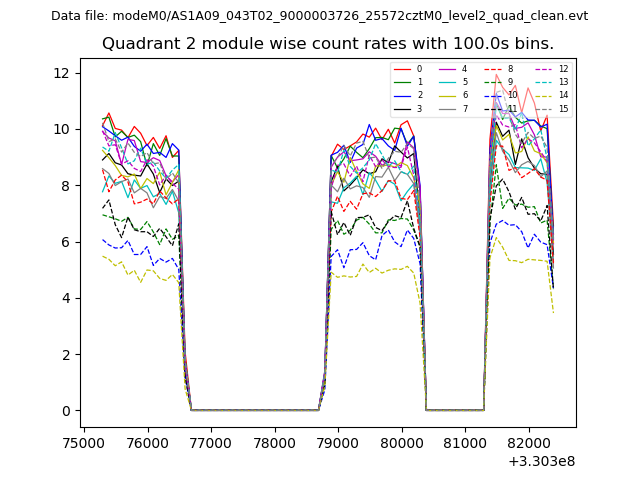
| Module-wise count rates for Quadrant B Data is divided into 100 sec bins |
 |
 |
| Module-wise count rates for Quadrant C Data is divided into 100 sec bins |
 |
 |
| Module-wise count rates for Quadrant D Data is divided into 100 sec bins |
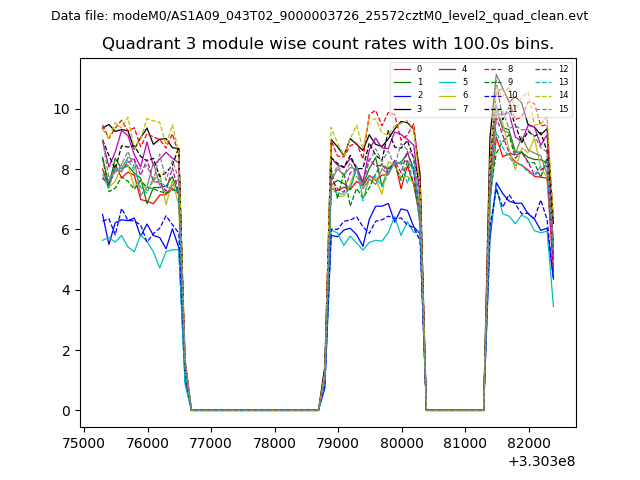 |
 |
| Parameter | Plot |
|---|---|
| CZT HV Monitor |  |
| D_VDD | 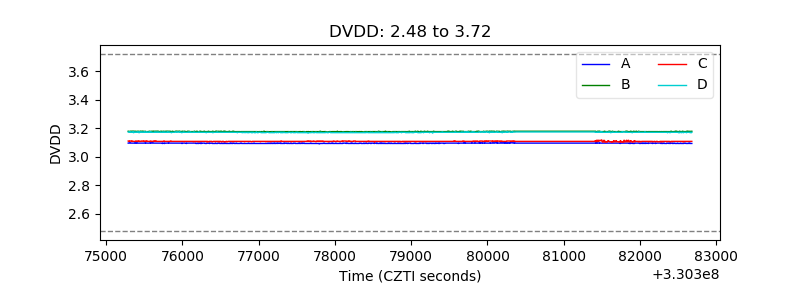 |
| Temperature 1 | 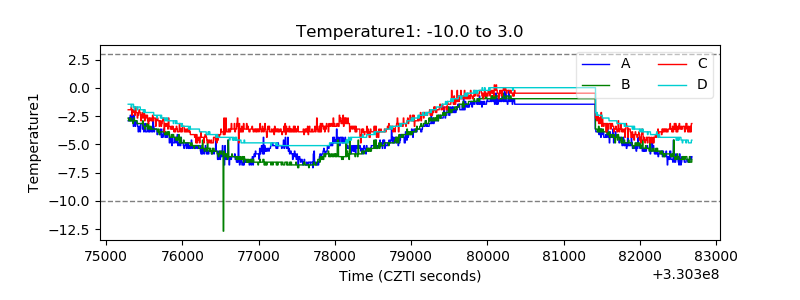 |
| Veto HV Monitor | 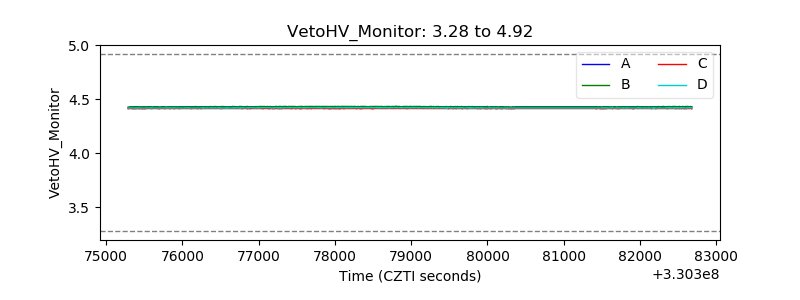 |
| Veto LLD | 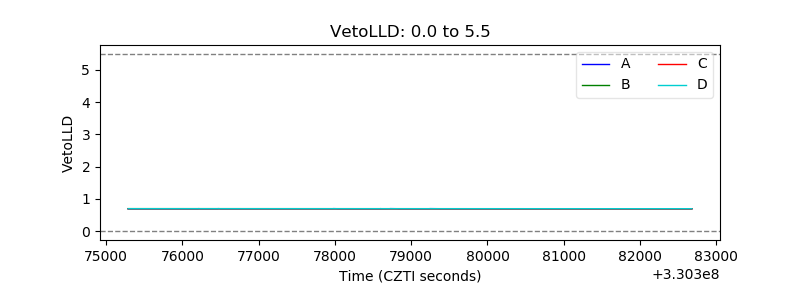 |
| Alpha Counter | 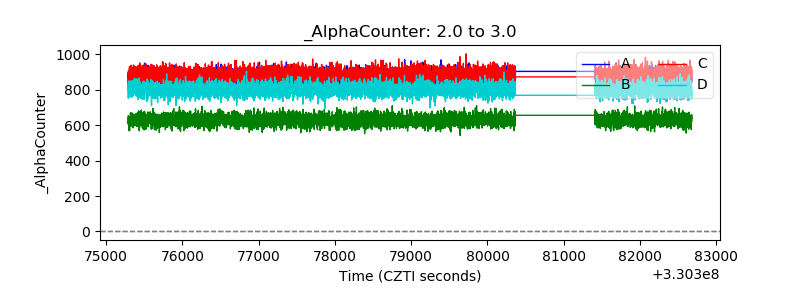 |
| _CPM_Rate | 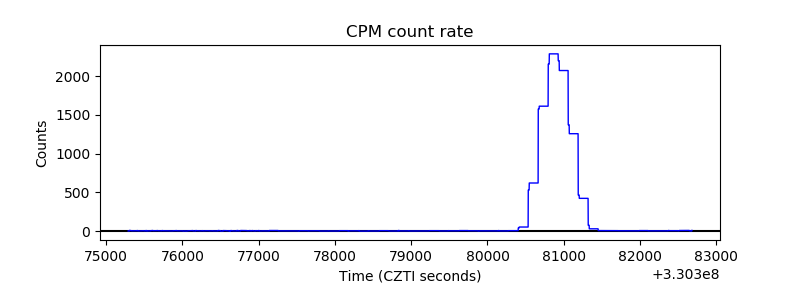 |
| CZT Counter | 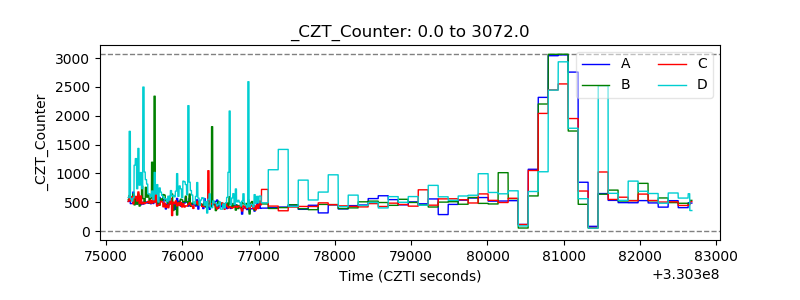 |
| +2.5 Volts monitor |  |
| +5 Volts monitor |  |
| _ROLL_ROT | 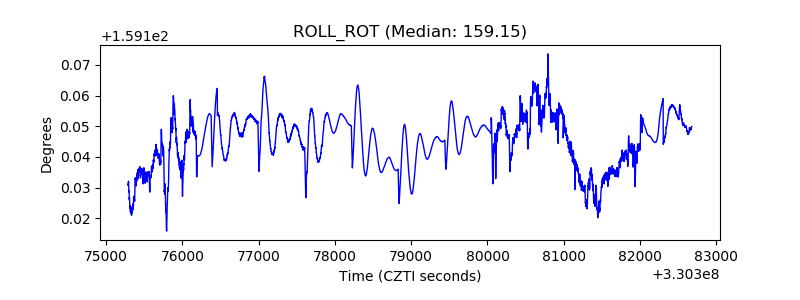 |
| _Roll_DEC | 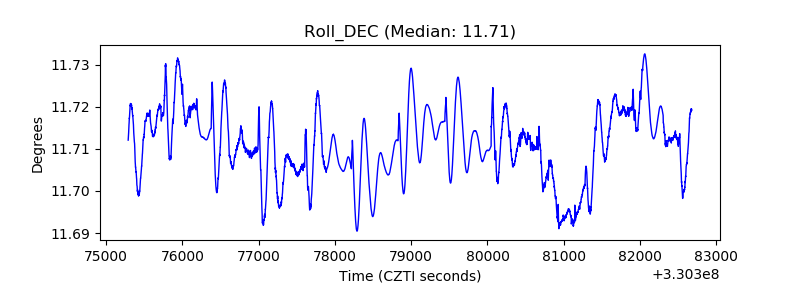 |
| _Roll_RA | 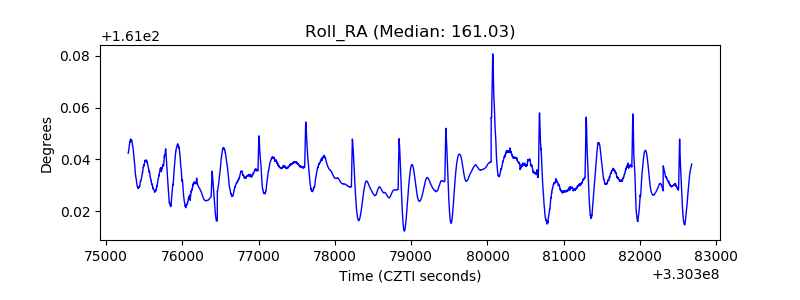 |
| Veto Counter | 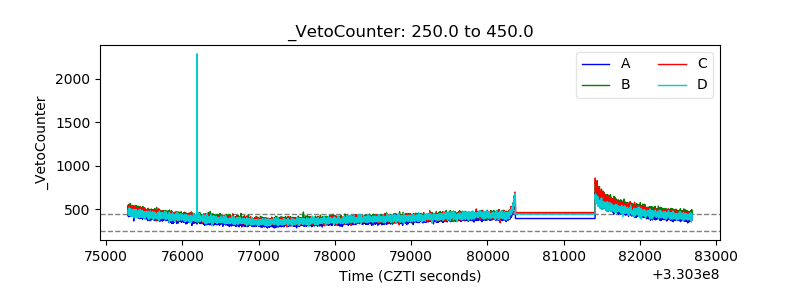 |