| Param | Original file | Final file |
|---|---|---|
| Filename | modeM0/AS1A09_043T02_9000003726_25574cztM0_level2.evt | modeM0/AS1A09_043T02_9000003726_25574cztM0_level2_quad_clean.evt |
| Size (bytes) | 496,157,760 | 80,550,720 |
| Size | 473.2 MB | 76.8 MB |
| Events in quadrant A | 3,205,665 | 515,340 |
| Events in quadrant B | 3,362,779 | 527,880 |
| Events in quadrant C | 3,233,557 | 488,247 |
| Events in quadrant D | 4,791,187 | 462,464 |
| Mode M0 | |||
|---|---|---|---|
| Quadrant | BADHDUFLAG | Total packets | Discarded packets |
| A | 0 | 13350 | 0 |
| B | 0 | 13862 | 0 |
| C | 0 | 13495 | 0 |
| D | 0 | 18574 | 0 |
| Mode M9 | |||
|---|---|---|---|
| Quadrant | BADHDUFLAG | Total packets | Discarded packets |
| A | 0 | 23 | 0 |
| B | 0 | 23 | 0 |
| C | 0 | 23 | 0 |
| D | 0 | 23 | 0 |
| Quadrant | Total seconds | Saturated seconds | Saturation percentage |
|---|---|---|---|
| A | 6385 | 24 | 0.375881% |
| B | 6386 | 30 | 0.469778% |
| C | 6386 | 43 | 0.673348% |
| D | 6386 | 313 | 4.901347% |
Noise dominated data is calculated using 1-second bins in cleaned event files. If a bin has >2000 counts, and if more than 50% of those come from <1% of pixels, then it is considered to be noise-dominated and hence unusable.
| Quadrant | # 1 sec bins | Bins with >0 counts | Bins with >2000 counts | High rate bins dominated by noise | Noise dominated (total time) | Noise dominated (detector-on time) | Marked lightcurve |
|---|---|---|---|---|---|---|---|
| A | 8615 | 6387 | 3 | 3 | 0.03% | 0.05% | 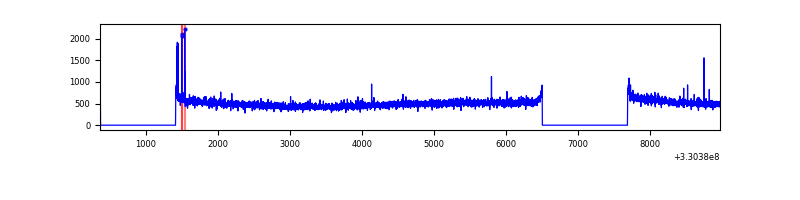 |
| B | 8616 | 6388 | 1 | 1 | 0.01% | 0.02% | 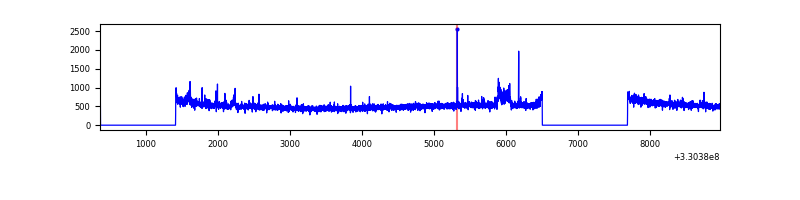 |
| C | 8616 | 6388 | 0 | 0 | 0.00% | 0.00% | 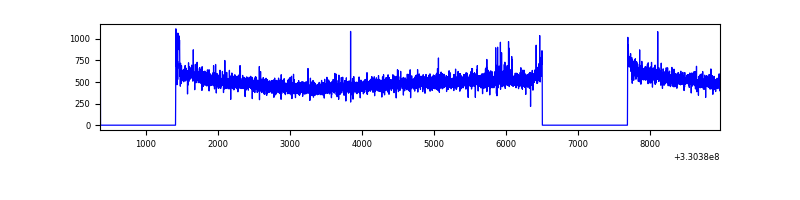 |
| D | 8616 | 6388 | 254 | 254 | 2.95% | 3.98% | 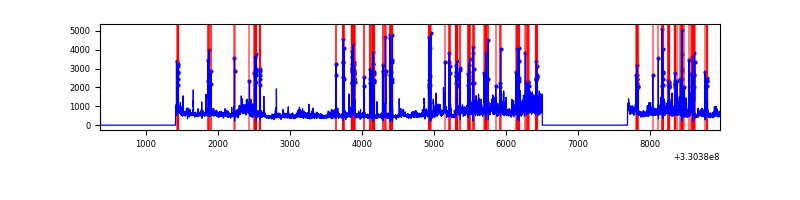 |
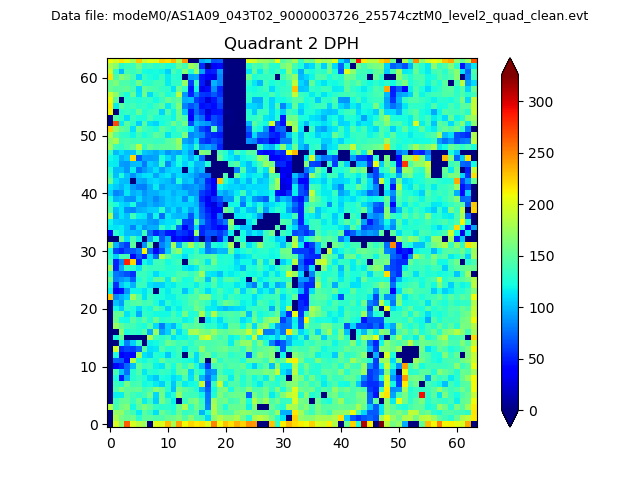
Top three noisy pixels from each quadrant. If the there are fewer than three noisy pixels in the level2.evt file, extra rows are filled as -1
| Pixel properties | Quadrant properties | ||||||
|---|---|---|---|---|---|---|---|
| Quadrant | DetID | PixID | Counts | Sigma | Mean | Median | Sigma |
| A | 15 | 173 | 15565 | 88.4 | 826 | 810 | 166.9 |
| A | 13 | 254 | 9977 | 54.92 | 826 | 810 | 166.9 |
| A | 3 | 137 | 7336 | 39.1 | 826 | 810 | 166.9 |
| B | 15 | 33 | 52235 | 331.47 | 826 | 808 | 155.1 |
| B | 0 | 219 | 22724 | 141.26 | 826 | 808 | 155.1 |
| B | 0 | 190 | 20092 | 124.29 | 826 | 808 | 155.1 |
| C | 14 | 238 | 127086 | 687.51 | 781 | 788 | 183.7 |
| C | 3 | 233 | 43709 | 233.64 | 781 | 788 | 183.7 |
| C | 1 | 90 | 9981 | 50.04 | 781 | 788 | 183.7 |
| D | 1 | 52 | 1369892 | 7318.28 | 767 | 747 | 187.1 |
| D | 8 | 195 | 429021 | 2289.19 | 767 | 747 | 187.1 |
| D | 2 | 120 | 29353 | 152.9 | 767 | 747 | 187.1 |
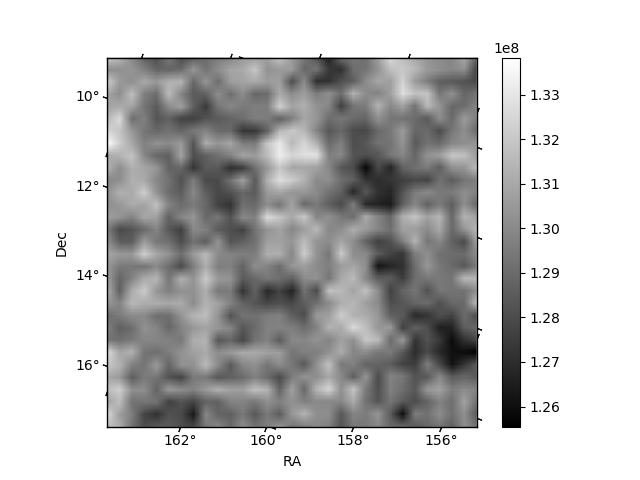
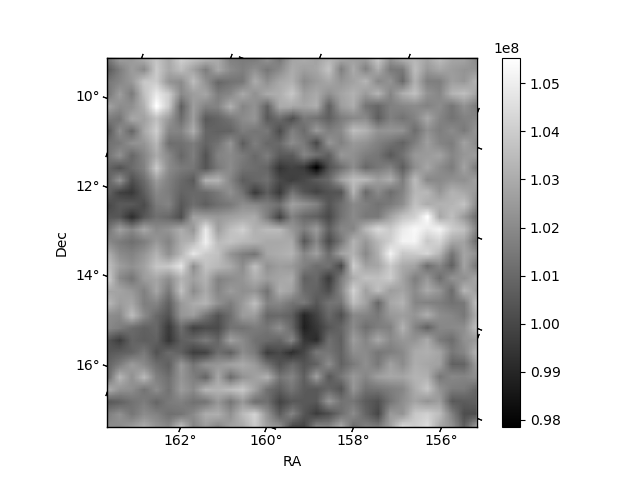
Histogram calculated using DETX and DETY for each event in the final _common_clean file
| Quadrant A | 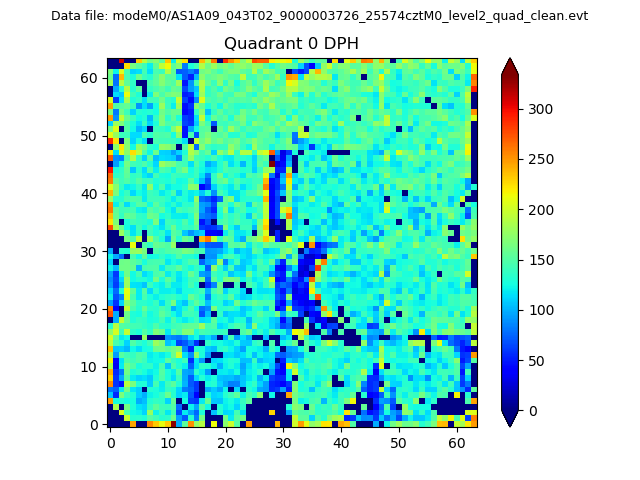 |
 |
Quadrant B |
|---|---|---|---|
| Quadrant D |  |
 |
Quadrant C |
| Plot type | Count rate plots | Images |
|---|---|---|
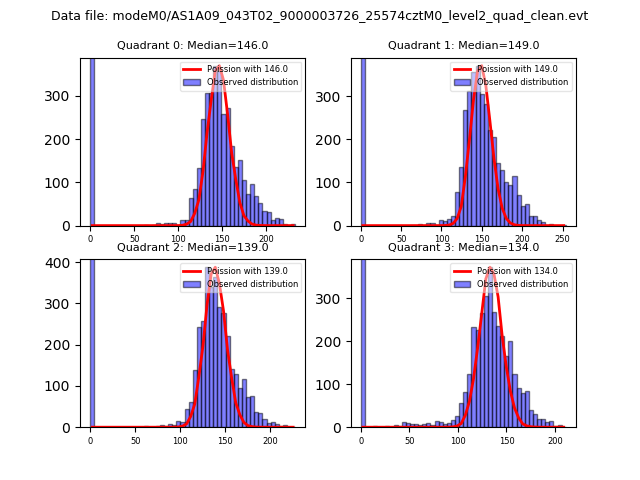
| Comparison with Poisson distribution Blue bars denote a histogram of data divided into 1 sec bins. Red curve is a Poisson curve with rate = median count rate of data. |
 |
 |
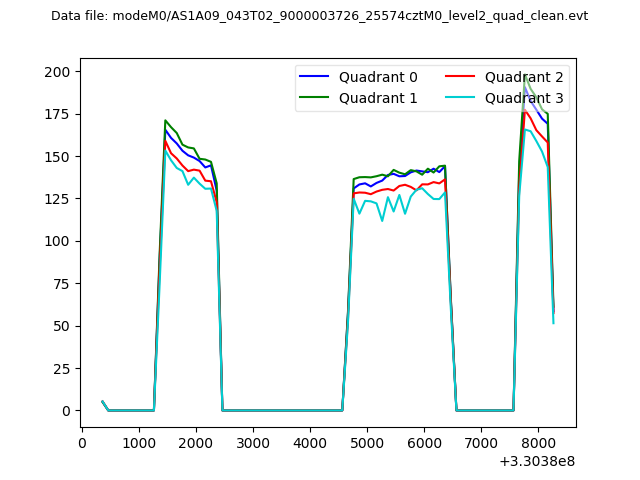
| Quadrant-wise count rates Data is divided into 100 sec bins |
 |
|
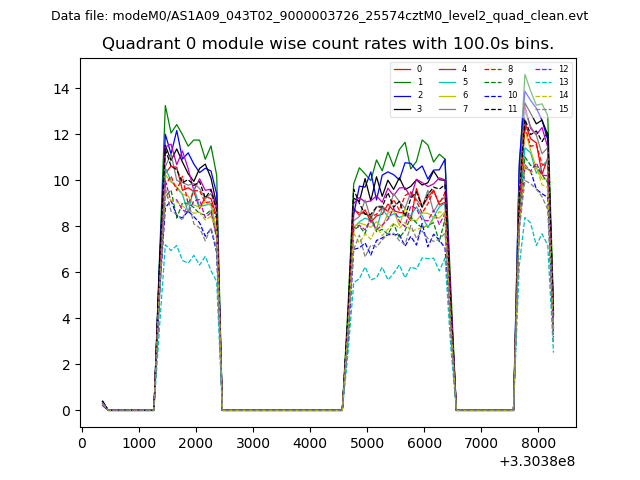
| Module-wise count rates for Quadrant A Data is divided into 100 sec bins |
 |
 |
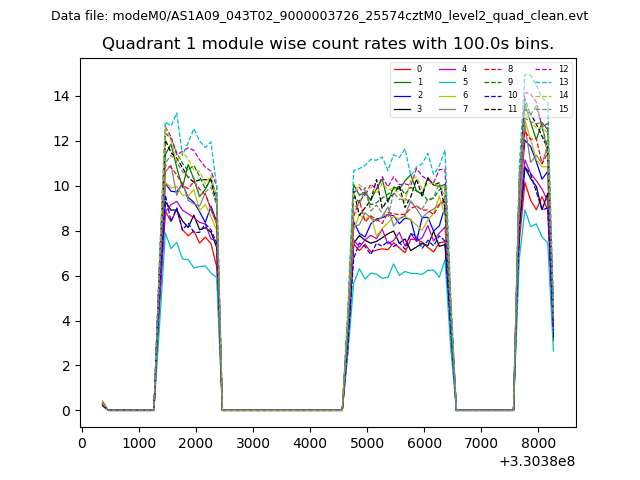
| Module-wise count rates for Quadrant B Data is divided into 100 sec bins |
 |
 |
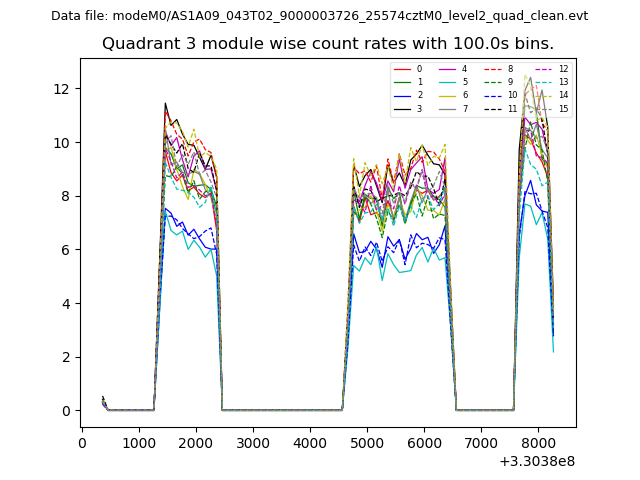
| Module-wise count rates for Quadrant C Data is divided into 100 sec bins |
 |
 |
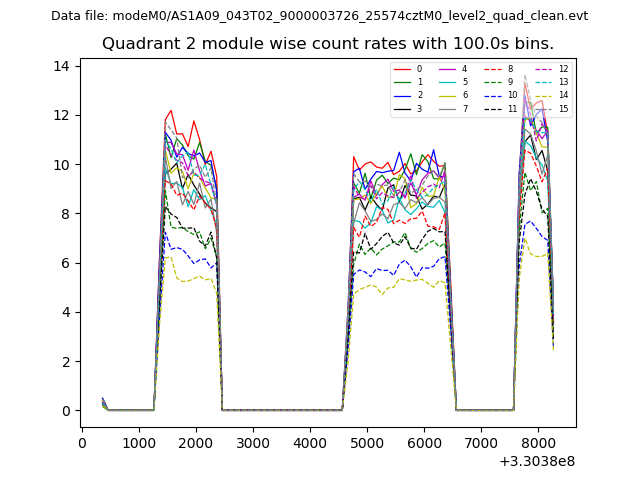
| Module-wise count rates for Quadrant D Data is divided into 100 sec bins |
 |
 |
| Parameter | Plot |
|---|---|
| CZT HV Monitor | 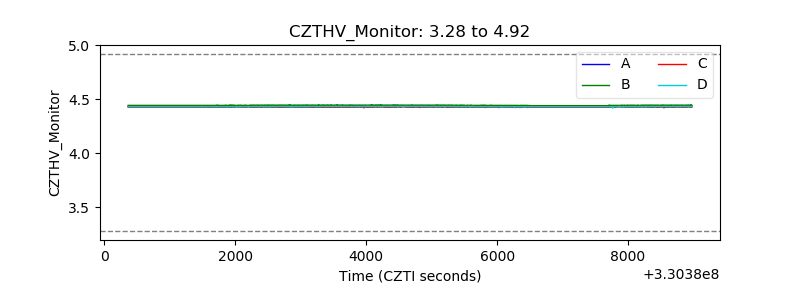 |
| D_VDD | 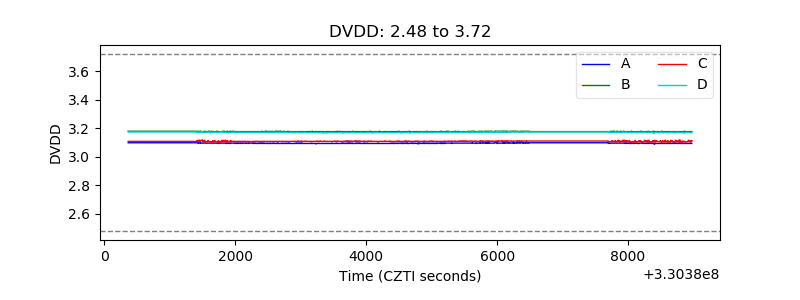 |
| Temperature 1 | 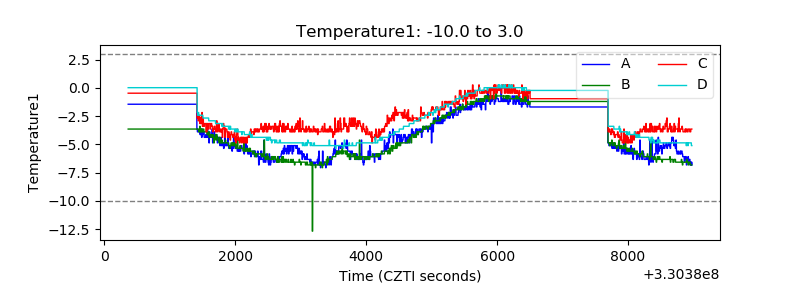 |
| Veto HV Monitor | 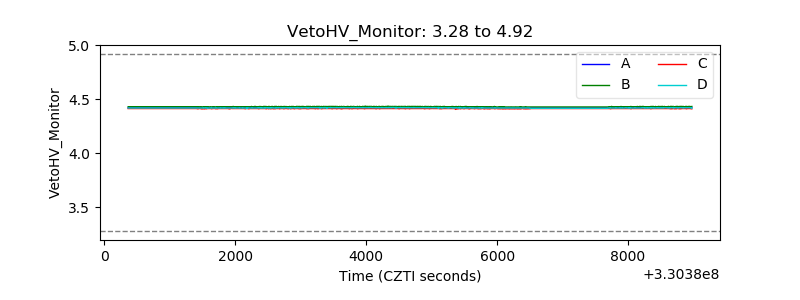 |
| Veto LLD | 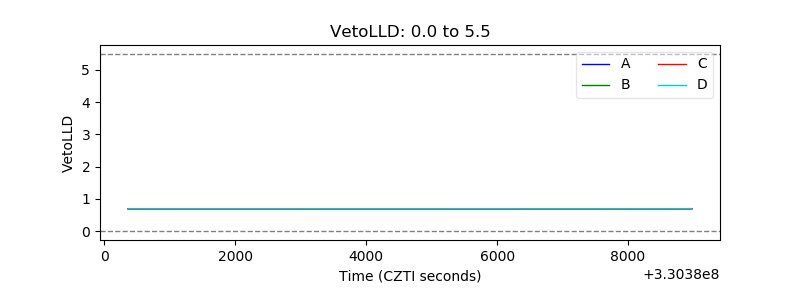 |
| Alpha Counter | 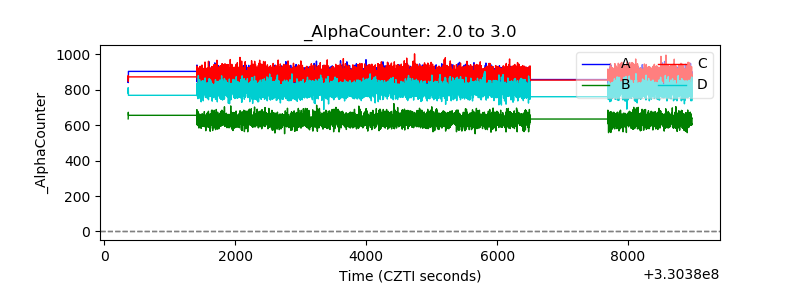 |
| _CPM_Rate | 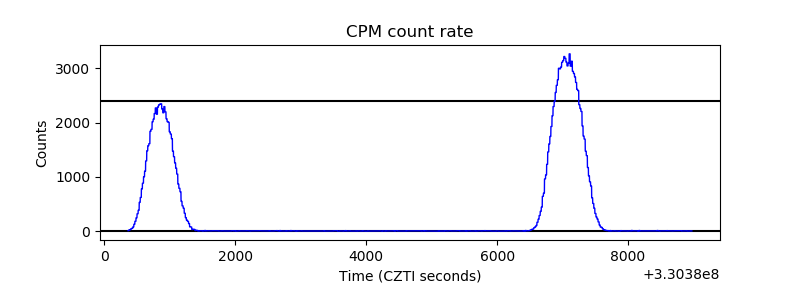 |
| CZT Counter | 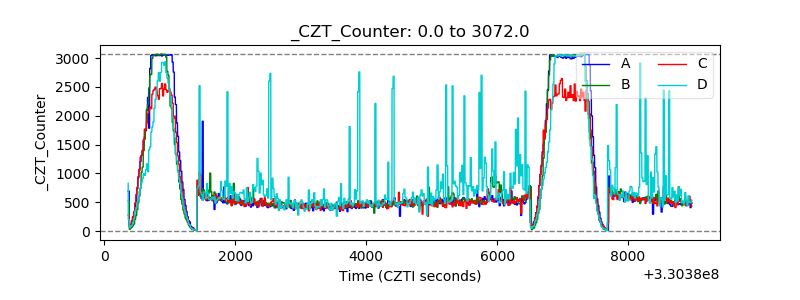 |
| +2.5 Volts monitor |  |
| +5 Volts monitor |  |
| _ROLL_ROT | 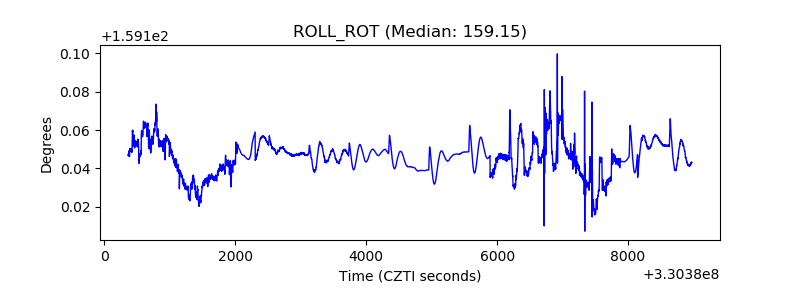 |
| _Roll_DEC | 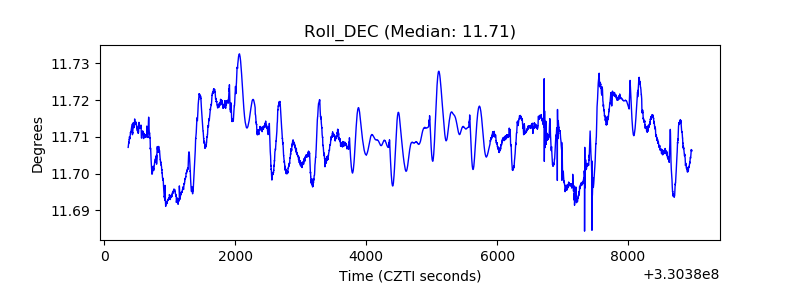 |
| _Roll_RA | 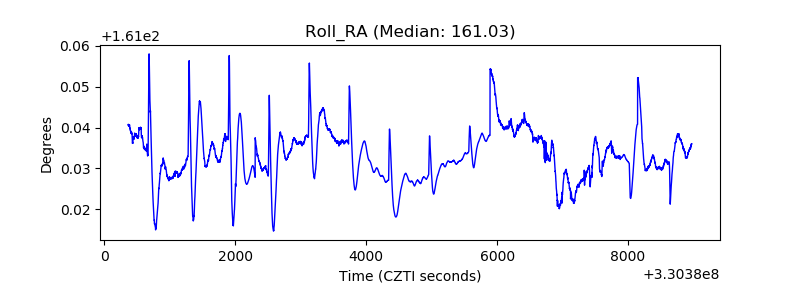 |
| Veto Counter | 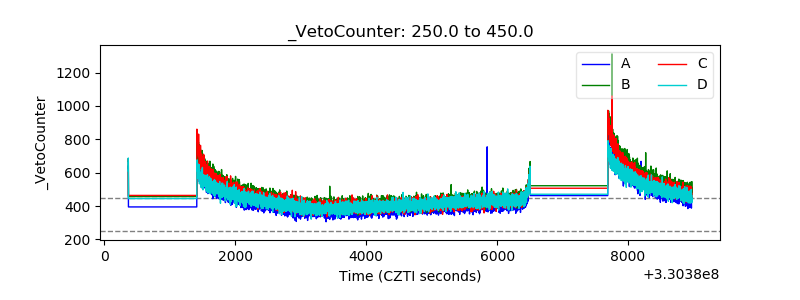 |