| Param | Original file | Final file |
|---|---|---|
| Filename | modeM0/AS1A09_043T02_9000003726_25575cztM0_level2.evt | modeM0/AS1A09_043T02_9000003726_25575cztM0_level2_quad_clean.evt |
| Size (bytes) | 515,456,640 | 72,694,080 |
| Size | 491.6 MB | 69.3 MB |
| Events in quadrant A | 3,372,655 | 456,511 |
| Events in quadrant B | 3,444,847 | 469,438 |
| Events in quadrant C | 3,335,573 | 430,704 |
| Events in quadrant D | 5,032,050 | 406,358 |
| Mode M0 | |||
|---|---|---|---|
| Quadrant | BADHDUFLAG | Total packets | Discarded packets |
| A | 0 | 13701 | 0 |
| B | 0 | 13984 | 0 |
| C | 0 | 13589 | 0 |
| D | 0 | 19293 | 0 |
| Mode M9 | |||
|---|---|---|---|
| Quadrant | BADHDUFLAG | Total packets | Discarded packets |
| A | 0 | 15 | 0 |
| B | 0 | 16 | 0 |
| C | 0 | 16 | 0 |
| D | 0 | 16 | 0 |
| Quadrant | Total seconds | Saturated seconds | Saturation percentage |
|---|---|---|---|
| A | 6284 | 24 | 0.381922% |
| B | 6284 | 30 | 0.477403% |
| C | 6284 | 61 | 0.970719% |
| D | 6284 | 274 | 4.360280% |
Noise dominated data is calculated using 1-second bins in cleaned event files. If a bin has >2000 counts, and if more than 50% of those come from <1% of pixels, then it is considered to be noise-dominated and hence unusable.
| Quadrant | # 1 sec bins | Bins with >0 counts | Bins with >2000 counts | High rate bins dominated by noise | Noise dominated (total time) | Noise dominated (detector-on time) | Marked lightcurve |
|---|---|---|---|---|---|---|---|
| A | 7544 | 6285 | 0 | 0 | 0.00% | 0.00% | 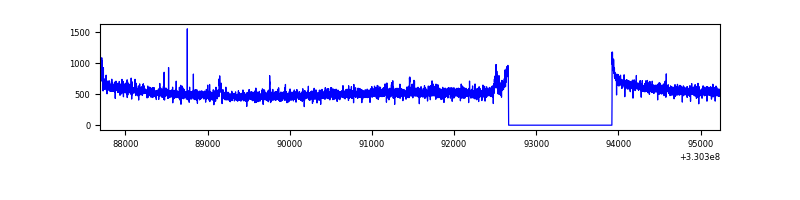 |
| B | 7544 | 6285 | 1 | 1 | 0.01% | 0.02% | 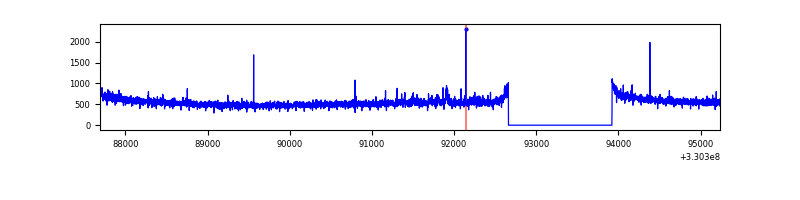 |
| C | 7544 | 6285 | 0 | 0 | 0.00% | 0.00% | 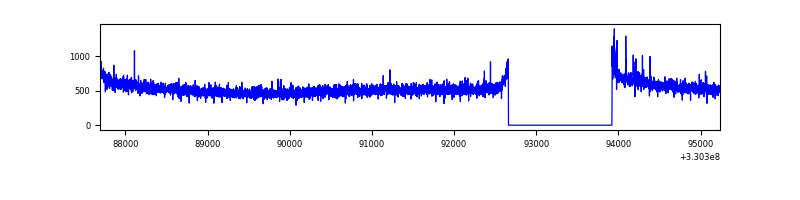 |
| D | 7544 | 6285 | 204 | 204 | 2.70% | 3.25% | 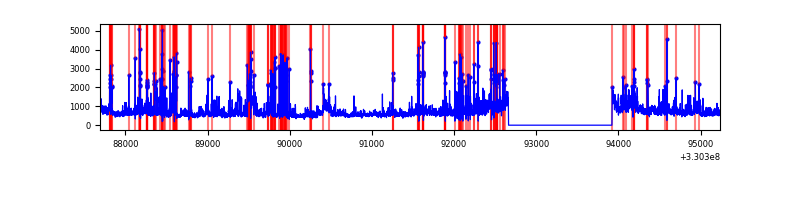 |
Top three noisy pixels from each quadrant. If the there are fewer than three noisy pixels in the level2.evt file, extra rows are filled as -1
| Pixel properties | Quadrant properties | ||||||
|---|---|---|---|---|---|---|---|
| Quadrant | DetID | PixID | Counts | Sigma | Mean | Median | Sigma |
| A | 6 | 16 | 38816 | 220.8 | 864 | 850 | 171.9 |
| A | 13 | 254 | 10019 | 53.32 | 864 | 850 | 171.9 |
| A | 0 | 226 | 7526 | 38.83 | 864 | 850 | 171.9 |
| B | 3 | 112 | 24226 | 144.88 | 862 | 845 | 161.4 |
| B | 0 | 219 | 20842 | 123.91 | 862 | 845 | 161.4 |
| B | 12 | 111 | 18757 | 110.99 | 862 | 845 | 161.4 |
| C | 14 | 238 | 133125 | 705.99 | 808 | 813 | 187.4 |
| C | 3 | 233 | 34429 | 179.37 | 808 | 813 | 187.4 |
| C | 8 | 128 | 10091 | 49.51 | 808 | 813 | 187.4 |
| D | 1 | 52 | 1386235 | 7147.8 | 798 | 778 | 193.8 |
| D | 8 | 195 | 531884 | 2740.06 | 798 | 778 | 193.8 |
| D | 2 | 244 | 61573 | 313.65 | 798 | 778 | 193.8 |
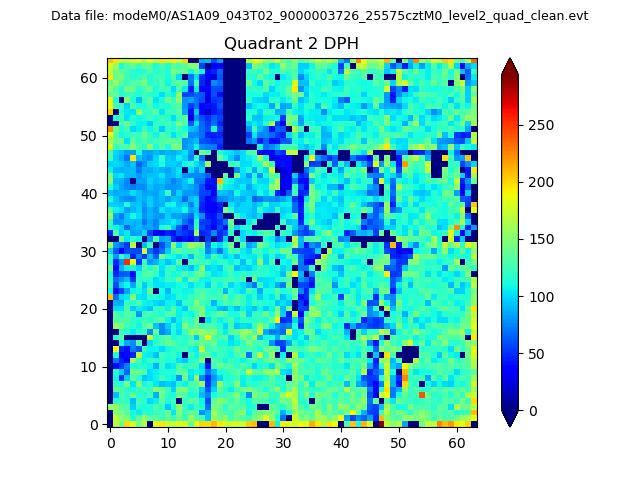
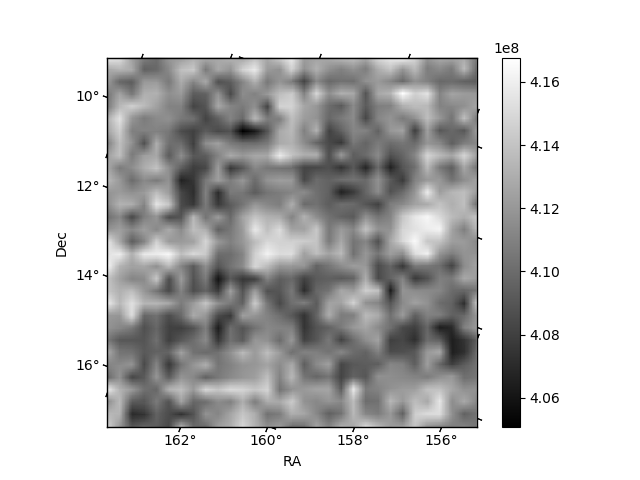
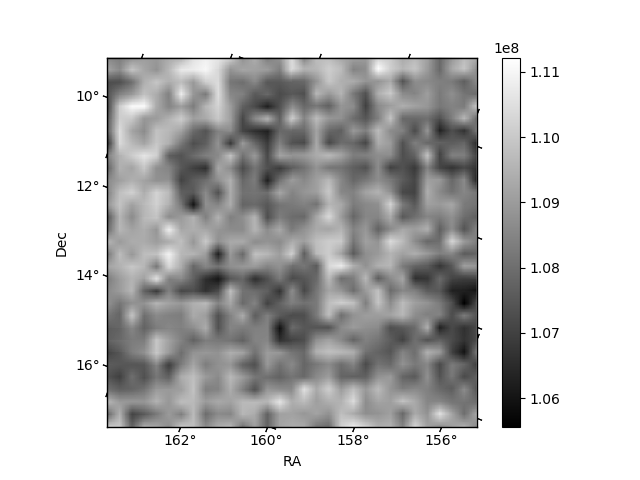
Histogram calculated using DETX and DETY for each event in the final _common_clean file
| Quadrant A | 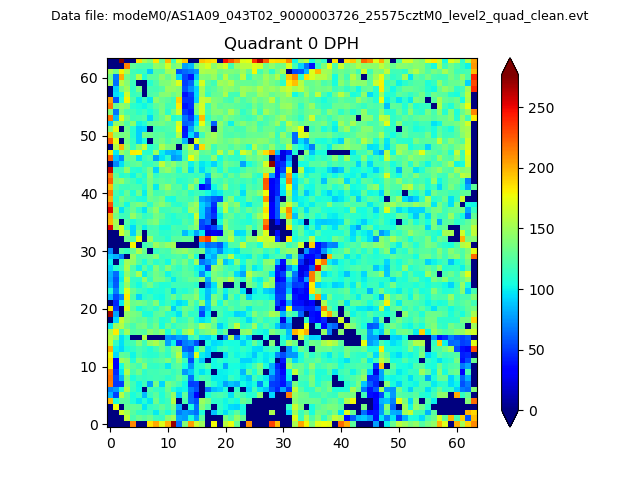 |
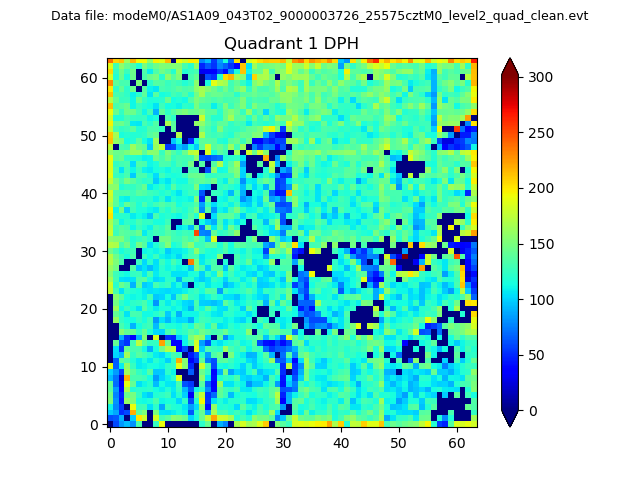 |
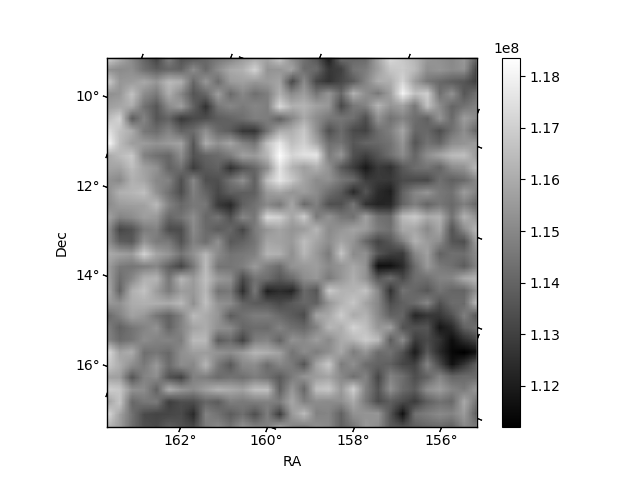
Quadrant B |
|---|---|---|---|
| Quadrant D | 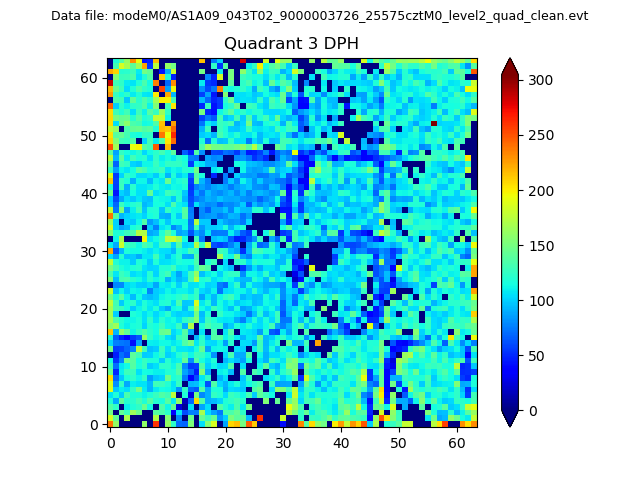 |
 |
Quadrant C |
| Plot type | Count rate plots | Images |
|---|---|---|
| Comparison with Poisson distribution Blue bars denote a histogram of data divided into 1 sec bins. Red curve is a Poisson curve with rate = median count rate of data. |
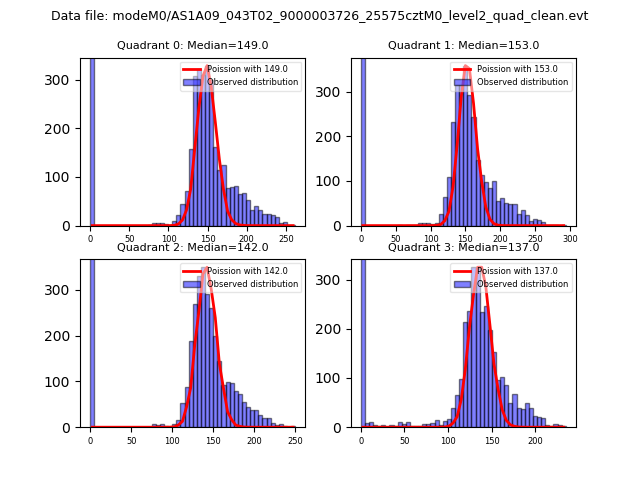 |
 |
| Quadrant-wise count rates Data is divided into 100 sec bins |
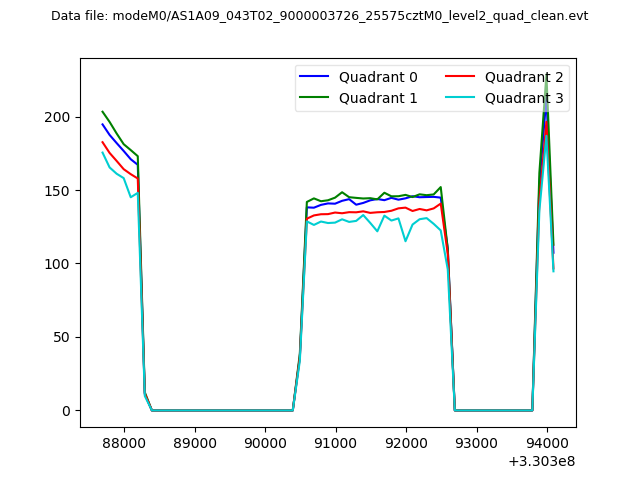 |
|
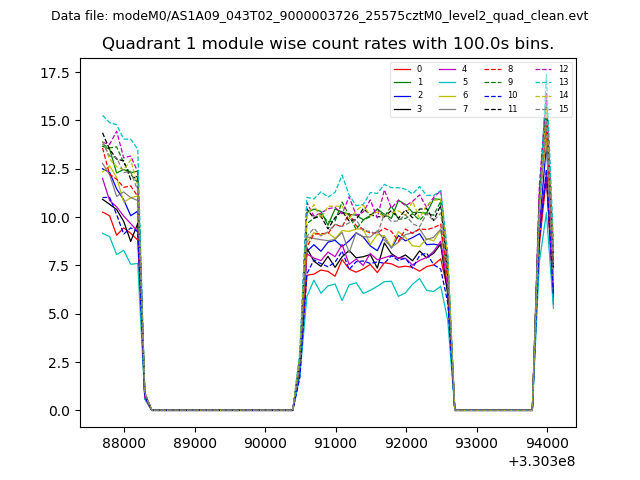
| Module-wise count rates for Quadrant A Data is divided into 100 sec bins |
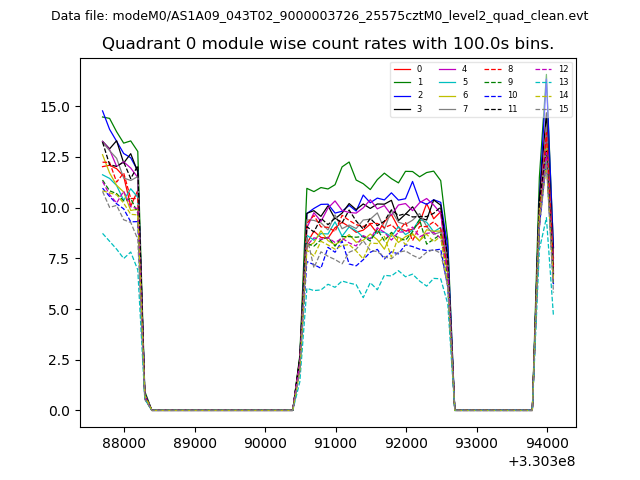 |
 |
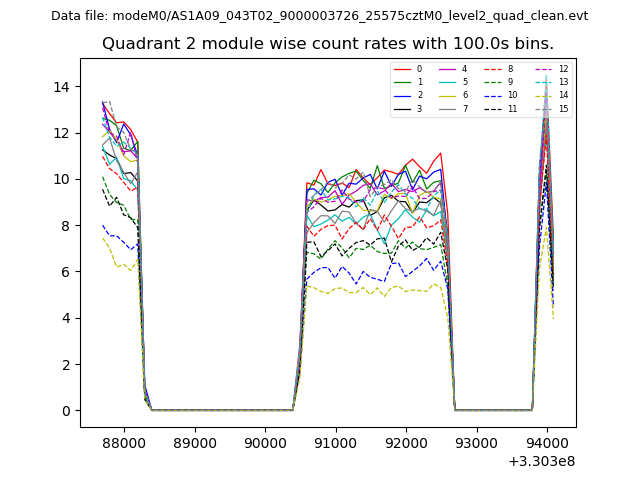
| Module-wise count rates for Quadrant B Data is divided into 100 sec bins |
 |
 |
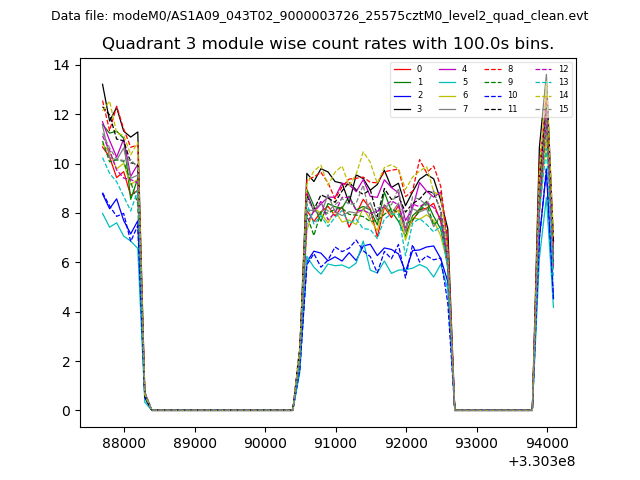
| Module-wise count rates for Quadrant C Data is divided into 100 sec bins |
 |
 |
| Module-wise count rates for Quadrant D Data is divided into 100 sec bins |
 |
 |
| Parameter | Plot |
|---|---|
| CZT HV Monitor | 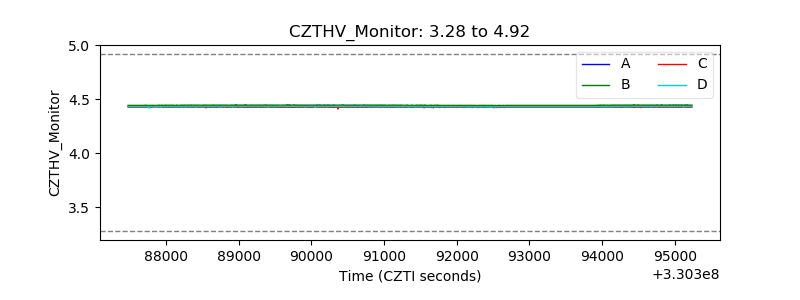 |
| D_VDD | 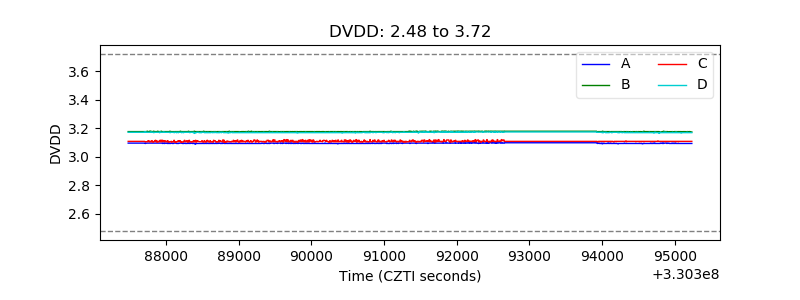 |
| Temperature 1 | 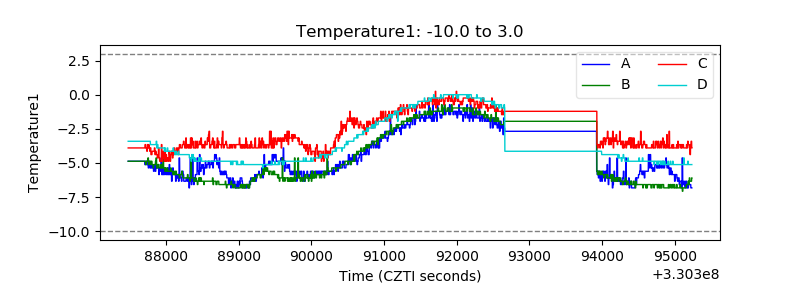 |
| Veto HV Monitor | 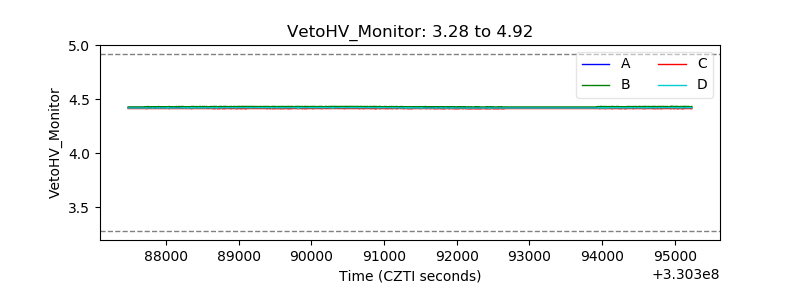 |
| Veto LLD | 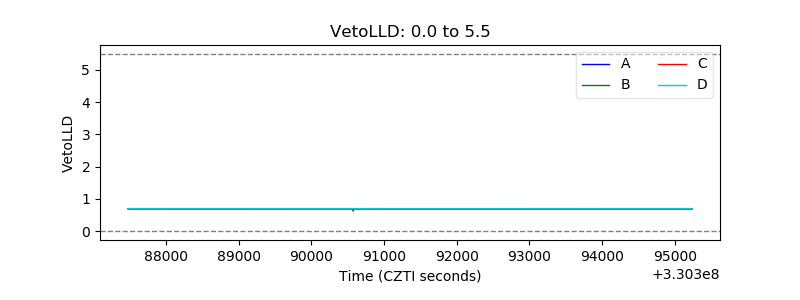 |
| Alpha Counter | 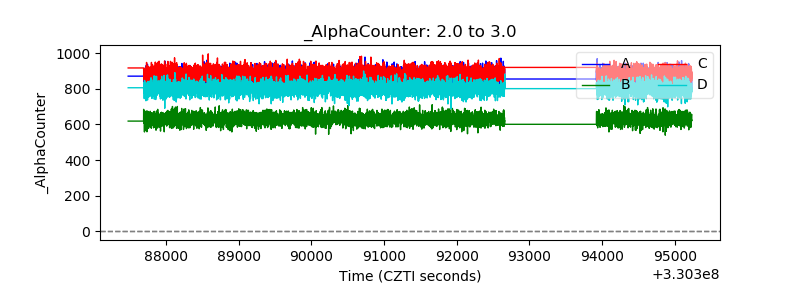 |
| _CPM_Rate | 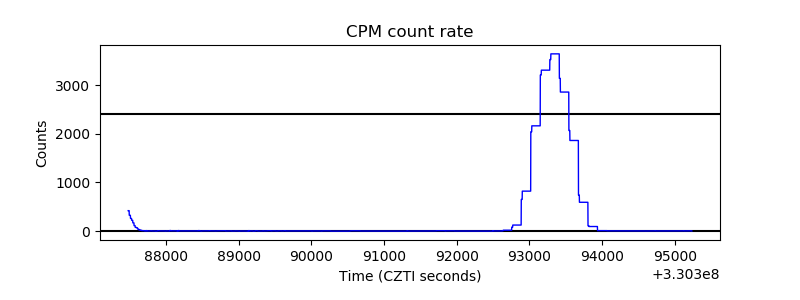 |
| CZT Counter | 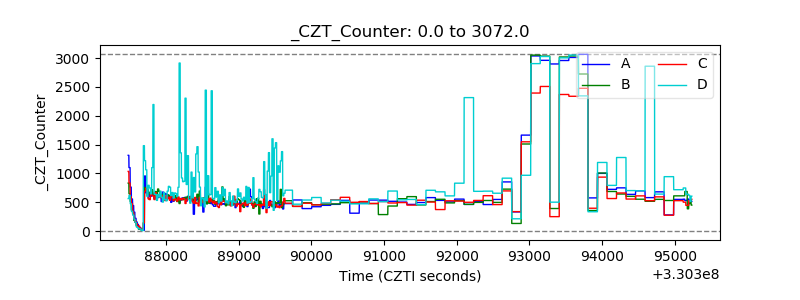 |
| +2.5 Volts monitor | 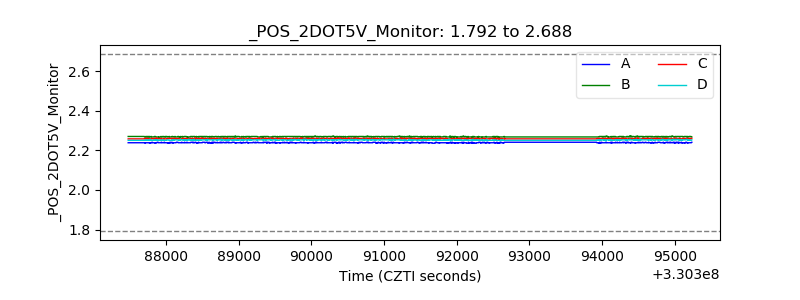 |
| +5 Volts monitor |  |
| _ROLL_ROT | 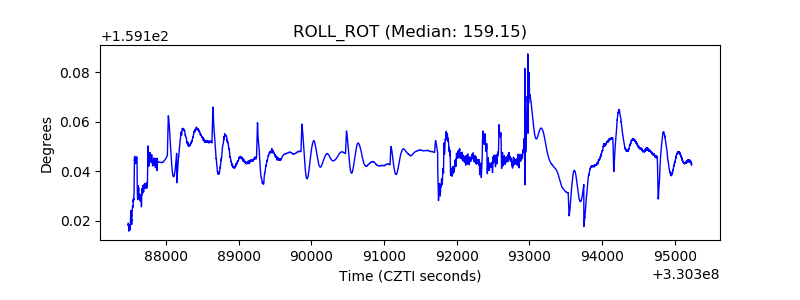 |
| _Roll_DEC | 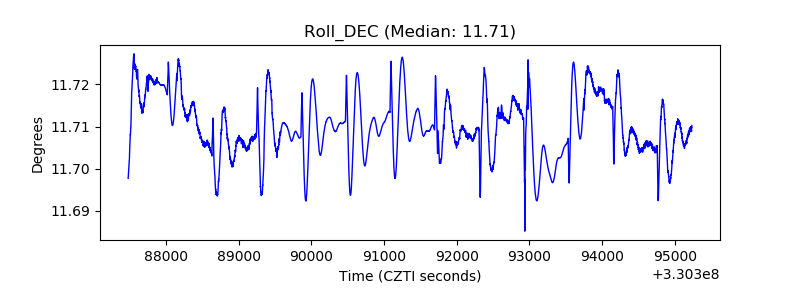 |
| _Roll_RA | 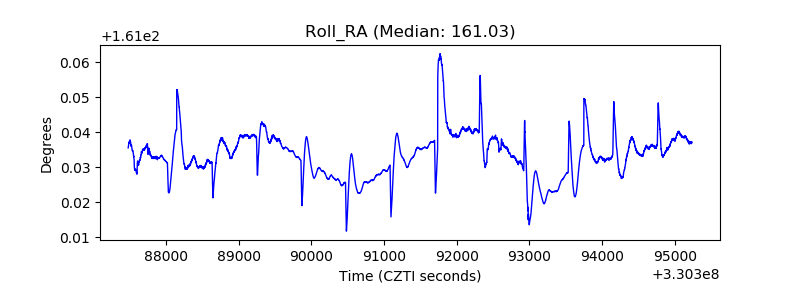 |
| Veto Counter | 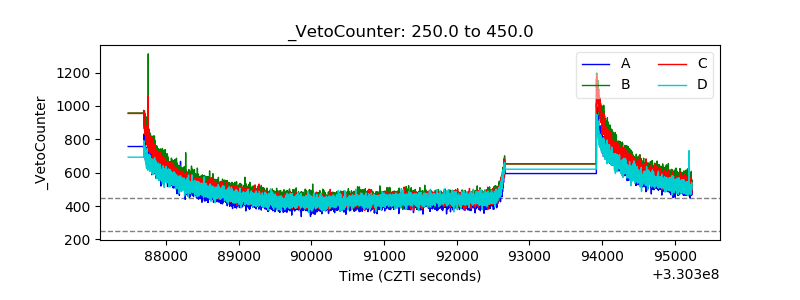 |