| Param | Original file | Final file |
|---|---|---|
| Filename | modeM0/AS1A09_043T02_9000003726_25576cztM0_level2.evt | modeM0/AS1A09_043T02_9000003726_25576cztM0_level2_quad_clean.evt |
| Size (bytes) | 573,431,040 | 66,585,600 |
| Size | 546.9 MB | 63.5 MB |
| Events in quadrant A | 3,569,403 | 411,342 |
| Events in quadrant B | 3,682,357 | 420,300 |
| Events in quadrant C | 3,547,718 | 386,059 |
| Events in quadrant D | 6,134,014 | 351,808 |
| Mode M0 | |||
|---|---|---|---|
| Quadrant | BADHDUFLAG | Total packets | Discarded packets |
| A | 0 | 14300 | 0 |
| B | 0 | 14796 | 0 |
| C | 0 | 14241 | 0 |
| D | 0 | 22781 | 0 |
| Mode M9 | |||
|---|---|---|---|
| Quadrant | BADHDUFLAG | Total packets | Discarded packets |
| A | 0 | 19 | 0 |
| B | 0 | 20 | 0 |
| C | 0 | 20 | 0 |
| D | 0 | 20 | 0 |
| Quadrant | Total seconds | Saturated seconds | Saturation percentage |
|---|---|---|---|
| A | 6397 | 58 | 0.906675% |
| B | 6396 | 79 | 1.235147% |
| C | 6396 | 96 | 1.500938% |
| D | 6396 | 633 | 9.896811% |
Noise dominated data is calculated using 1-second bins in cleaned event files. If a bin has >2000 counts, and if more than 50% of those come from <1% of pixels, then it is considered to be noise-dominated and hence unusable.
| Quadrant | # 1 sec bins | Bins with >0 counts | Bins with >2000 counts | High rate bins dominated by noise | Noise dominated (total time) | Noise dominated (detector-on time) | Marked lightcurve |
|---|---|---|---|---|---|---|---|
| A | 7702 | 6398 | 0 | 0 | 0.00% | 0.00% | 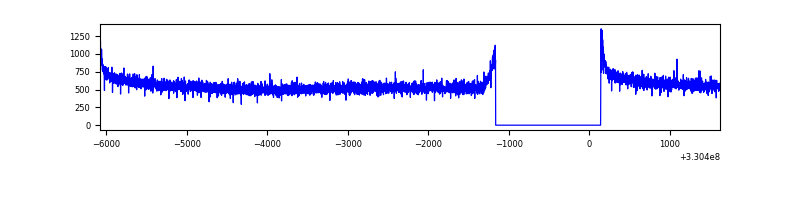 |
| B | 7701 | 6397 | 0 | 0 | 0.00% | 0.00% | 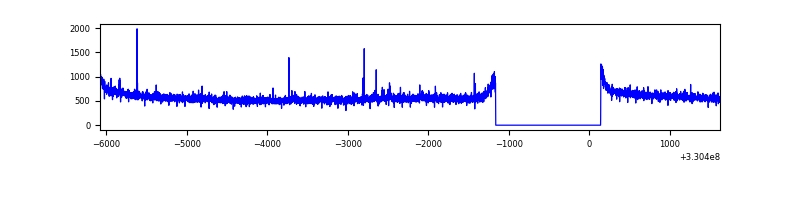 |
| C | 7701 | 6397 | 0 | 0 | 0.00% | 0.00% | 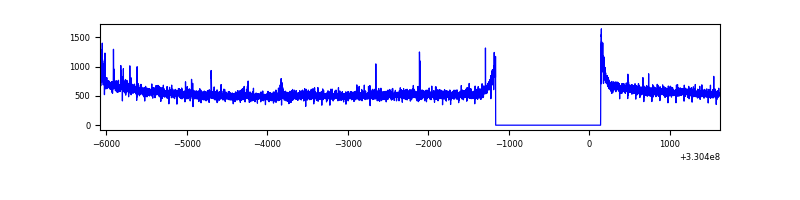 |
| D | 7701 | 6397 | 503 | 503 | 6.53% | 7.86% | 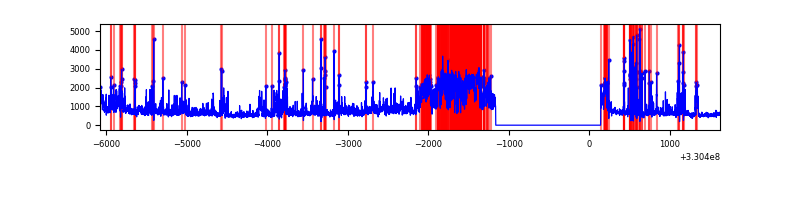 |
Top three noisy pixels from each quadrant. If the there are fewer than three noisy pixels in the level2.evt file, extra rows are filled as -1
| Pixel properties | Quadrant properties | ||||||
|---|---|---|---|---|---|---|---|
| Quadrant | DetID | PixID | Counts | Sigma | Mean | Median | Sigma |
| A | 13 | 254 | 9733 | 48.17 | 925 | 911 | 183.1 |
| A | 0 | 226 | 8002 | 38.72 | 925 | 911 | 183.1 |
| A | 3 | 137 | 7526 | 36.12 | 925 | 911 | 183.1 |
| B | 0 | 219 | 34881 | 197.6 | 924 | 908 | 171.9 |
| B | 12 | 111 | 20063 | 111.41 | 924 | 908 | 171.9 |
| B | 11 | 111 | 17575 | 96.94 | 924 | 908 | 171.9 |
| C | 14 | 238 | 139242 | 695.88 | 861 | 871 | 198.8 |
| C | 3 | 233 | 48788 | 240.98 | 861 | 871 | 198.8 |
| C | 13 | 61 | 5901 | 25.3 | 861 | 871 | 198.8 |
| D | 1 | 52 | 1971763 | 9585.56 | 847 | 823 | 205.6 |
| D | 8 | 195 | 731184 | 3552.07 | 847 | 823 | 205.6 |
| D | 2 | 244 | 198654 | 962.14 | 847 | 823 | 205.6 |
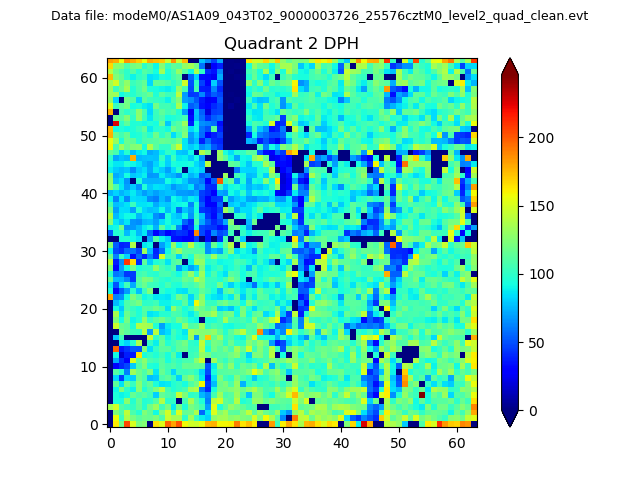
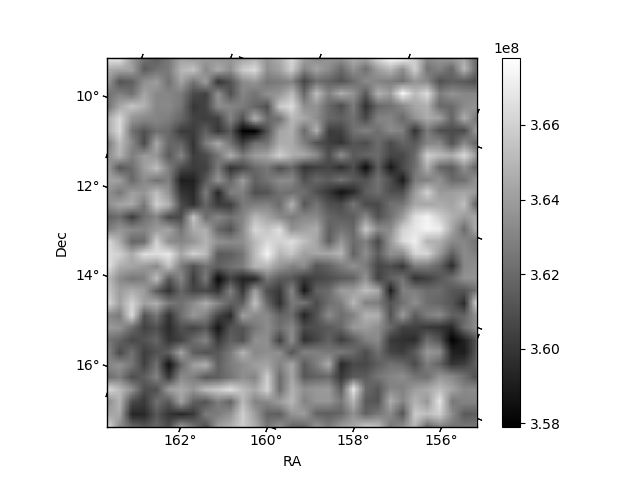
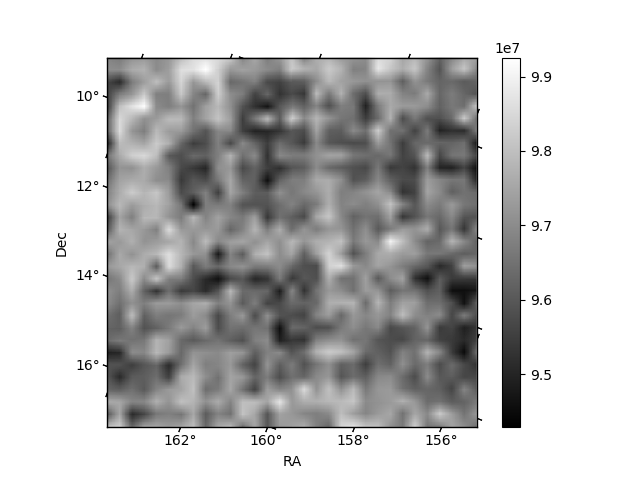
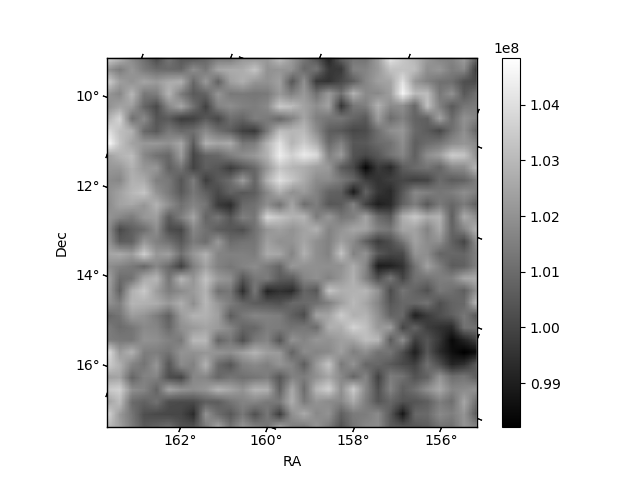
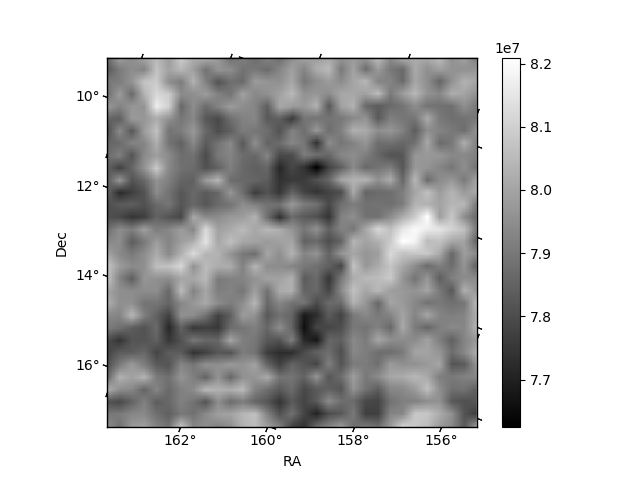
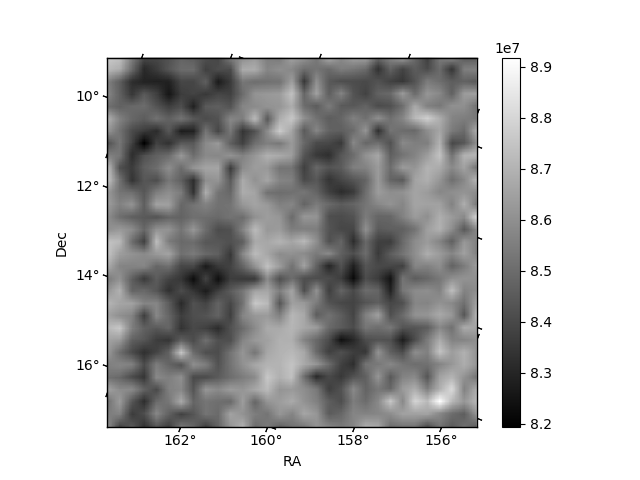
Histogram calculated using DETX and DETY for each event in the final _common_clean file
| Quadrant A | 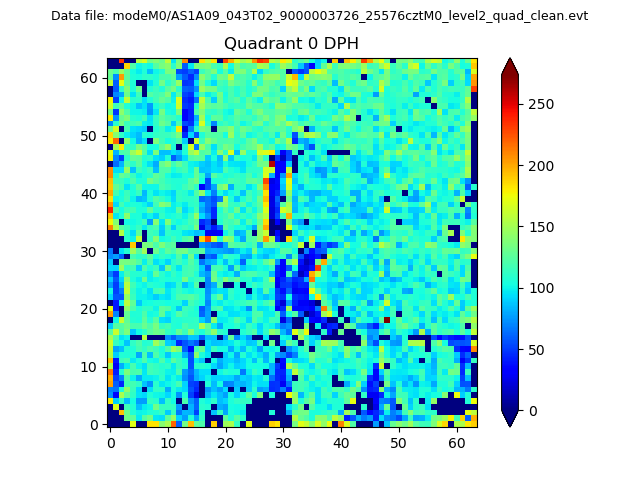 |
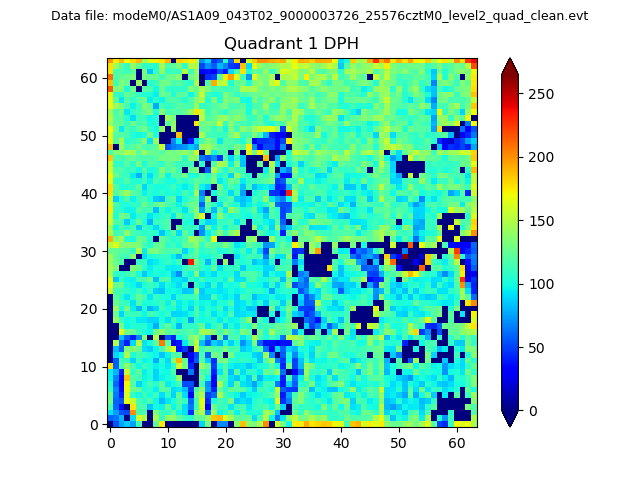 |
Quadrant B |
|---|---|---|---|
| Quadrant D | 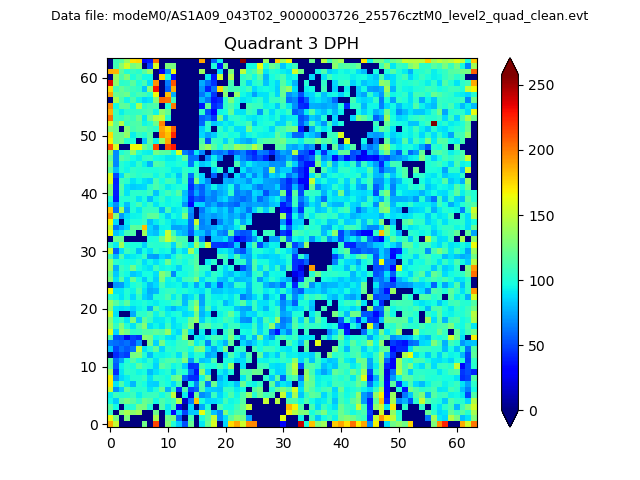 |
 |
Quadrant C |
| Plot type | Count rate plots | Images |
|---|---|---|
| Comparison with Poisson distribution Blue bars denote a histogram of data divided into 1 sec bins. Red curve is a Poisson curve with rate = median count rate of data. |
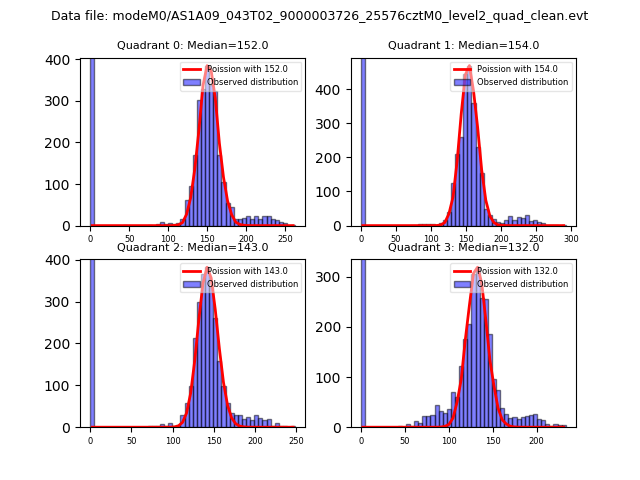 |
 |
| Quadrant-wise count rates Data is divided into 100 sec bins |
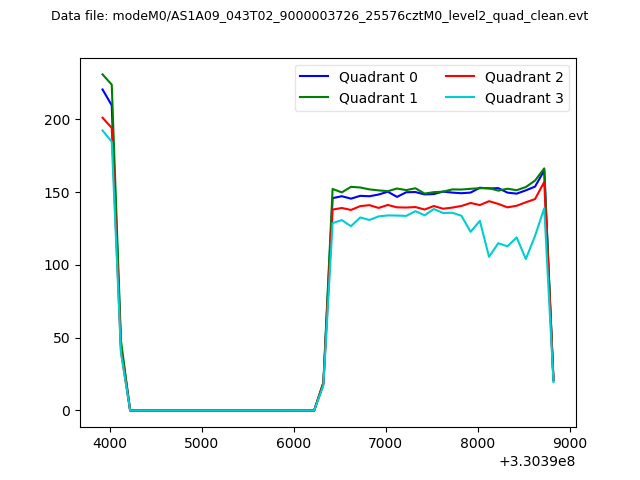 |
|
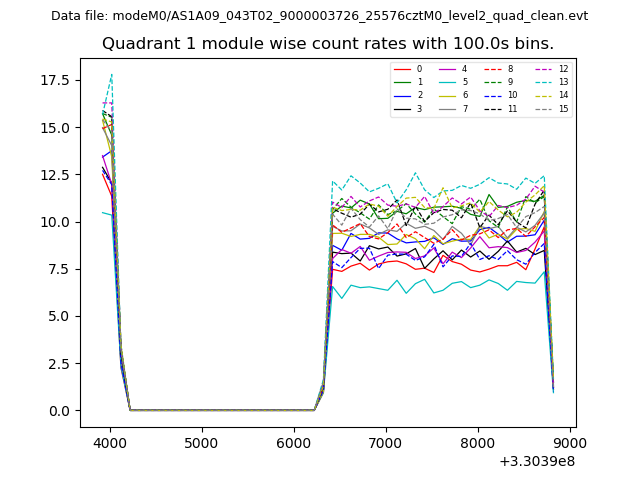
| Module-wise count rates for Quadrant A Data is divided into 100 sec bins |
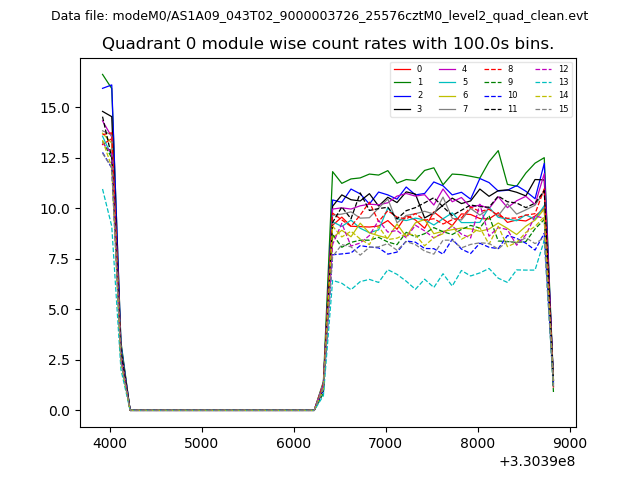 |
 |
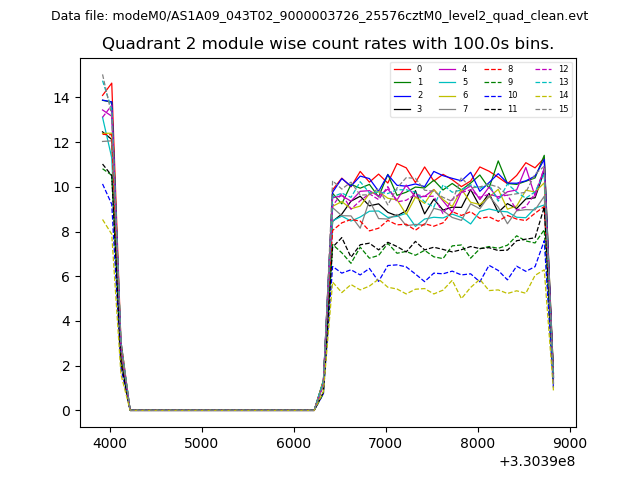
| Module-wise count rates for Quadrant B Data is divided into 100 sec bins |
 |
 |
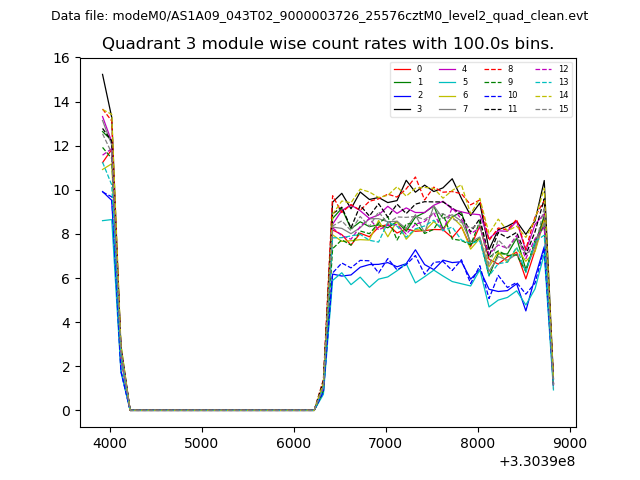
| Module-wise count rates for Quadrant C Data is divided into 100 sec bins |
 |
 |
| Module-wise count rates for Quadrant D Data is divided into 100 sec bins |
 |
 |
| Parameter | Plot |
|---|---|
| CZT HV Monitor | 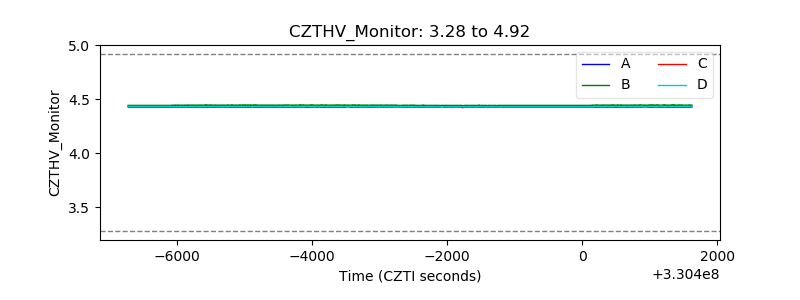 |
| D_VDD | 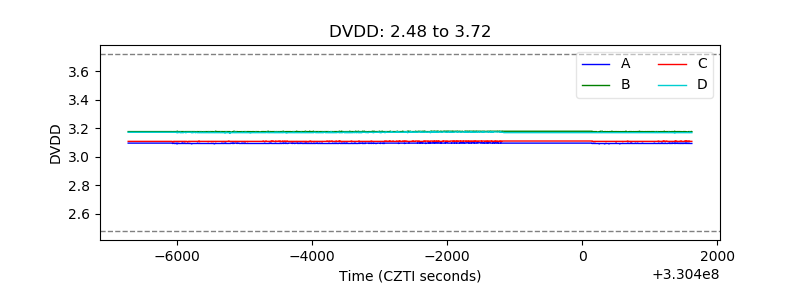 |
| Temperature 1 | 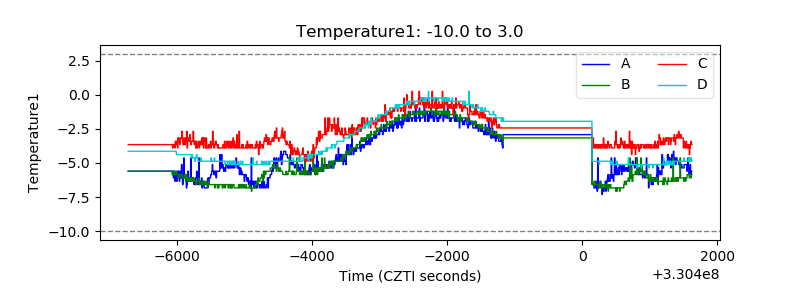 |
| Veto HV Monitor | 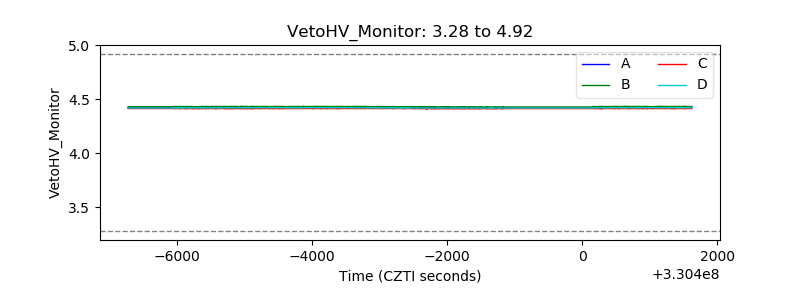 |
| Veto LLD | 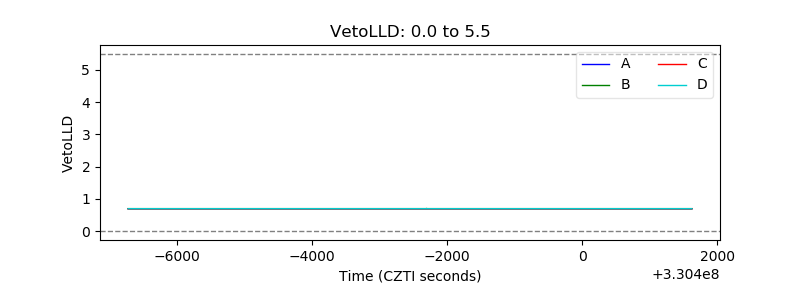 |
| Alpha Counter | 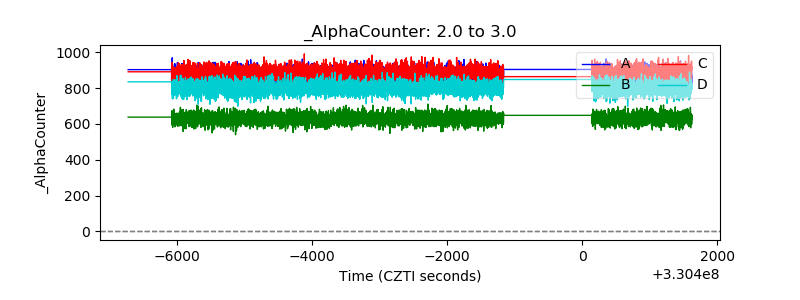 |
| _CPM_Rate | 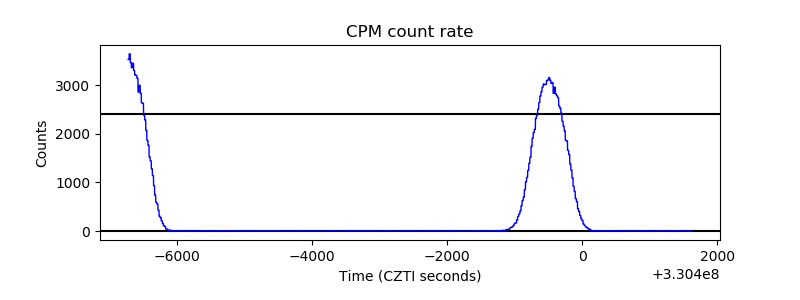 |
| CZT Counter |  |
| +2.5 Volts monitor |  |
| +5 Volts monitor |  |
| _ROLL_ROT | 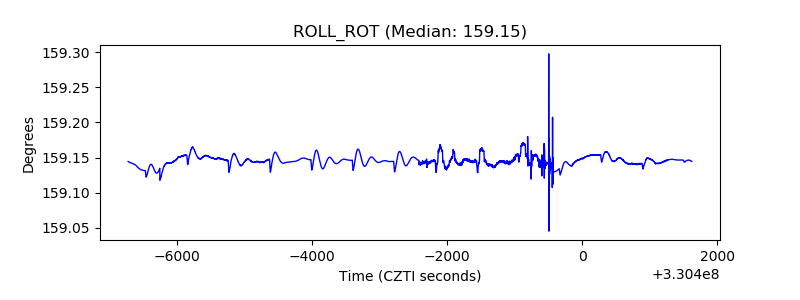 |
| _Roll_DEC | 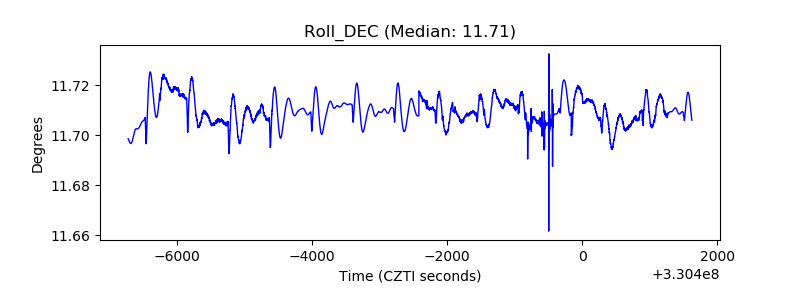 |
| _Roll_RA | 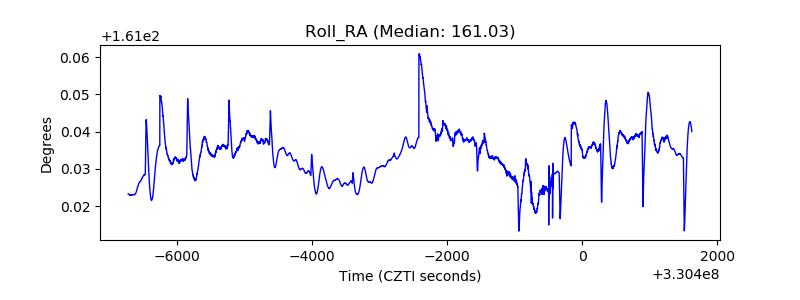 |
| Veto Counter | 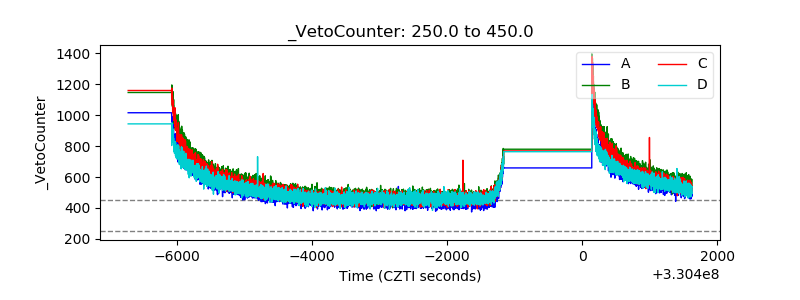 |