| Param | Original file | Final file |
|---|---|---|
| Filename | modeM0/AS1A09_043T02_9000003726_25580cztM0_level2.evt | modeM0/AS1A09_043T02_9000003726_25580cztM0_level2_quad_clean.evt |
| Size (bytes) | 1,784,099,520 | 311,417,280 |
| Size | 1.7 GB | 297.0 MB |
| Events in quadrant A | 11,777,984 | 2,051,933 |
| Events in quadrant B | 12,153,526 | 2,074,820 |
| Events in quadrant C | 11,597,776 | 1,924,223 |
| Events in quadrant D | 17,001,968 | 1,849,914 |
| Mode M0 | |||
|---|---|---|---|
| Quadrant | BADHDUFLAG | Total packets | Discarded packets |
| A | 0 | 47846 | 0 |
| B | 0 | 48947 | 0 |
| C | 0 | 47378 | 0 |
| D | 0 | 65019 | 0 |
| Mode M9 | |||
|---|---|---|---|
| Quadrant | BADHDUFLAG | Total packets | Discarded packets |
| A | 0 | 43 | 0 |
| B | 0 | 44 | 0 |
| C | 0 | 44 | 0 |
| D | 0 | 44 | 0 |
| Quadrant | Total seconds | Saturated seconds | Saturation percentage |
|---|---|---|---|
| A | 22248 | 425 | 1.910284% |
| B | 22248 | 486 | 2.184466% |
| C | 22248 | 514 | 2.310320% |
| D | 22248 | 1018 | 4.575692% |
Noise dominated data is calculated using 1-second bins in cleaned event files. If a bin has >2000 counts, and if more than 50% of those come from <1% of pixels, then it is considered to be noise-dominated and hence unusable.
| Quadrant | # 1 sec bins | Bins with >0 counts | Bins with >2000 counts | High rate bins dominated by noise | Noise dominated (total time) | Noise dominated (detector-on time) | Marked lightcurve |
|---|---|---|---|---|---|---|---|
| A | 26444 | 22253 | 4 | 4 | 0.02% | 0.02% | 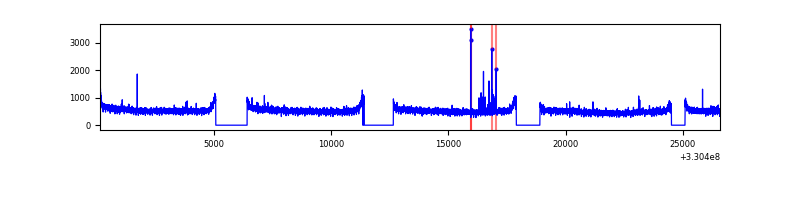 |
| B | 26444 | 22253 | 0 | 0 | 0.00% | 0.00% | 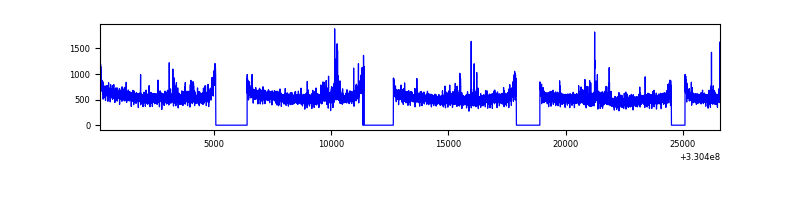 |
| C | 26444 | 22253 | 1 | 1 | 0.00% | 0.00% | 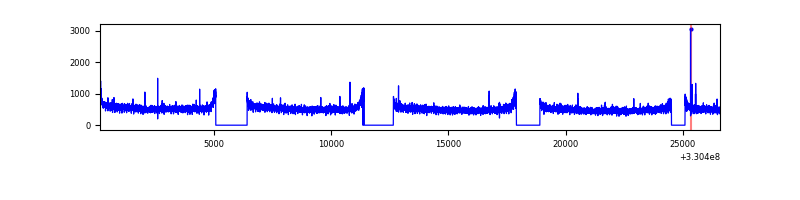 |
| D | 26444 | 22253 | 717 | 717 | 2.71% | 3.22% | 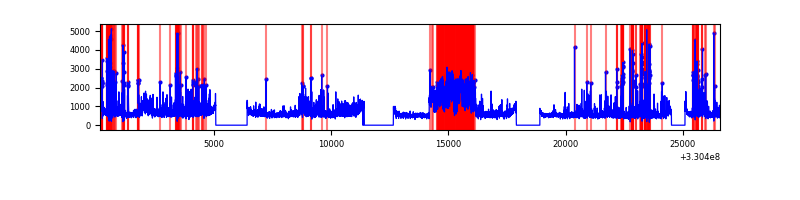 |
Top three noisy pixels from each quadrant. If the there are fewer than three noisy pixels in the level2.evt file, extra rows are filled as -1
| Pixel properties | Quadrant properties | ||||||
|---|---|---|---|---|---|---|---|
| Quadrant | DetID | PixID | Counts | Sigma | Mean | Median | Sigma |
| A | 13 | 254 | 35864 | 54.62 | 3040 | 2994 | 601.8 |
| A | 15 | 173 | 26607 | 39.24 | 3040 | 2994 | 601.8 |
| A | 0 | 226 | 26251 | 38.64 | 3040 | 2994 | 601.8 |
| B | 15 | 33 | 131228 | 229.75 | 3002 | 2935 | 558.4 |
| B | 0 | 219 | 119890 | 209.45 | 3002 | 2935 | 558.4 |
| B | 0 | 190 | 93089 | 161.45 | 3002 | 2935 | 558.4 |
| C | 14 | 238 | 457449 | 687.9 | 2843 | 2866 | 660.8 |
| C | 3 | 233 | 45403 | 64.37 | 2843 | 2866 | 660.8 |
| C | 2 | 16 | 22484 | 29.69 | 2843 | 2866 | 660.8 |
| D | 1 | 52 | 2368875 | 3424.2 | 2879 | 2801 | 691.0 |
| D | 7 | 238 | 2207658 | 3190.89 | 2879 | 2801 | 691.0 |
| D | 8 | 195 | 918363 | 1325.01 | 2879 | 2801 | 691.0 |
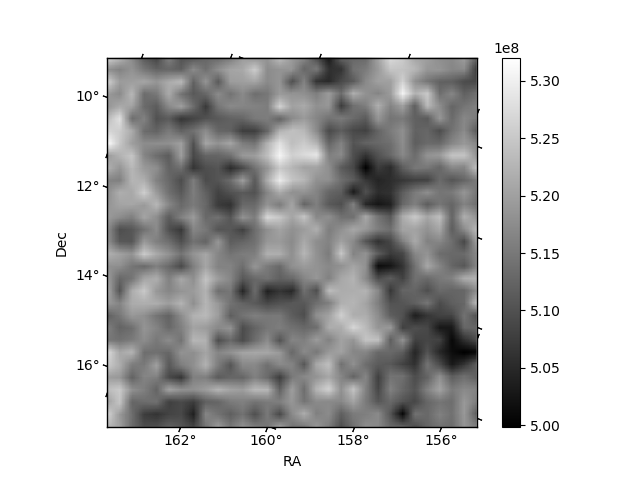
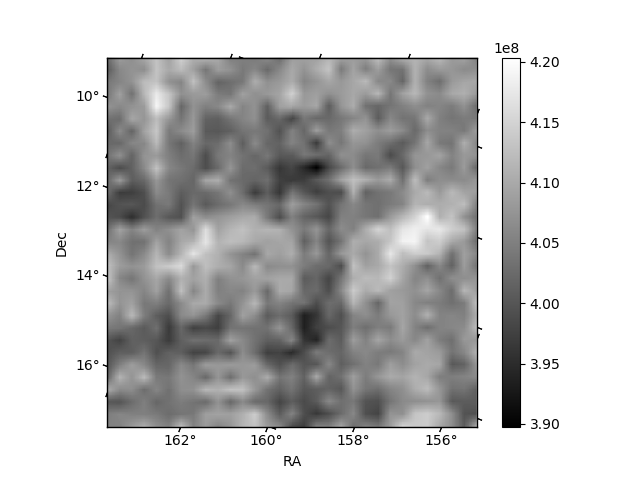
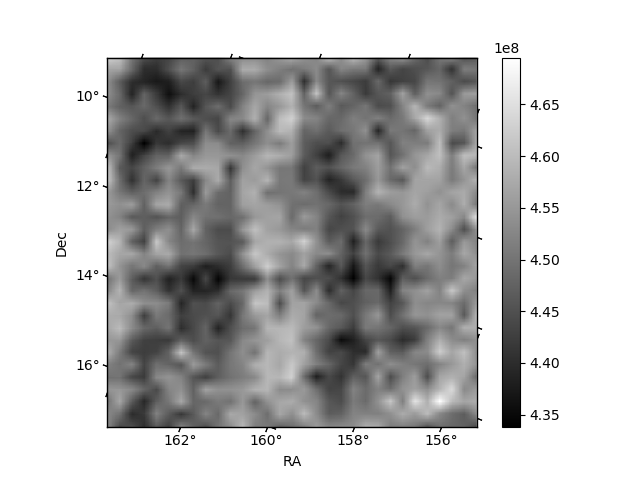
Histogram calculated using DETX and DETY for each event in the final _common_clean file
| Quadrant A | 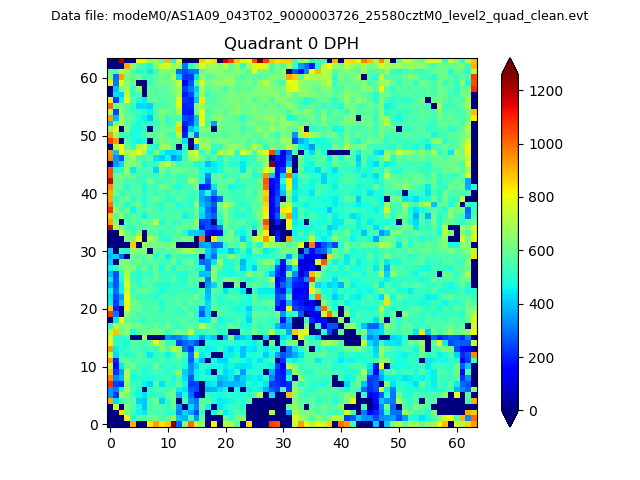 |
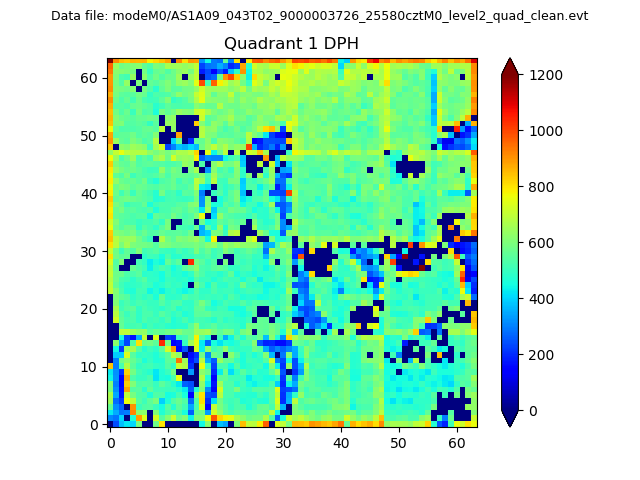 |
Quadrant B |
|---|---|---|---|
| Quadrant D | 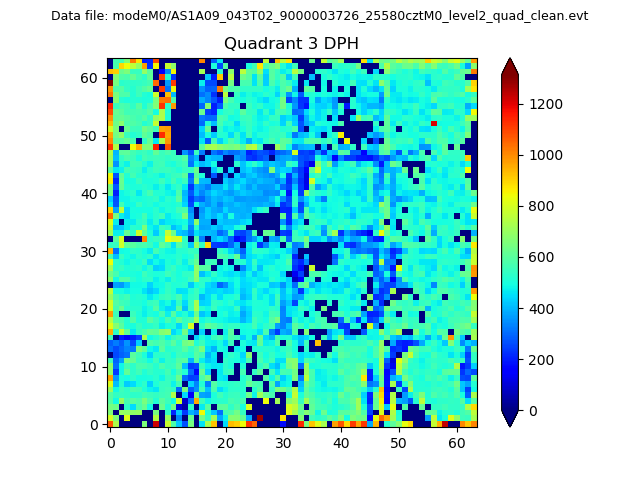 |
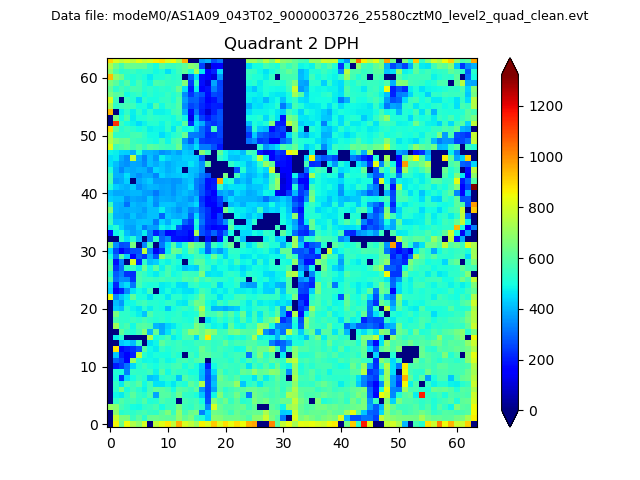 |
Quadrant C |
| Plot type | Count rate plots | Images |
|---|---|---|
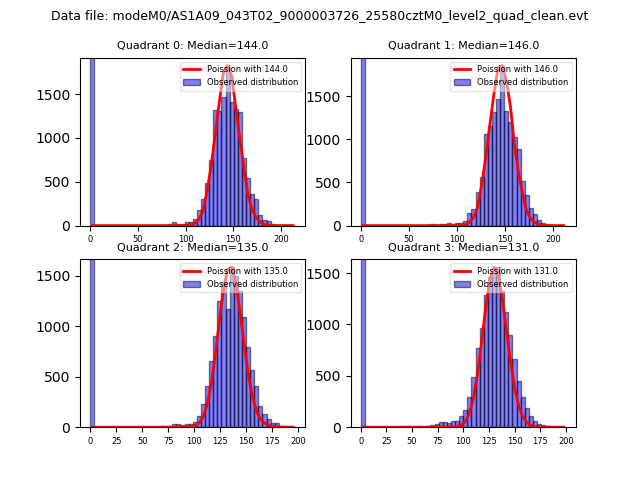
| Comparison with Poisson distribution Blue bars denote a histogram of data divided into 1 sec bins. Red curve is a Poisson curve with rate = median count rate of data. |
 |
 |
| Quadrant-wise count rates Data is divided into 100 sec bins |
 |
|
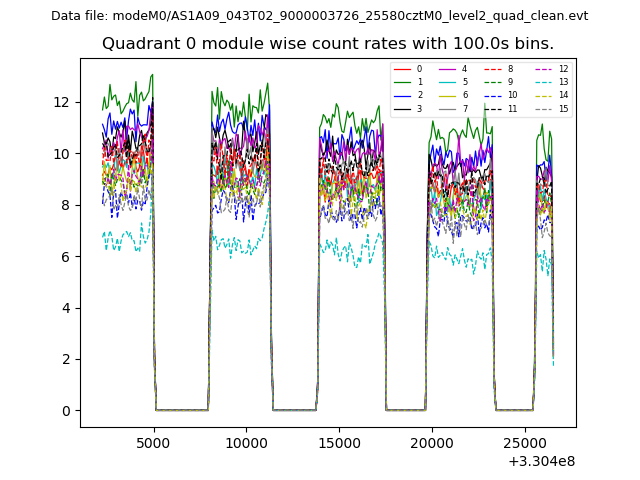
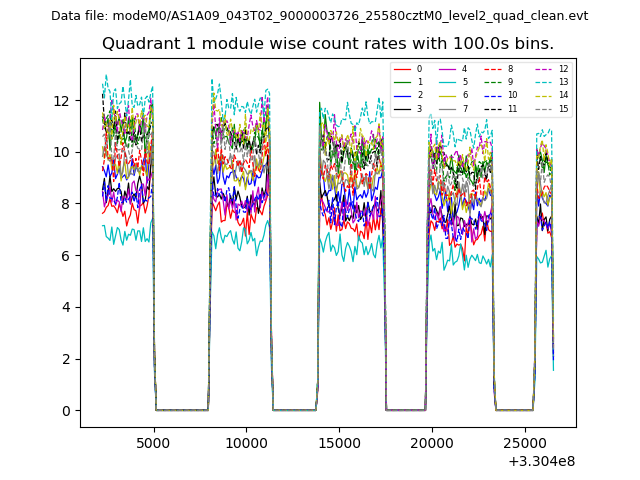
| Module-wise count rates for Quadrant A Data is divided into 100 sec bins |
 |
 |
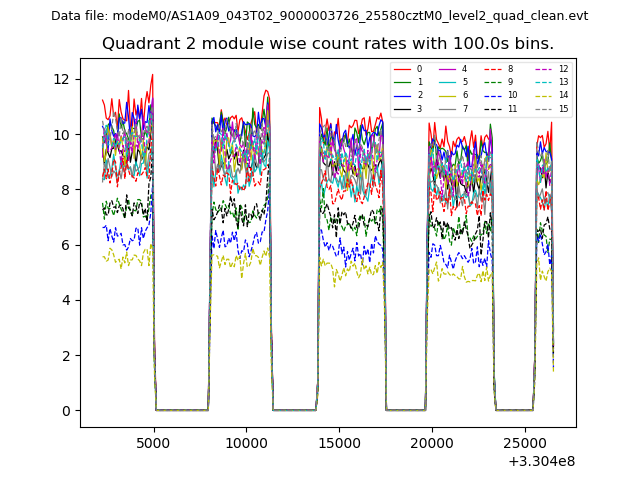
| Module-wise count rates for Quadrant B Data is divided into 100 sec bins |
 |
 |
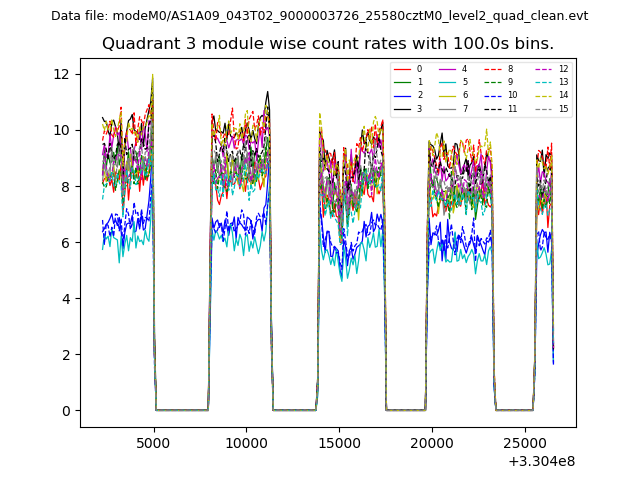
| Module-wise count rates for Quadrant C Data is divided into 100 sec bins |
 |
 |
| Module-wise count rates for Quadrant D Data is divided into 100 sec bins |
 |
 |
| Parameter | Plot |
|---|---|
| CZT HV Monitor | 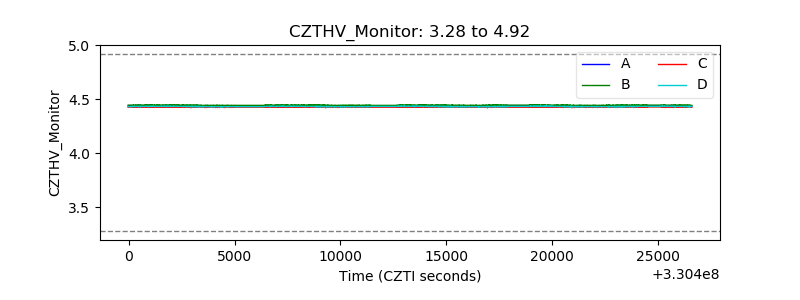 |
| D_VDD | 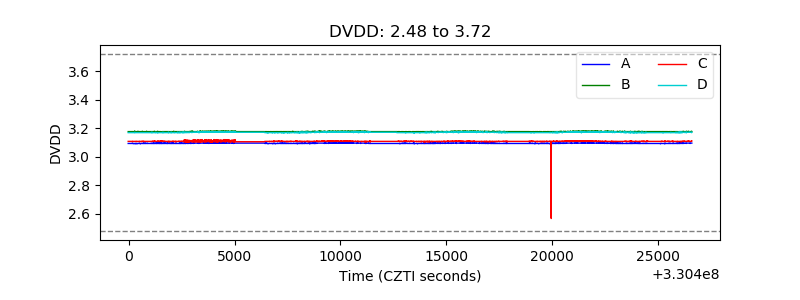 |
| Temperature 1 | 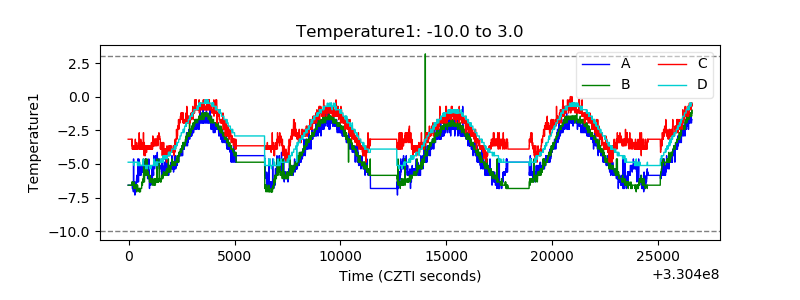 |
| Veto HV Monitor | 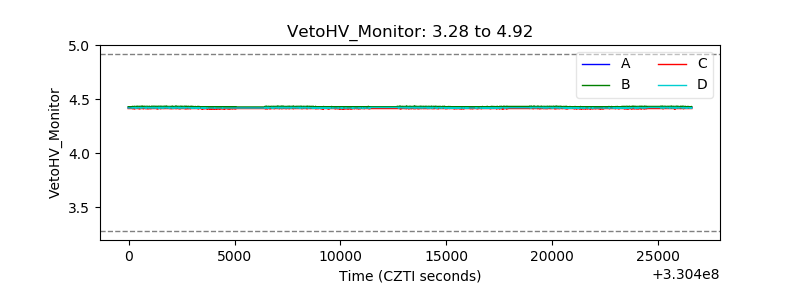 |
| Veto LLD | 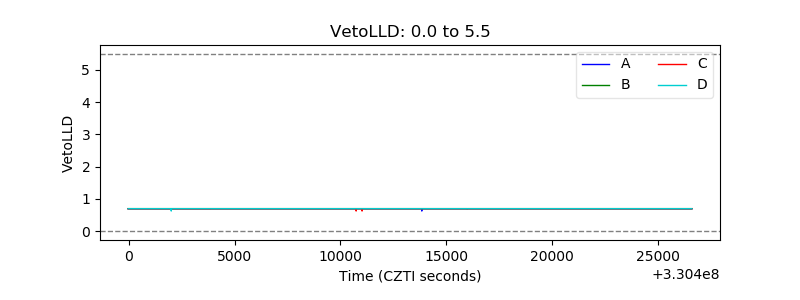 |
| Alpha Counter | 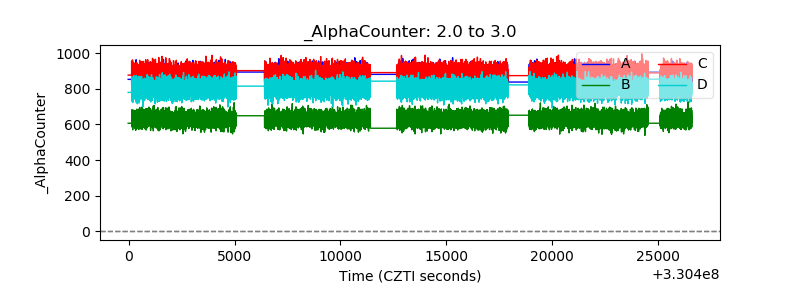 |
| _CPM_Rate | 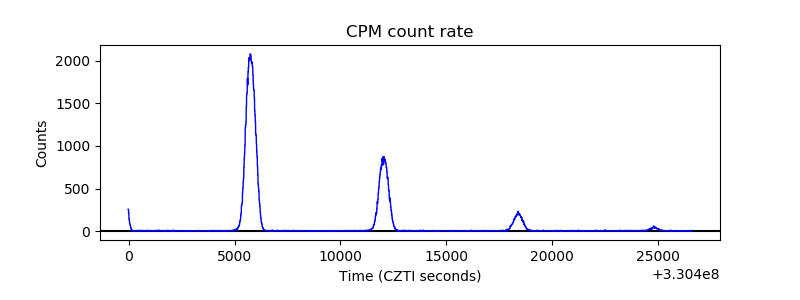 |
| CZT Counter | 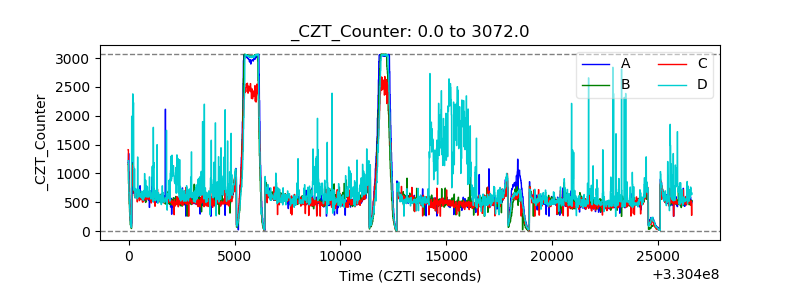 |
| +2.5 Volts monitor |  |
| +5 Volts monitor |  |
| _ROLL_ROT | 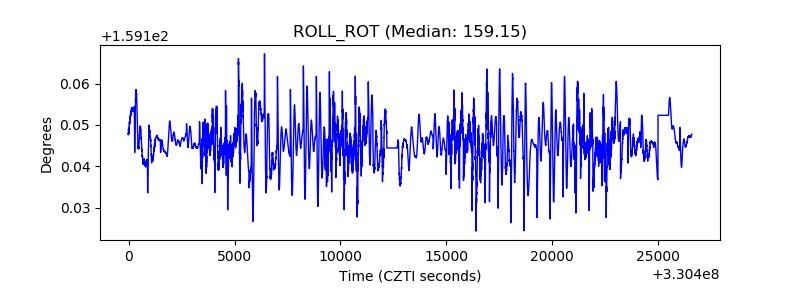 |
| _Roll_DEC | 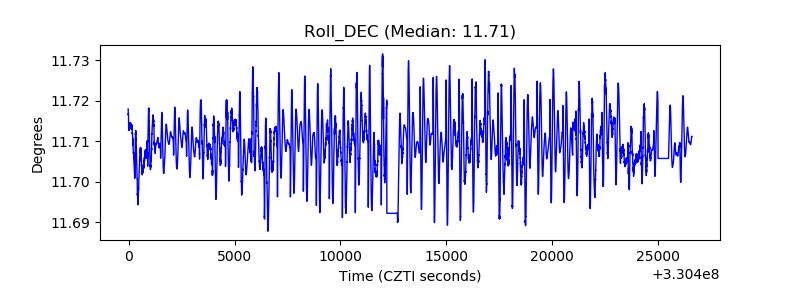 |
| _Roll_RA | 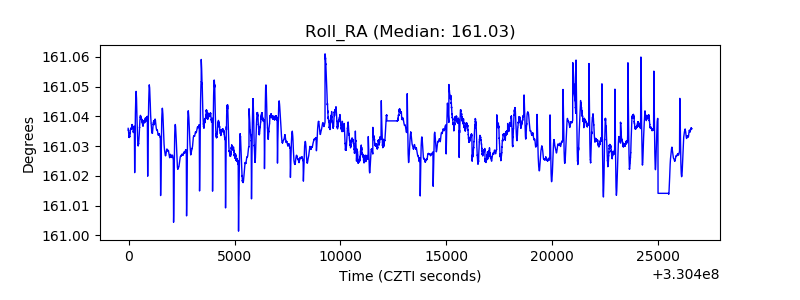 |
| Veto Counter | 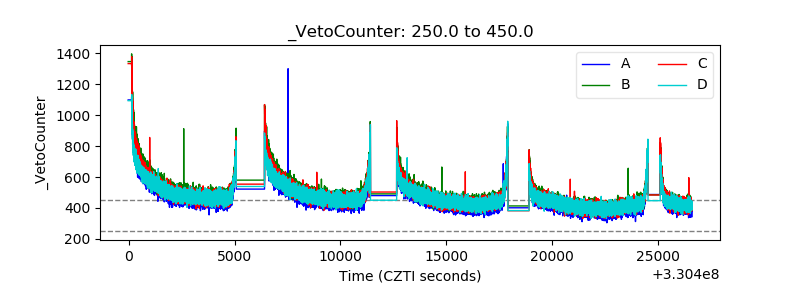 |