| Param | Original file | Final file |
|---|---|---|
| Filename | modeM0/AS1A09_043T02_9000003726_25581cztM0_level2.evt | modeM0/AS1A09_043T02_9000003726_25581cztM0_level2_quad_clean.evt |
| Size (bytes) | 596,692,800 | 103,890,240 |
| Size | 569.1 MB | 99.1 MB |
| Events in quadrant A | 4,073,363 | 671,435 |
| Events in quadrant B | 4,062,985 | 677,386 |
| Events in quadrant C | 3,887,878 | 640,333 |
| Events in quadrant D | 5,521,345 | 618,265 |
| Mode M0 | |||
|---|---|---|---|
| Quadrant | BADHDUFLAG | Total packets | Discarded packets |
| A | 0 | 16804 | 0 |
| B | 0 | 16607 | 0 |
| C | 0 | 16318 | 0 |
| D | 0 | 21316 | 0 |
| Mode M9 | |||
|---|---|---|---|
| Quadrant | BADHDUFLAG | Total packets | Discarded packets |
| A | 0 | 4 | 0 |
| B | 0 | 5 | 0 |
| C | 0 | 5 | 0 |
| D | 0 | 5 | 0 |
| Quadrant | Total seconds | Saturated seconds | Saturation percentage |
|---|---|---|---|
| A | 7744 | 280 | 3.615702% |
| B | 7743 | 270 | 3.487021% |
| C | 7743 | 276 | 3.564510% |
| D | 7743 | 428 | 5.527573% |
Noise dominated data is calculated using 1-second bins in cleaned event files. If a bin has >2000 counts, and if more than 50% of those come from <1% of pixels, then it is considered to be noise-dominated and hence unusable.
| Quadrant | # 1 sec bins | Bins with >0 counts | Bins with >2000 counts | High rate bins dominated by noise | Noise dominated (total time) | Noise dominated (detector-on time) | Marked lightcurve |
|---|---|---|---|---|---|---|---|
| A | 7954 | 7746 | 44 | 44 | 0.55% | 0.57% | 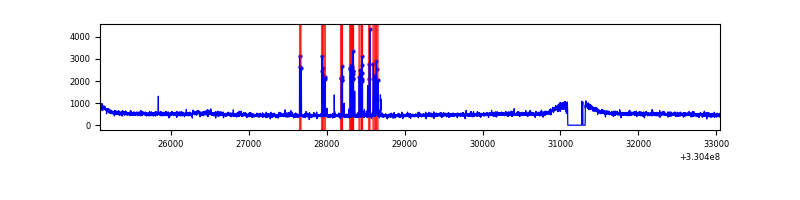 |
| B | 7953 | 7745 | 1 | 1 | 0.01% | 0.01% | 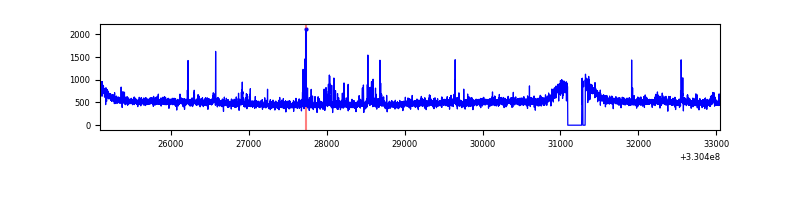 |
| C | 7953 | 7745 | 3 | 3 | 0.04% | 0.04% | 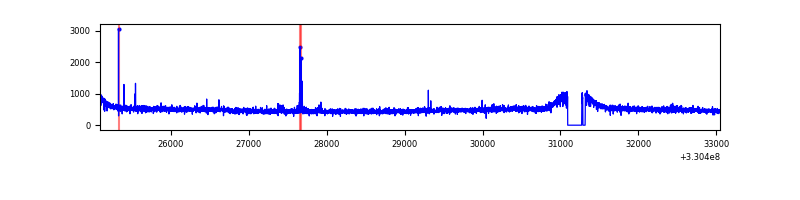 |
| D | 7953 | 7745 | 206 | 206 | 2.59% | 2.66% | 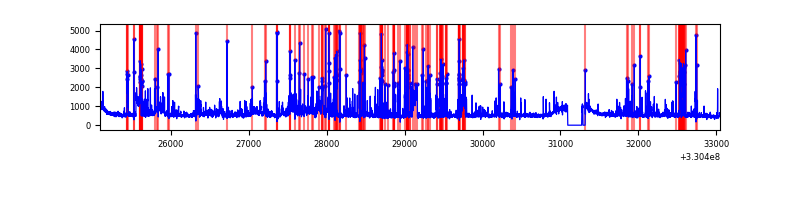 |
Top three noisy pixels from each quadrant. If the there are fewer than three noisy pixels in the level2.evt file, extra rows are filled as -1
| Pixel properties | Quadrant properties | ||||||
|---|---|---|---|---|---|---|---|
| Quadrant | DetID | PixID | Counts | Sigma | Mean | Median | Sigma |
| A | 4 | 2 | 188477 | 921.39 | 1000 | 979 | 203.5 |
| A | 0 | 13 | 27894 | 132.26 | 1000 | 979 | 203.5 |
| A | 13 | 254 | 13420 | 61.14 | 1000 | 979 | 203.5 |
| B | 3 | 112 | 54724 | 280.85 | 987 | 962 | 191.4 |
| B | 0 | 219 | 54325 | 278.77 | 987 | 962 | 191.4 |
| B | 0 | 190 | 48567 | 248.69 | 987 | 962 | 191.4 |
| C | 14 | 238 | 151632 | 673.08 | 946 | 951 | 223.9 |
| C | 2 | 16 | 23140 | 99.12 | 946 | 951 | 223.9 |
| C | 0 | 207 | 16744 | 70.55 | 946 | 951 | 223.9 |
| D | 1 | 52 | 1325640 | 5642.43 | 959 | 931 | 234.8 |
| D | 8 | 195 | 376861 | 1601.23 | 959 | 931 | 234.8 |
| D | 13 | 174 | 94679 | 399.31 | 959 | 931 | 234.8 |
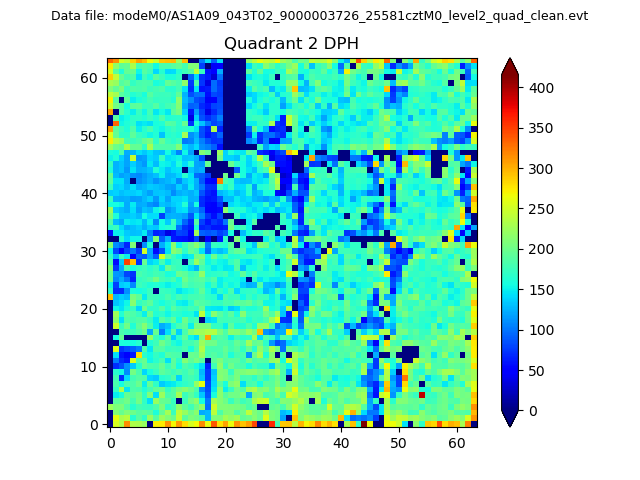
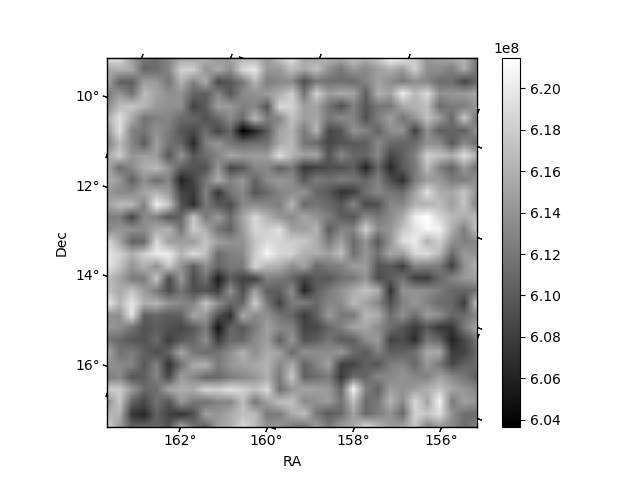
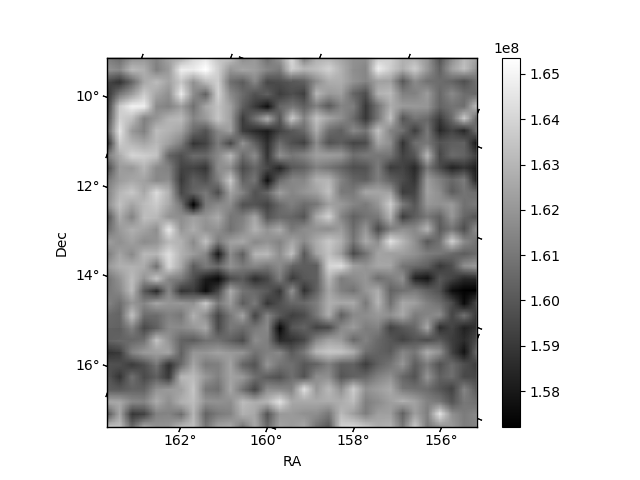
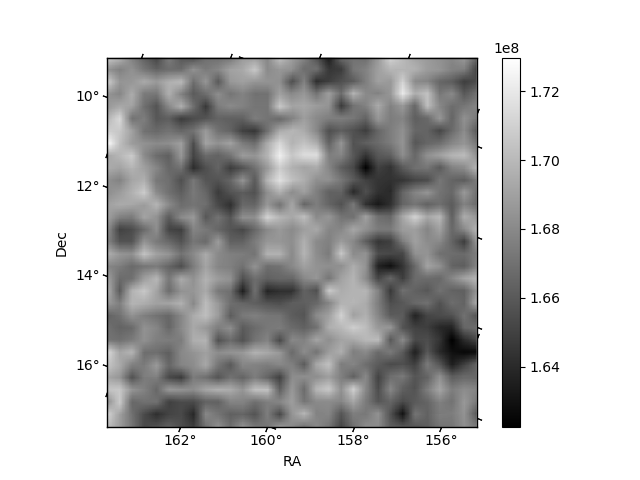
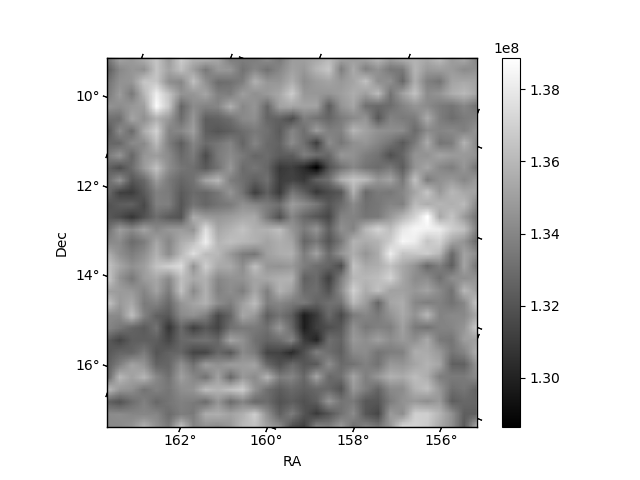
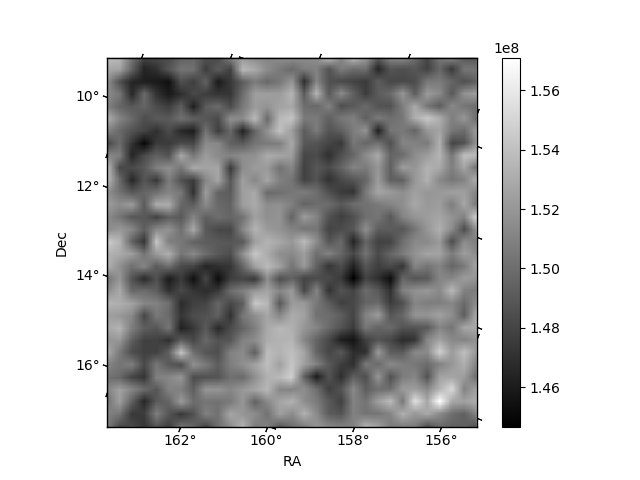
Histogram calculated using DETX and DETY for each event in the final _common_clean file
| Quadrant A | 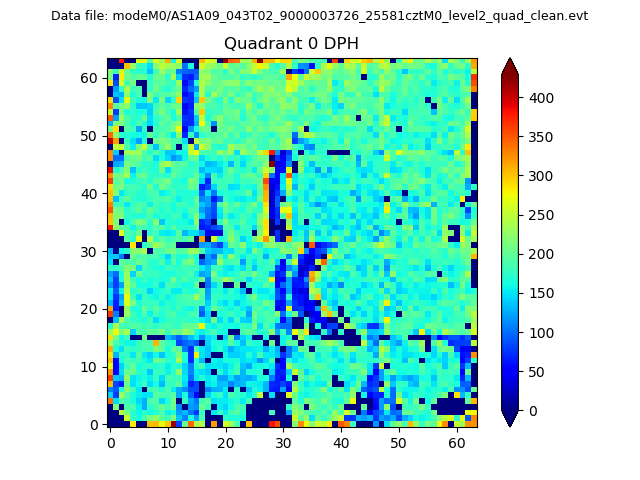 |
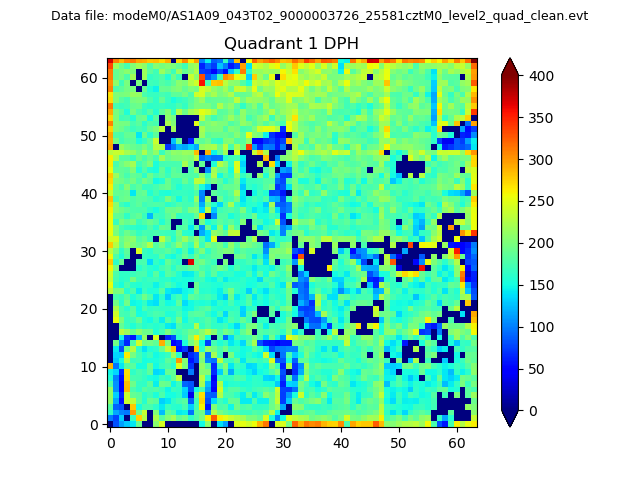 |
Quadrant B |
|---|---|---|---|
| Quadrant D | 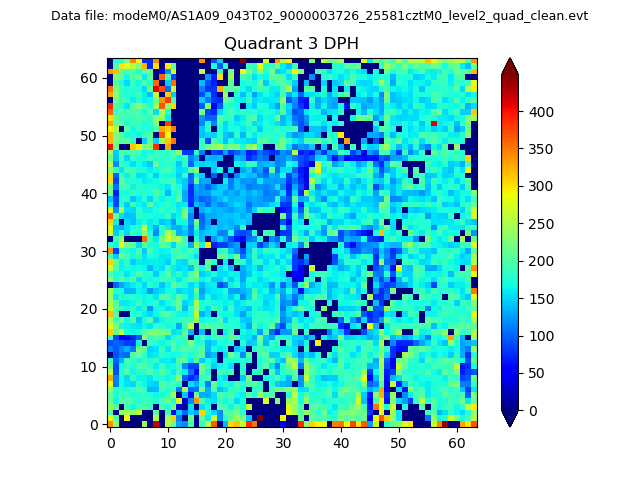 |
 |
Quadrant C |
| Plot type | Count rate plots | Images |
|---|---|---|
| Comparison with Poisson distribution Blue bars denote a histogram of data divided into 1 sec bins. Red curve is a Poisson curve with rate = median count rate of data. |
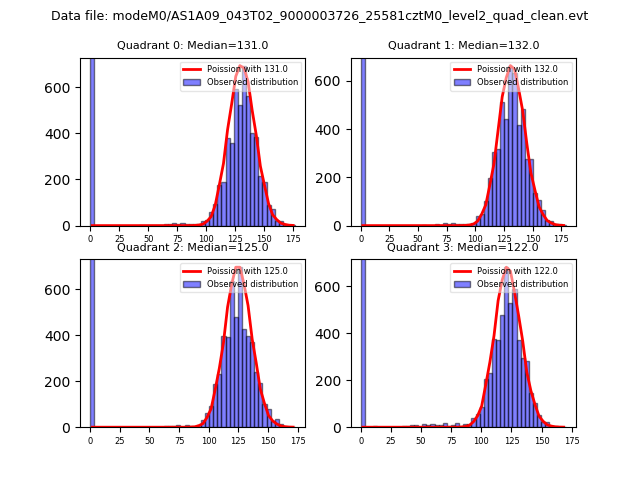 |
 |
| Quadrant-wise count rates Data is divided into 100 sec bins |
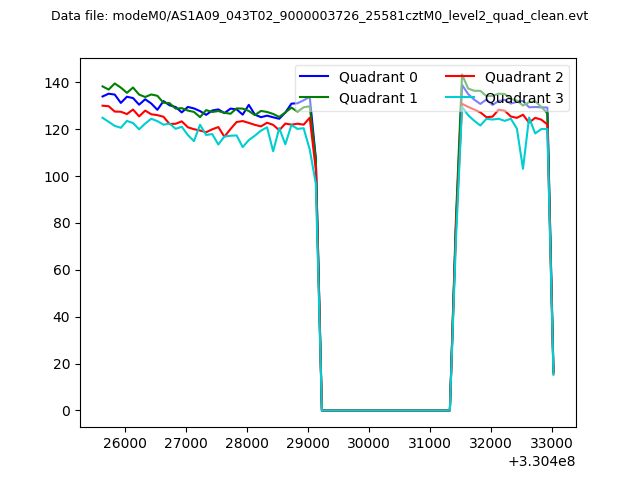 |
|
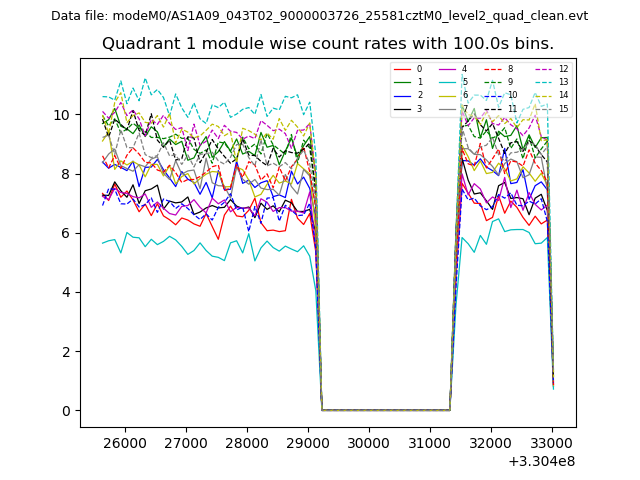
| Module-wise count rates for Quadrant A Data is divided into 100 sec bins |
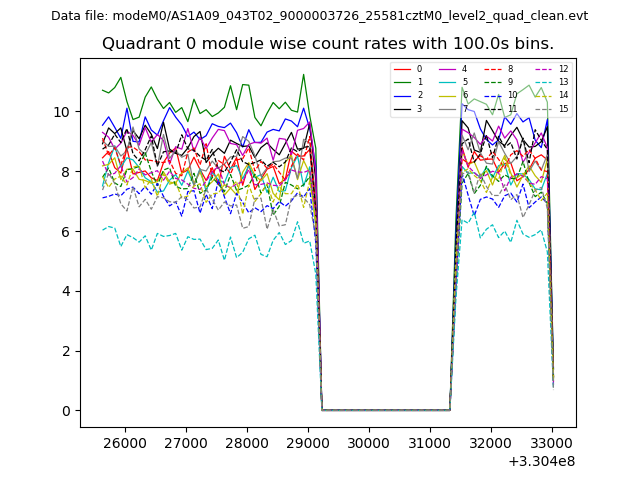 |
 |
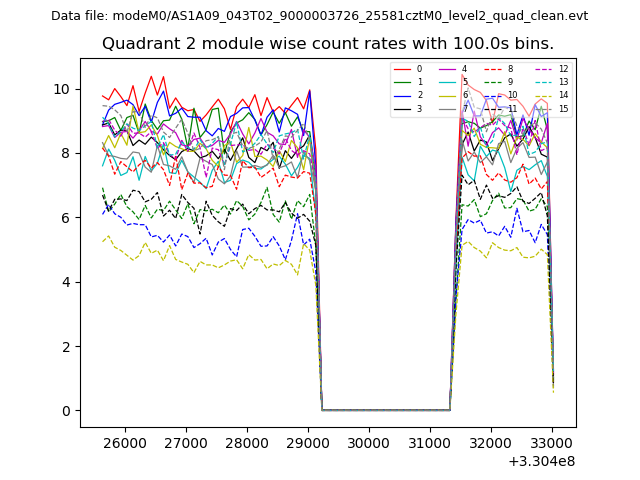
| Module-wise count rates for Quadrant B Data is divided into 100 sec bins |
 |
 |
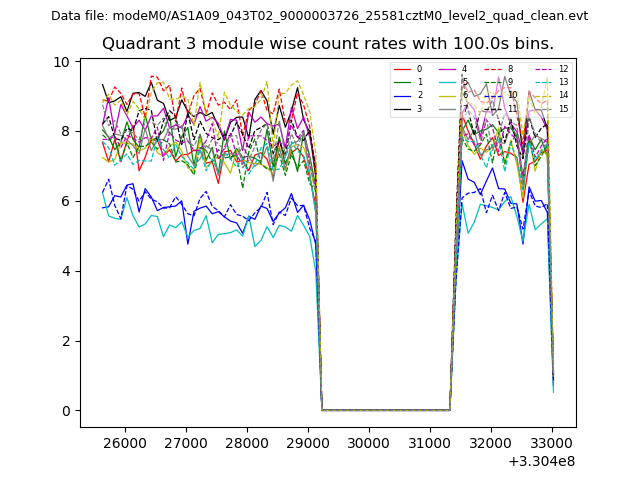
| Module-wise count rates for Quadrant C Data is divided into 100 sec bins |
 |
 |
| Module-wise count rates for Quadrant D Data is divided into 100 sec bins |
 |
 |
| Parameter | Plot |
|---|---|
| CZT HV Monitor | 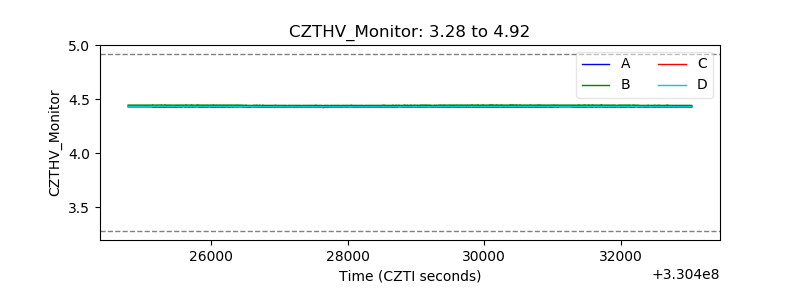 |
| D_VDD | 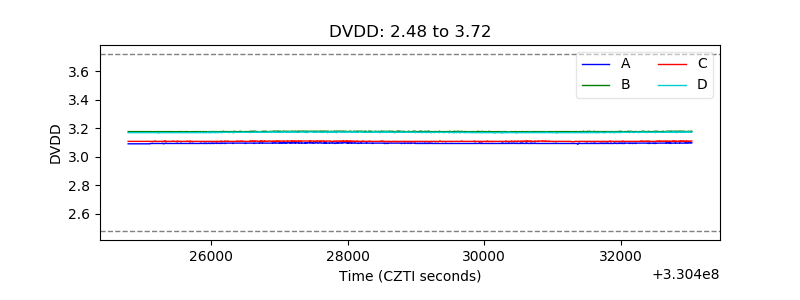 |
| Temperature 1 | 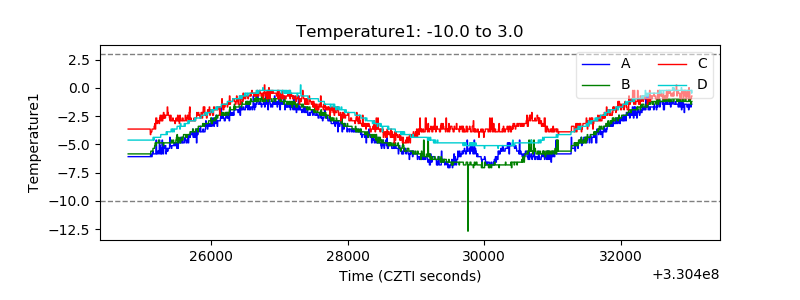 |
| Veto HV Monitor | 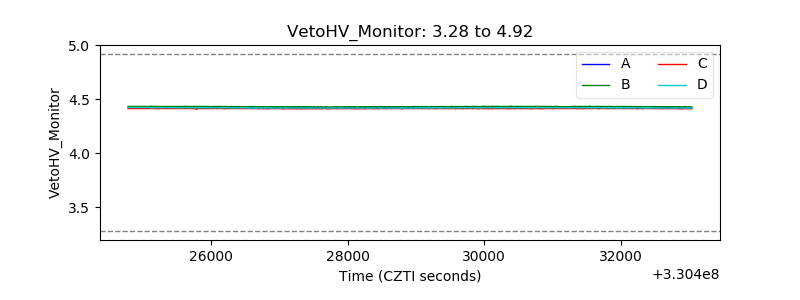 |
| Veto LLD | 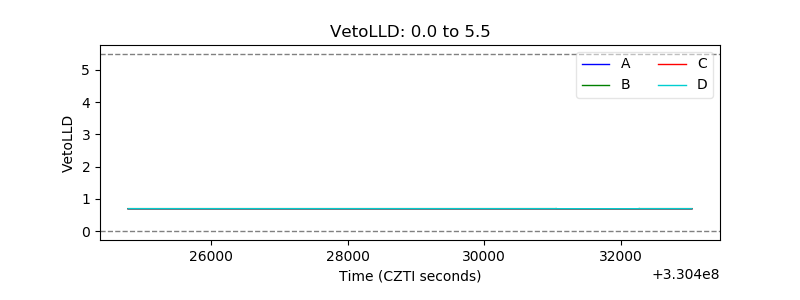 |
| Alpha Counter | 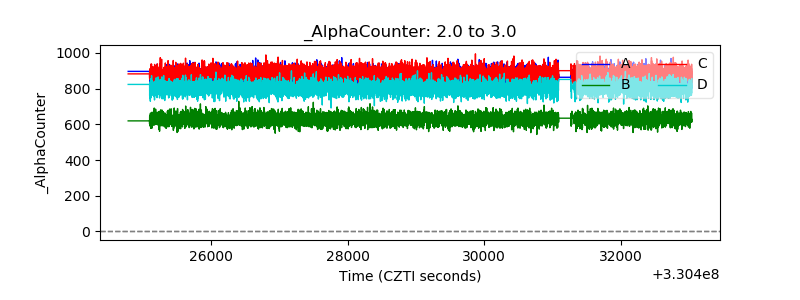 |
| _CPM_Rate | 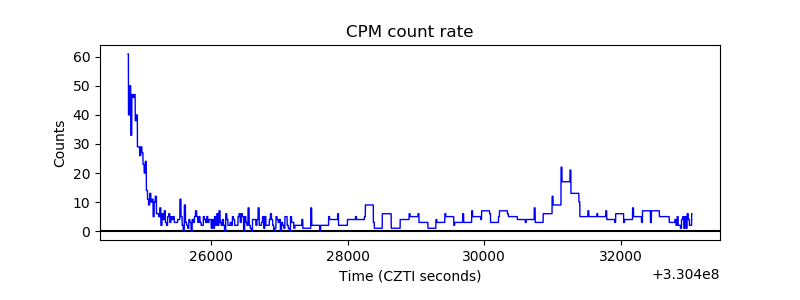 |
| CZT Counter | 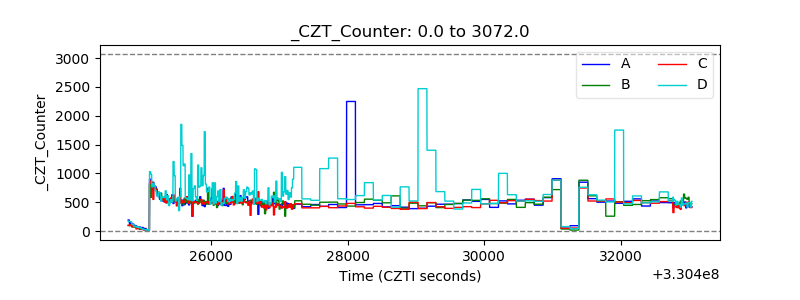 |
| +2.5 Volts monitor |  |
| +5 Volts monitor | 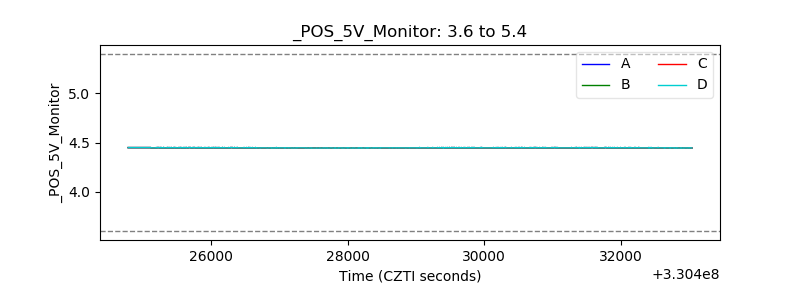 |
| _ROLL_ROT | 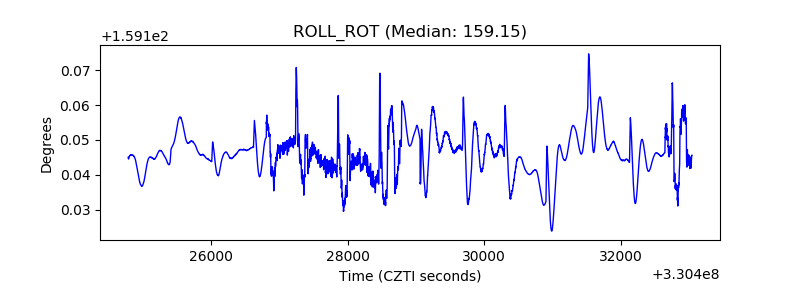 |
| _Roll_DEC | 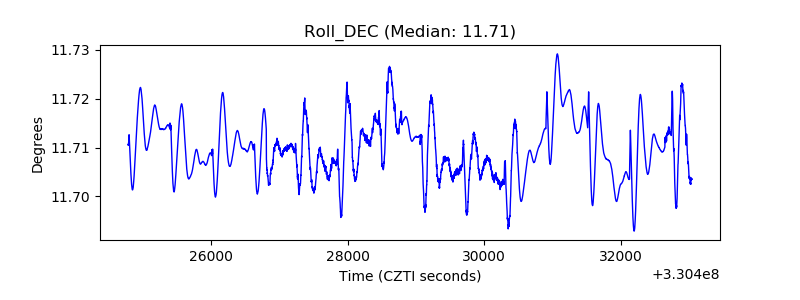 |
| _Roll_RA | 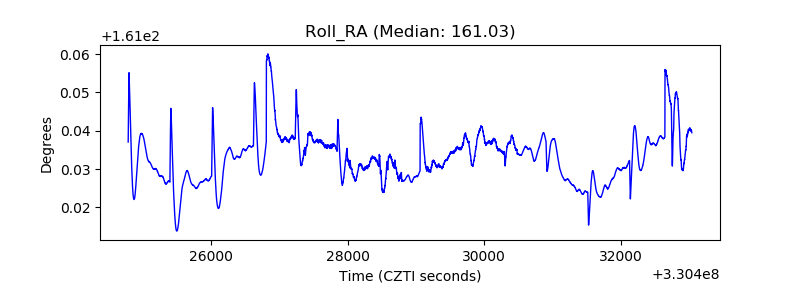 |
| Veto Counter | 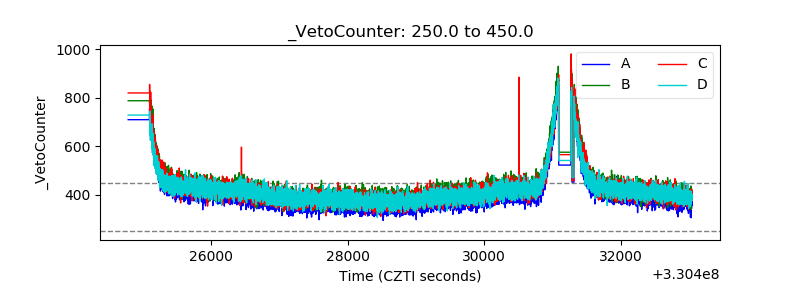 |