| Param | Original file | Final file |
|---|---|---|
| Filename | modeM0/AS1A09_043T02_9000003726_25585cztM0_level2.evt | modeM0/AS1A09_043T02_9000003726_25585cztM0_level2_quad_clean.evt |
| Size (bytes) | 1,263,971,520 | 221,544,000 |
| Size | 1.2 GB | 211.3 MB |
| Events in quadrant A | 8,356,260 | 1,411,416 |
| Events in quadrant B | 8,963,696 | 1,420,894 |
| Events in quadrant C | 8,828,520 | 1,338,850 |
| Events in quadrant D | 10,935,891 | 1,319,533 |
| Mode M0 | |||
|---|---|---|---|
| Quadrant | BADHDUFLAG | Total packets | Discarded packets |
| A | 0 | 36508 | 0 |
| B | 0 | 37794 | 0 |
| C | 0 | 37697 | 0 |
| D | 0 | 44167 | 0 |
| Mode M9 | |||
|---|---|---|---|
| Quadrant | BADHDUFLAG | Total packets | Discarded packets |
| A | 0 | 20 | 0 |
| B | 0 | 20 | 0 |
| C | 0 | 20 | 0 |
| D | 0 | 20 | 0 |
| Quadrant | Total seconds | Saturated seconds | Saturation percentage |
|---|---|---|---|
| A | 17694 | 104 | 0.587770% |
| B | 17694 | 153 | 0.864700% |
| C | 17694 | 274 | 1.548548% |
| D | 17694 | 162 | 0.915565% |
Noise dominated data is calculated using 1-second bins in cleaned event files. If a bin has >2000 counts, and if more than 50% of those come from <1% of pixels, then it is considered to be noise-dominated and hence unusable.
| Quadrant | # 1 sec bins | Bins with >0 counts | Bins with >2000 counts | High rate bins dominated by noise | Noise dominated (total time) | Noise dominated (detector-on time) | Marked lightcurve |
|---|---|---|---|---|---|---|---|
| A | 19619 | 17697 | 14 | 14 | 0.07% | 0.08% | 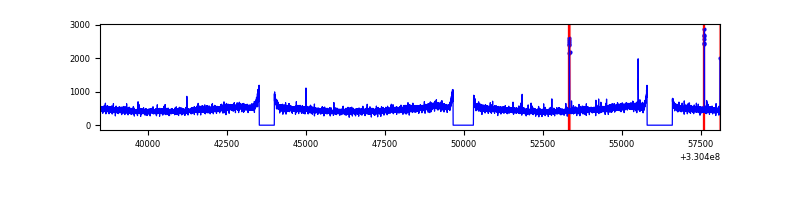 |
| B | 19619 | 17697 | 13 | 13 | 0.07% | 0.07% | 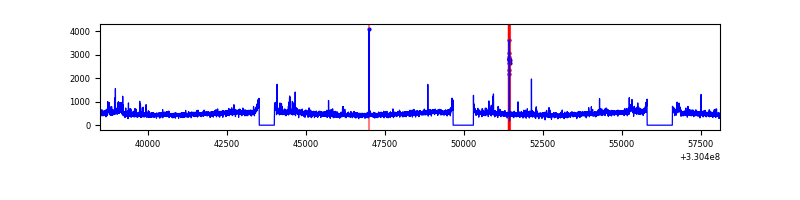 |
| C | 19619 | 17697 | 27 | 27 | 0.14% | 0.15% | 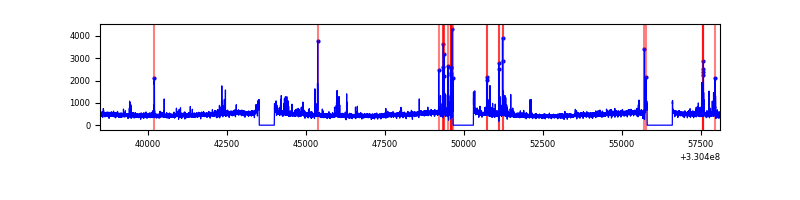 |
| D | 19619 | 17697 | 63 | 63 | 0.32% | 0.36% | 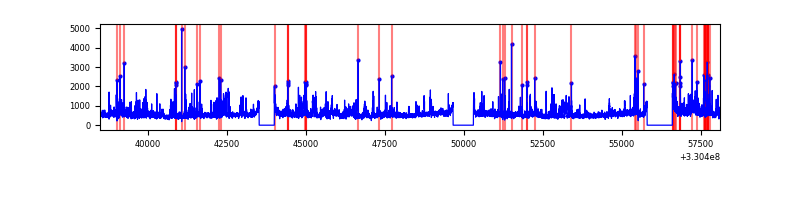 |
Top three noisy pixels from each quadrant. If the there are fewer than three noisy pixels in the level2.evt file, extra rows are filled as -1
| Pixel properties | Quadrant properties | ||||||
|---|---|---|---|---|---|---|---|
| Quadrant | DetID | PixID | Counts | Sigma | Mean | Median | Sigma |
| A | 6 | 16 | 55827 | 124.09 | 2149 | 2098 | 433.0 |
| A | 13 | 254 | 30627 | 65.89 | 2149 | 2098 | 433.0 |
| A | 3 | 137 | 19734 | 40.73 | 2149 | 2098 | 433.0 |
| B | 0 | 219 | 257946 | 628.04 | 2139 | 2089 | 407.4 |
| B | 15 | 33 | 116462 | 280.75 | 2139 | 2089 | 407.4 |
| B | 5 | 171 | 88031 | 210.96 | 2139 | 2089 | 407.4 |
| C | 14 | 238 | 326209 | 676.07 | 2043 | 2061 | 479.5 |
| C | 2 | 16 | 310127 | 642.53 | 2043 | 2061 | 479.5 |
| C | 0 | 207 | 165911 | 341.74 | 2043 | 2061 | 479.5 |
| D | 1 | 52 | 1294109 | 2518.47 | 2083 | 2024 | 513.0 |
| D | 8 | 195 | 1257724 | 2447.55 | 2083 | 2024 | 513.0 |
| D | 7 | 38 | 170239 | 327.88 | 2083 | 2024 | 513.0 |
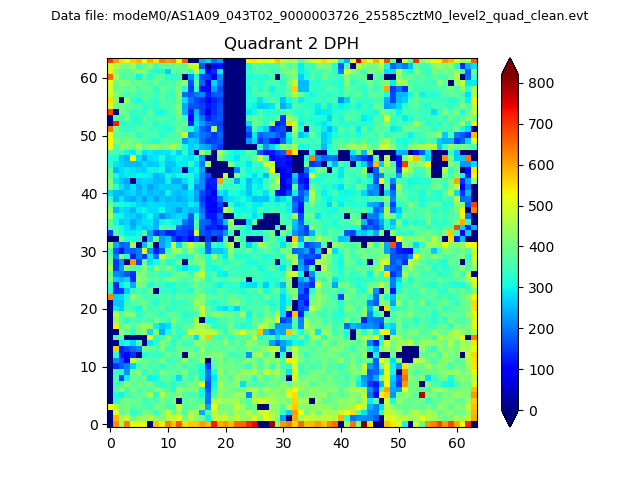
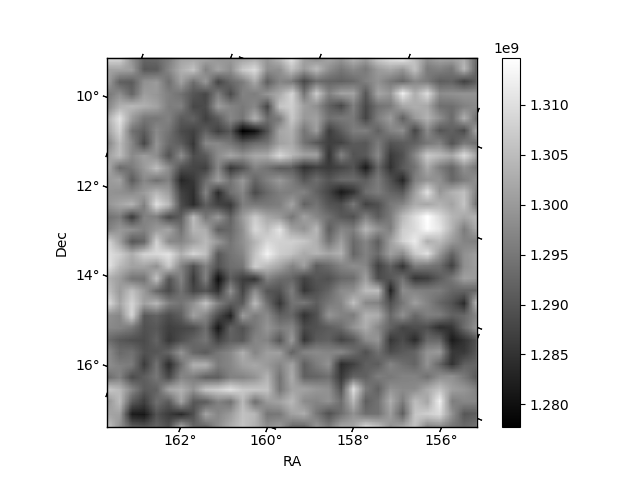
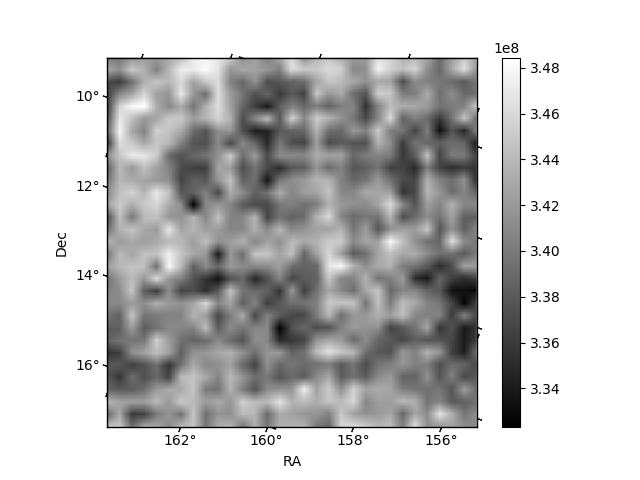
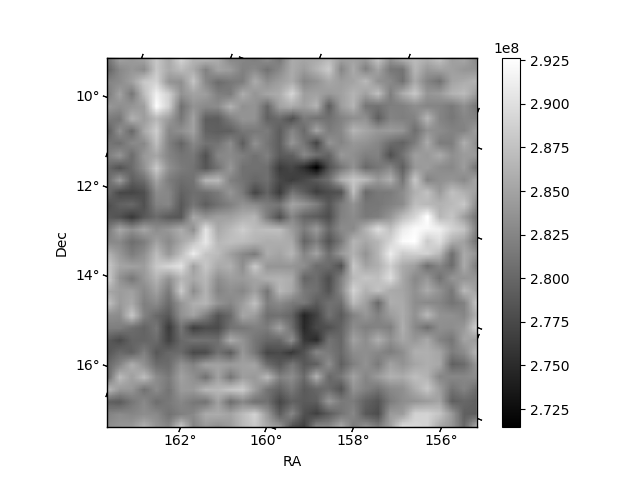
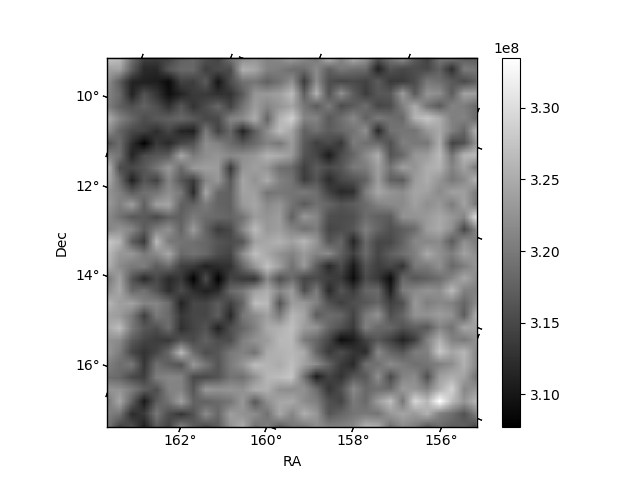
Histogram calculated using DETX and DETY for each event in the final _common_clean file
| Quadrant A | 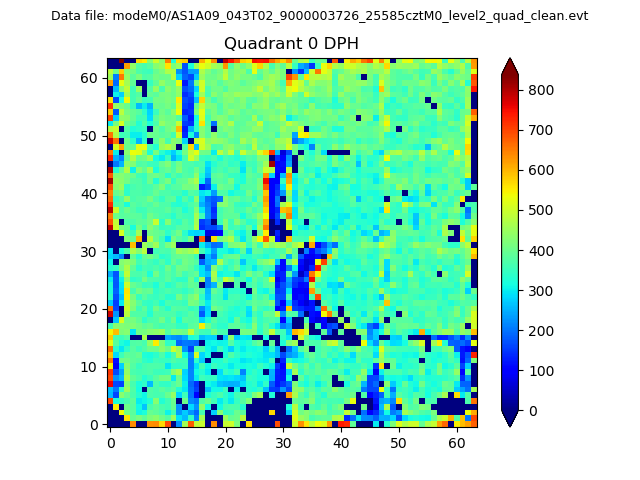 |
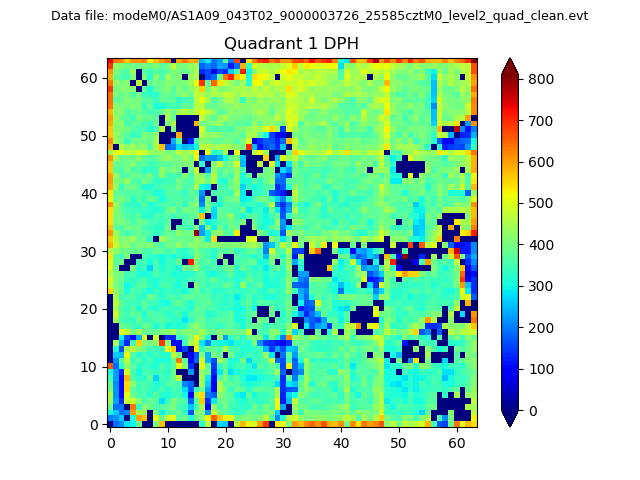 |
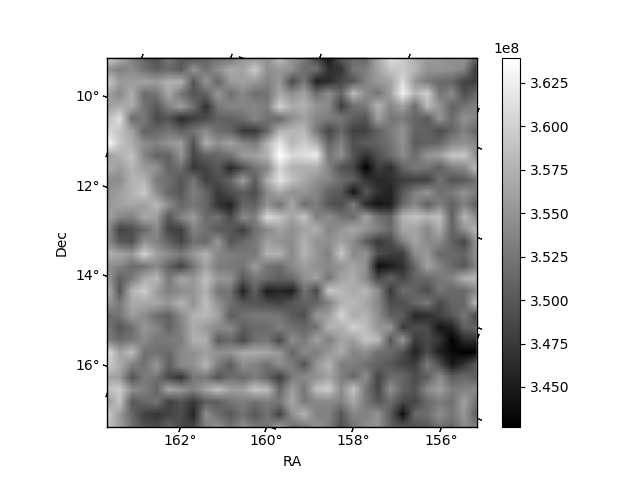
Quadrant B |
|---|---|---|---|
| Quadrant D | 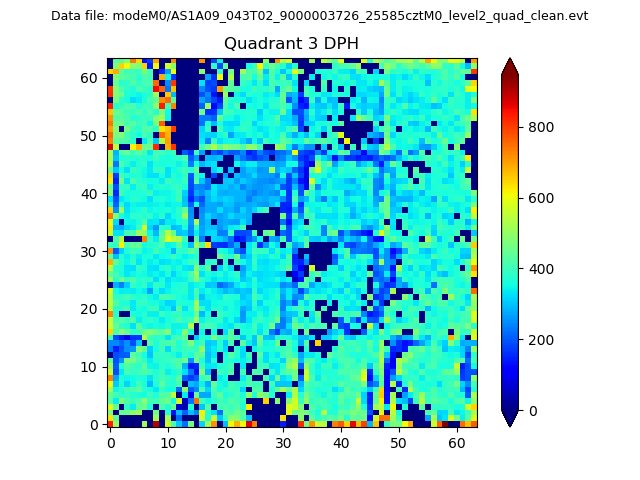 |
 |
Quadrant C |
| Plot type | Count rate plots | Images |
|---|---|---|
| Comparison with Poisson distribution Blue bars denote a histogram of data divided into 1 sec bins. Red curve is a Poisson curve with rate = median count rate of data. |
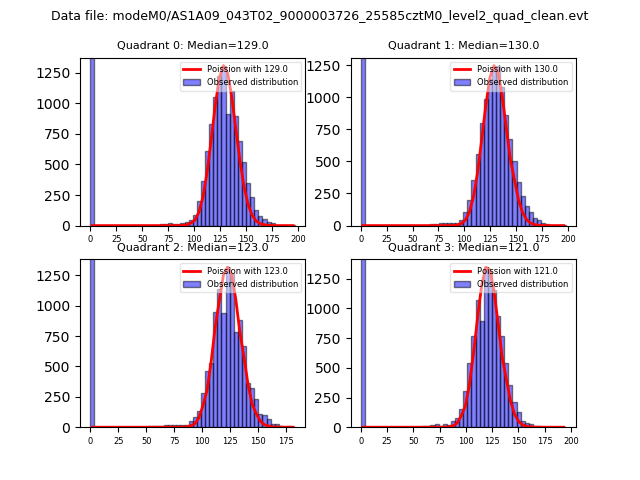 |
 |
| Quadrant-wise count rates Data is divided into 100 sec bins |
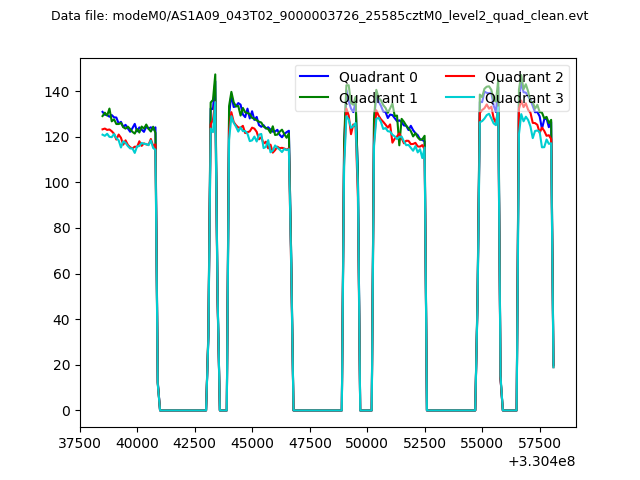 |
|
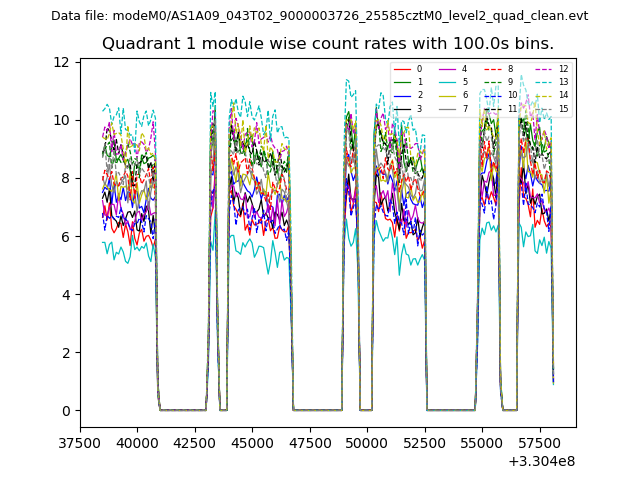
| Module-wise count rates for Quadrant A Data is divided into 100 sec bins |
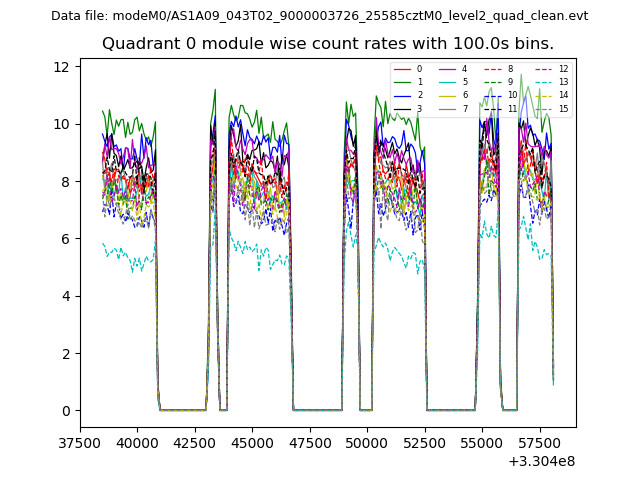 |
 |
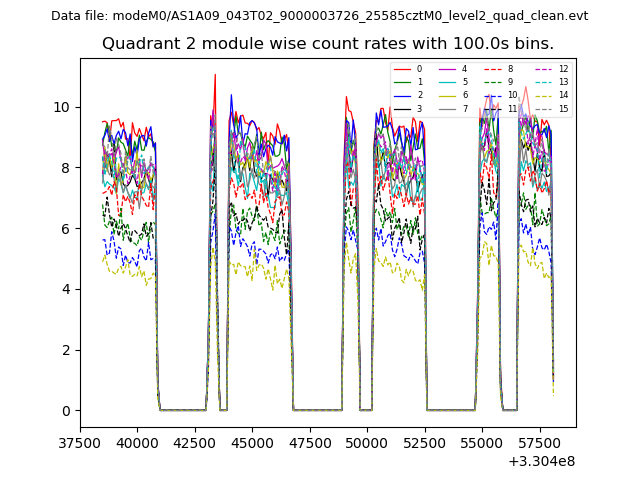
| Module-wise count rates for Quadrant B Data is divided into 100 sec bins |
 |
 |
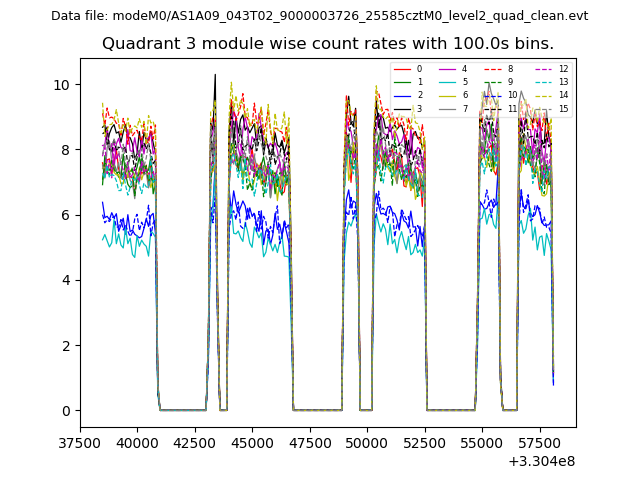
| Module-wise count rates for Quadrant C Data is divided into 100 sec bins |
 |
 |
| Module-wise count rates for Quadrant D Data is divided into 100 sec bins |
 |
 |
| Parameter | Plot |
|---|---|
| CZT HV Monitor | 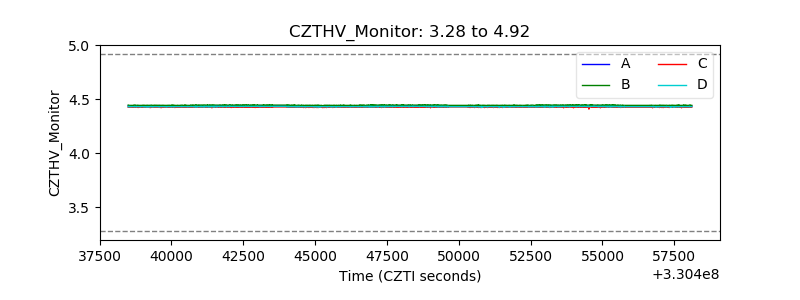 |
| D_VDD | 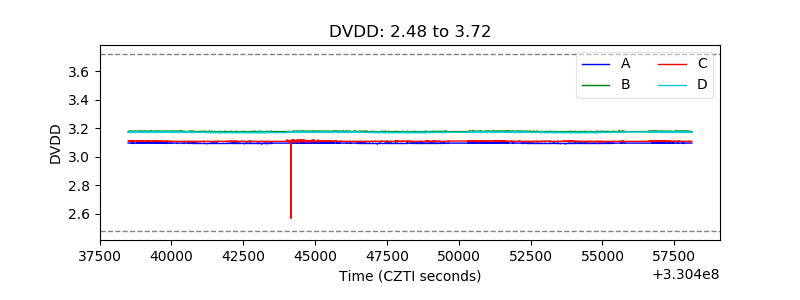 |
| Temperature 1 | 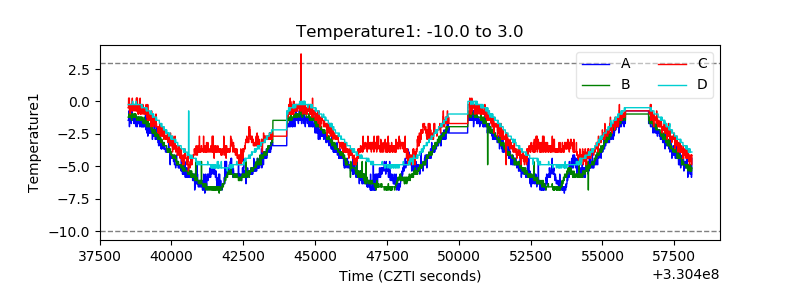 |
| Veto HV Monitor | 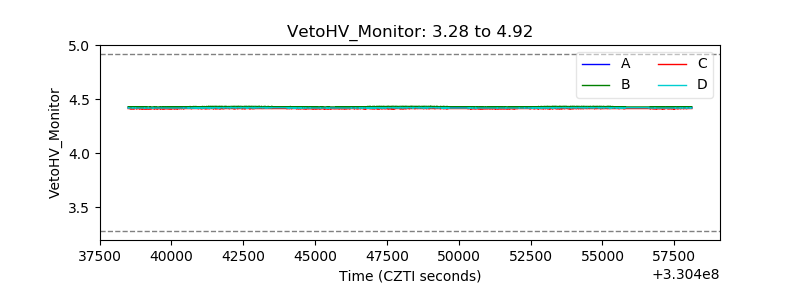 |
| Veto LLD | 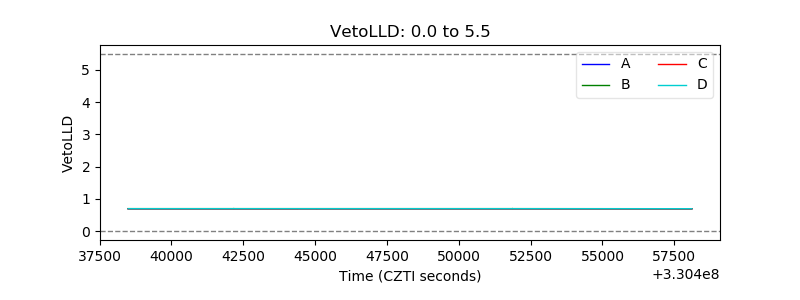 |
| Alpha Counter | 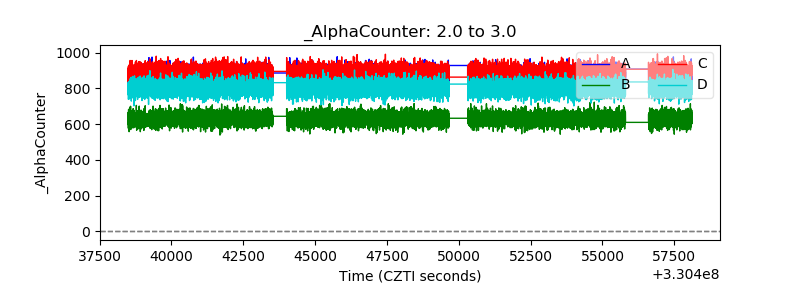 |
| _CPM_Rate | 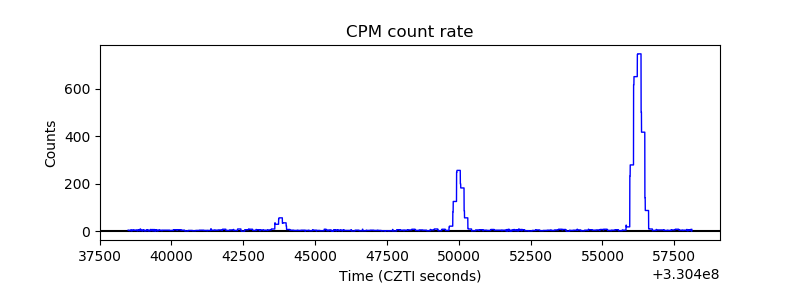 |
| CZT Counter | 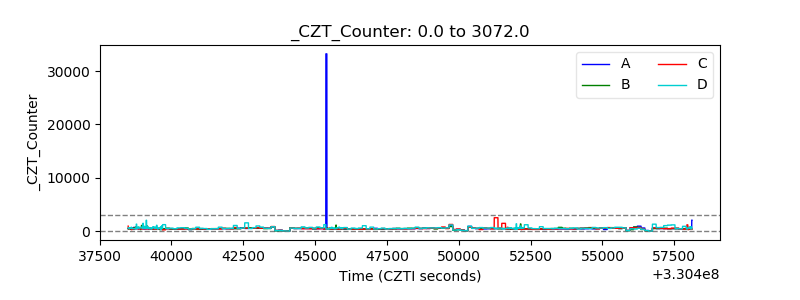 |
| +2.5 Volts monitor | 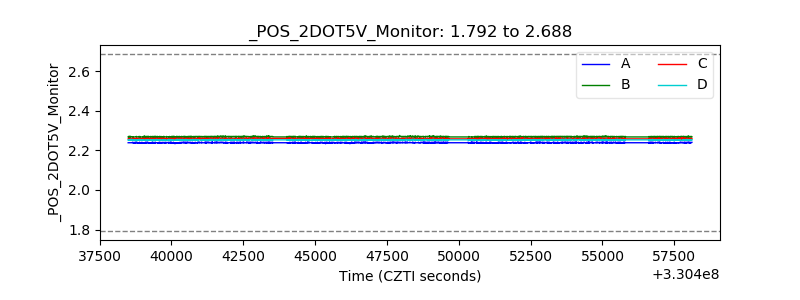 |
| +5 Volts monitor |  |
| _ROLL_ROT | 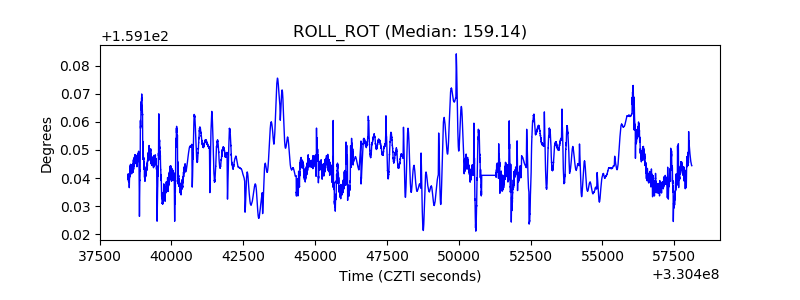 |
| _Roll_DEC | 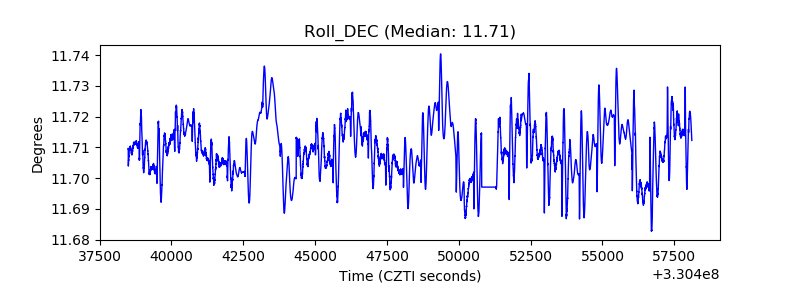 |
| _Roll_RA | 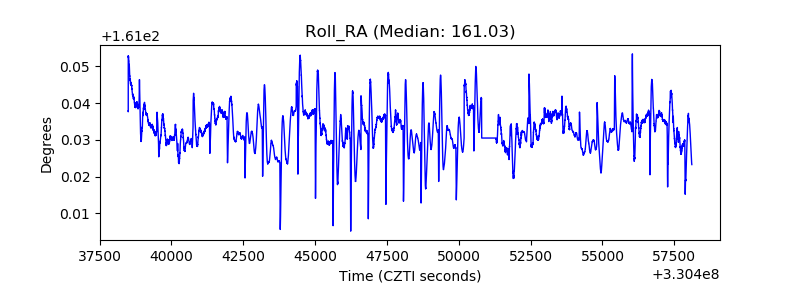 |
| Veto Counter | 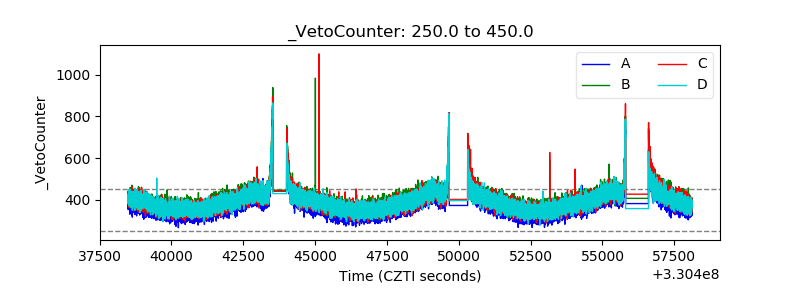 |