| Param | Original file | Final file |
|---|---|---|
| Filename | modeM0/AS1A09_043T02_9000003726_25586cztM0_level2.evt | modeM0/AS1A09_043T02_9000003726_25586cztM0_level2_quad_clean.evt |
| Size (bytes) | 501,102,720 | 91,955,520 |
| Size | 477.9 MB | 87.7 MB |
| Events in quadrant A | 3,248,403 | 595,371 |
| Events in quadrant B | 3,351,568 | 607,747 |
| Events in quadrant C | 3,282,824 | 571,824 |
| Events in quadrant D | 4,841,543 | 545,915 |
| Mode M0 | |||
|---|---|---|---|
| Quadrant | BADHDUFLAG | Total packets | Discarded packets |
| A | 0 | 13906 | 0 |
| B | 0 | 14192 | 0 |
| C | 0 | 13939 | 0 |
| D | 0 | 19028 | 0 |
| Mode M9 | |||
|---|---|---|---|
| Quadrant | BADHDUFLAG | Total packets | Discarded packets |
| A | 0 | 10 | 0 |
| B | 0 | 10 | 0 |
| C | 0 | 10 | 0 |
| D | 0 | 10 | 0 |
| Quadrant | Total seconds | Saturated seconds | Saturation percentage |
|---|---|---|---|
| A | 6657 | 55 | 0.826198% |
| B | 6656 | 18 | 0.270433% |
| C | 6656 | 57 | 0.856370% |
| D | 6657 | 309 | 4.641731% |
Noise dominated data is calculated using 1-second bins in cleaned event files. If a bin has >2000 counts, and if more than 50% of those come from <1% of pixels, then it is considered to be noise-dominated and hence unusable.
| Quadrant | # 1 sec bins | Bins with >0 counts | Bins with >2000 counts | High rate bins dominated by noise | Noise dominated (total time) | Noise dominated (detector-on time) | Marked lightcurve |
|---|---|---|---|---|---|---|---|
| A | 7632 | 6658 | 29 | 29 | 0.38% | 0.44% | 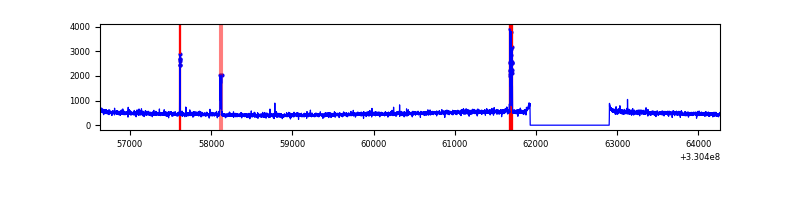 |
| B | 7631 | 6657 | 0 | 0 | 0.00% | 0.00% | 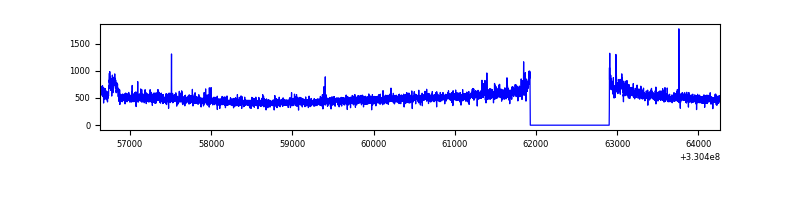 |
| C | 7631 | 6657 | 7 | 7 | 0.09% | 0.11% | 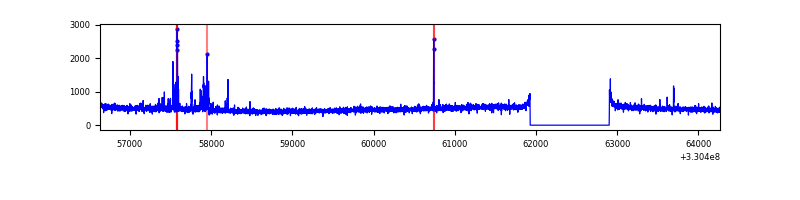 |
| D | 7632 | 6658 | 267 | 267 | 3.50% | 4.01% | 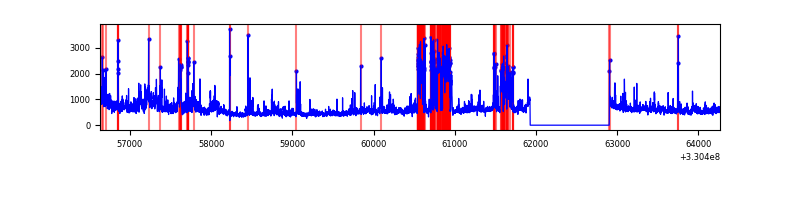 |
Top three noisy pixels from each quadrant. If the there are fewer than three noisy pixels in the level2.evt file, extra rows are filled as -1
| Pixel properties | Quadrant properties | ||||||
|---|---|---|---|---|---|---|---|
| Quadrant | DetID | PixID | Counts | Sigma | Mean | Median | Sigma |
| A | 6 | 16 | 112046 | 673.95 | 811 | 794 | 165.1 |
| A | 13 | 254 | 11544 | 65.12 | 811 | 794 | 165.1 |
| A | 3 | 137 | 7278 | 39.28 | 811 | 794 | 165.1 |
| B | 0 | 219 | 72149 | 458.99 | 814 | 793 | 155.5 |
| B | 5 | 171 | 58581 | 371.71 | 814 | 793 | 155.5 |
| B | 12 | 111 | 18562 | 114.3 | 814 | 793 | 155.5 |
| C | 14 | 238 | 124623 | 673.65 | 778 | 784 | 183.8 |
| C | 2 | 16 | 113710 | 614.29 | 778 | 784 | 183.8 |
| C | 0 | 207 | 11468 | 58.12 | 778 | 784 | 183.8 |
| D | 1 | 52 | 1187578 | 6256.22 | 775 | 750 | 189.7 |
| D | 8 | 195 | 508124 | 2674.56 | 775 | 750 | 189.7 |
| D | 7 | 38 | 95699 | 500.51 | 775 | 750 | 189.7 |
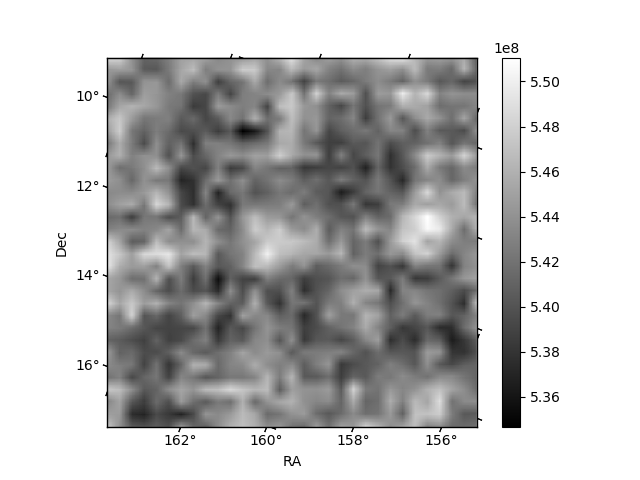
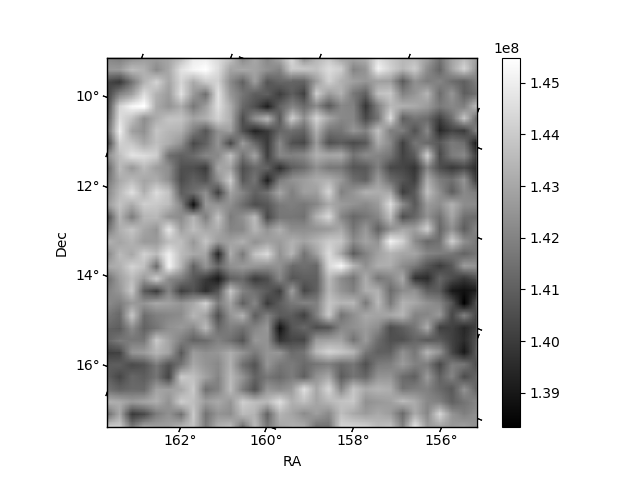
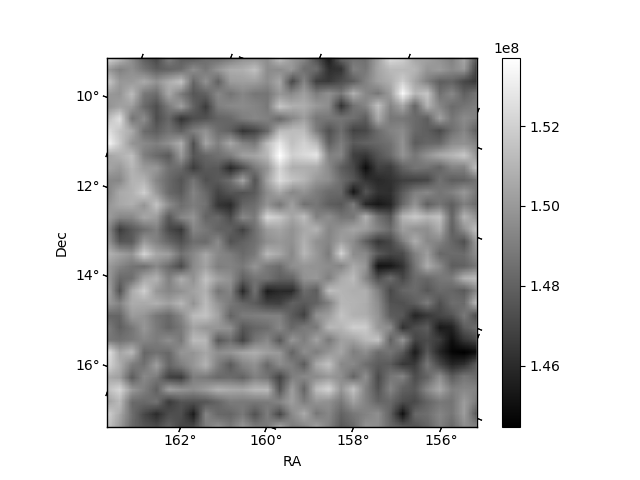
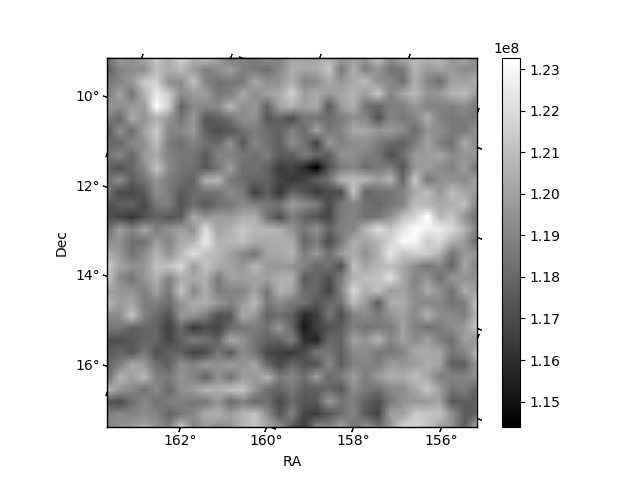
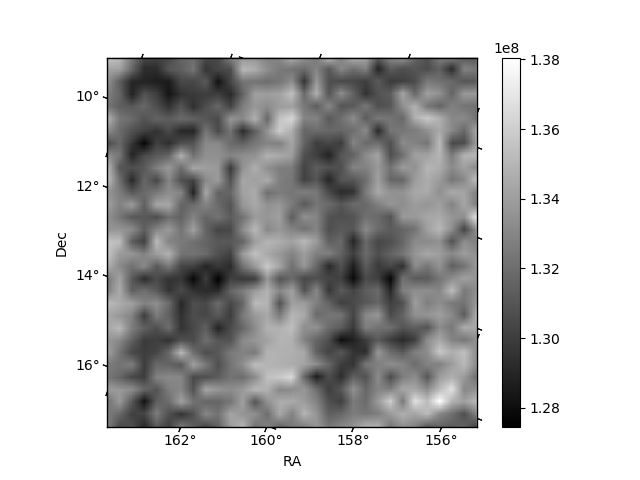
Histogram calculated using DETX and DETY for each event in the final _common_clean file
| Quadrant A | 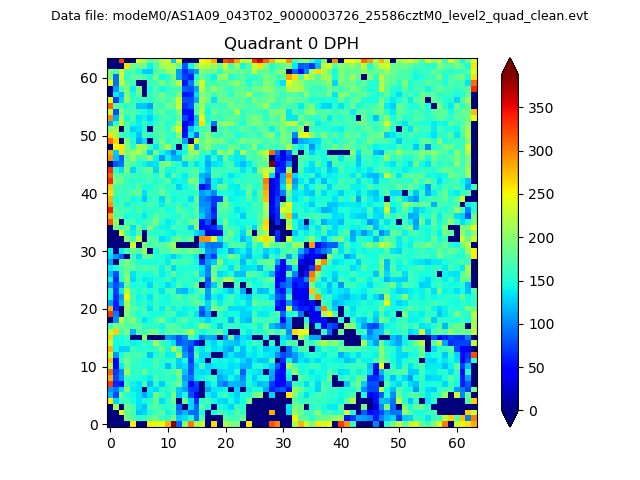 |
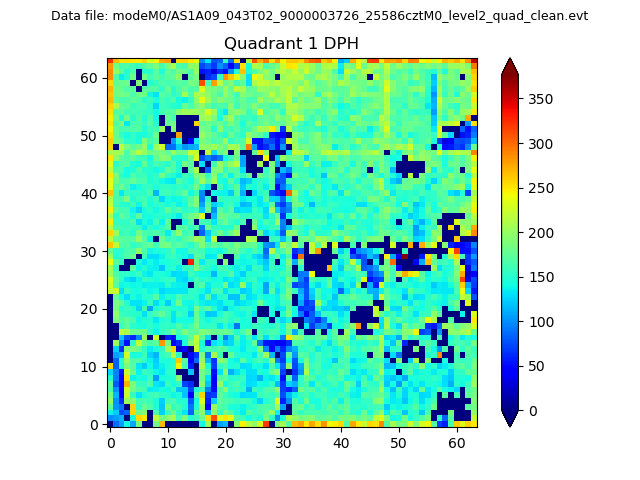 |
Quadrant B |
|---|---|---|---|
| Quadrant D | 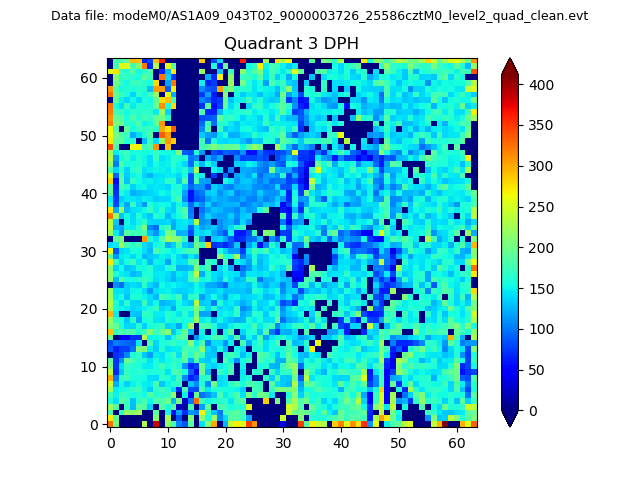 |
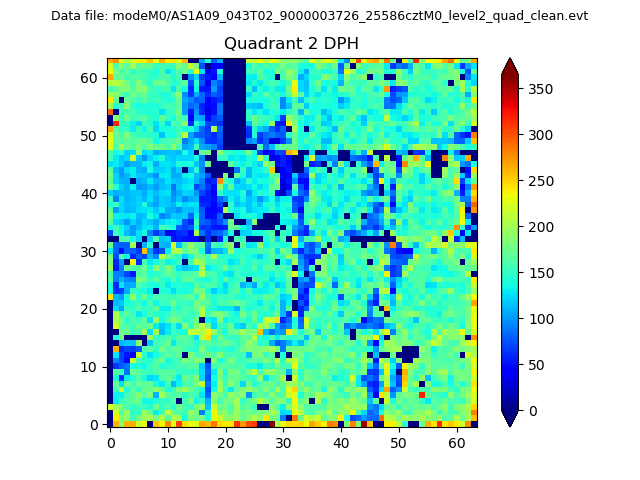 |
Quadrant C |
| Plot type | Count rate plots | Images |
|---|---|---|
| Comparison with Poisson distribution Blue bars denote a histogram of data divided into 1 sec bins. Red curve is a Poisson curve with rate = median count rate of data. |
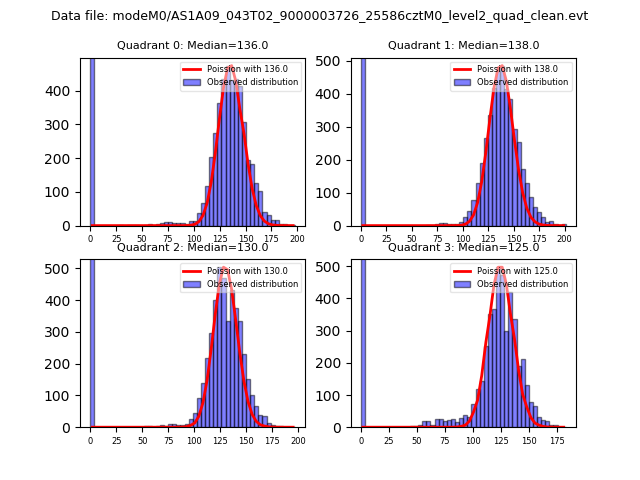 |
 |
| Quadrant-wise count rates Data is divided into 100 sec bins |
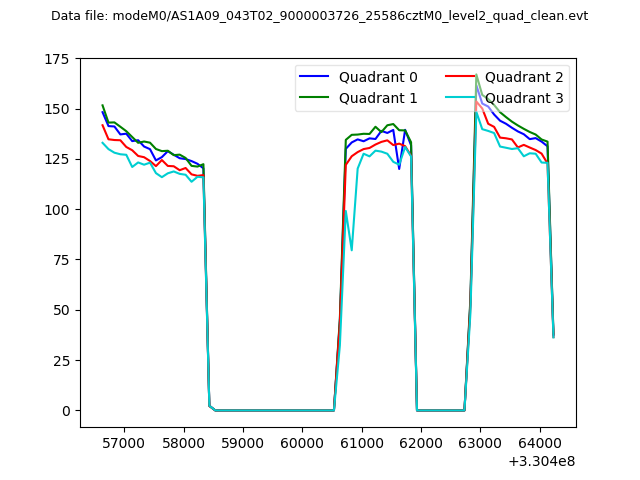 |
|
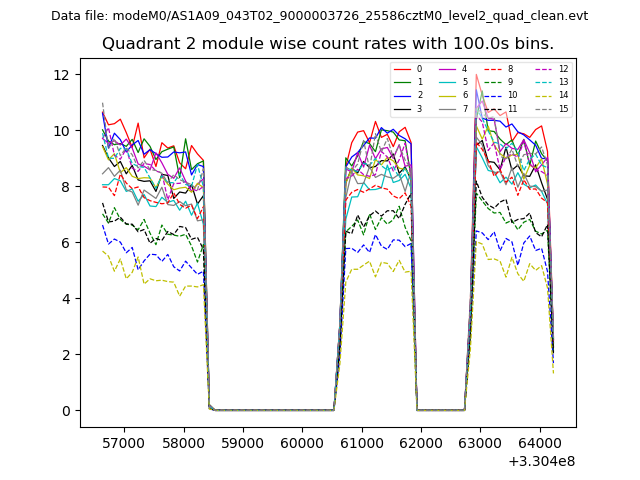
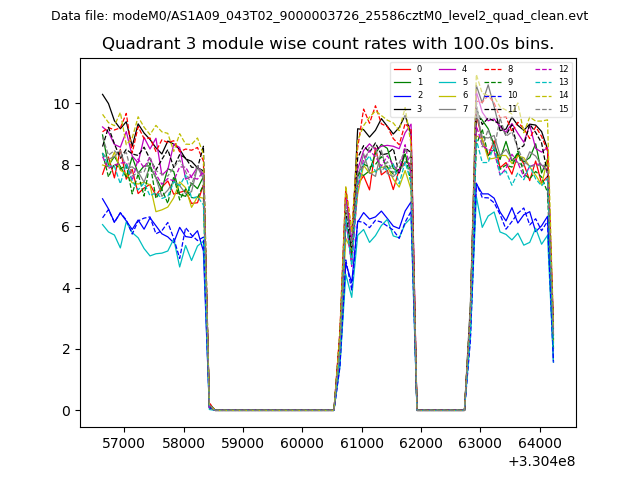
| Module-wise count rates for Quadrant A Data is divided into 100 sec bins |
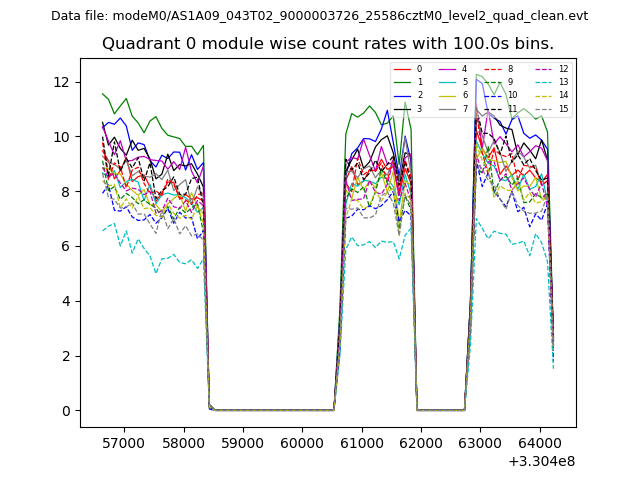 |
 |
| Module-wise count rates for Quadrant B Data is divided into 100 sec bins |
 |
 |
| Module-wise count rates for Quadrant C Data is divided into 100 sec bins |
 |
 |
| Module-wise count rates for Quadrant D Data is divided into 100 sec bins |
 |
 |
| Parameter | Plot |
|---|---|
| CZT HV Monitor | 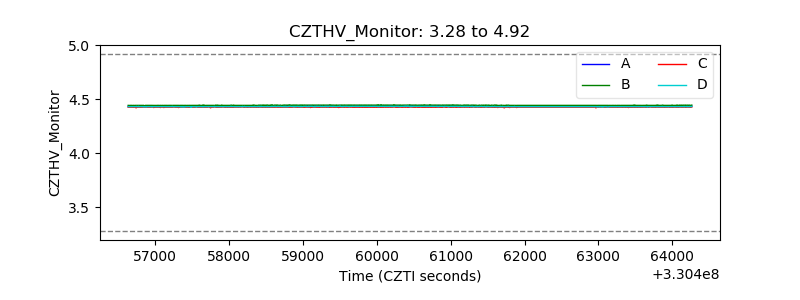 |
| D_VDD | 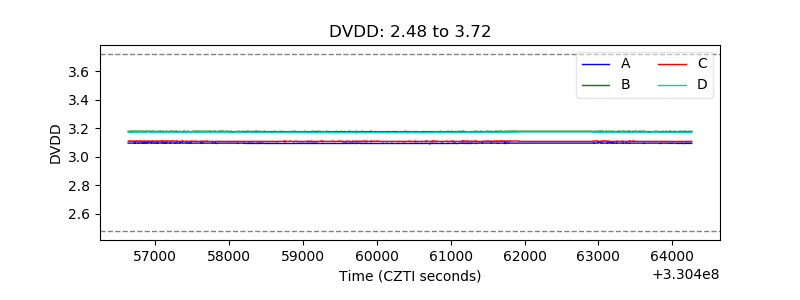 |
| Temperature 1 | 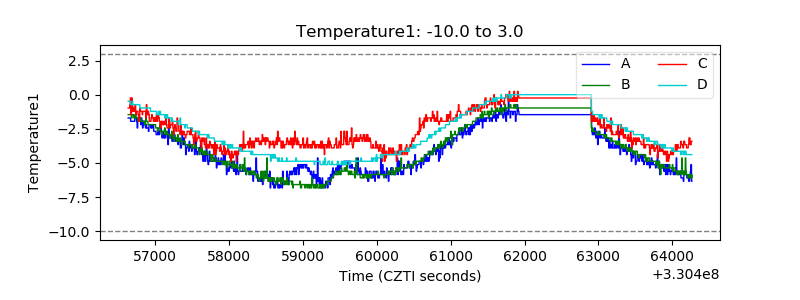 |
| Veto HV Monitor | 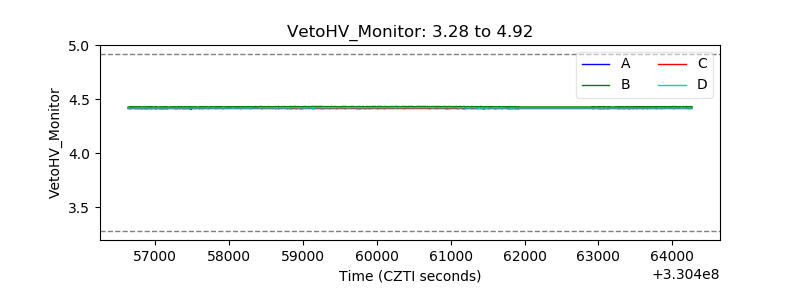 |
| Veto LLD | 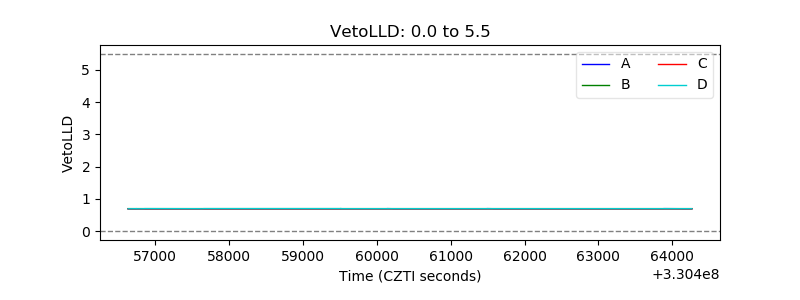 |
| Alpha Counter | 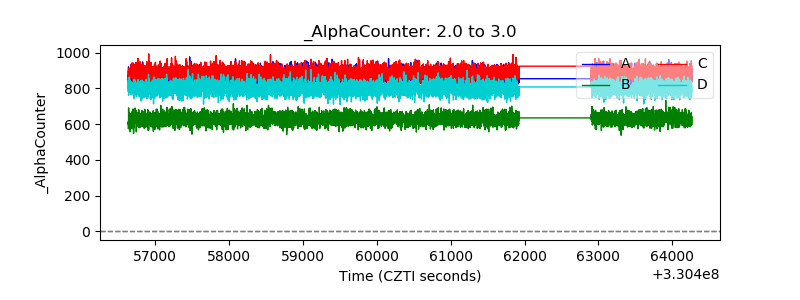 |
| _CPM_Rate |  |
| CZT Counter | 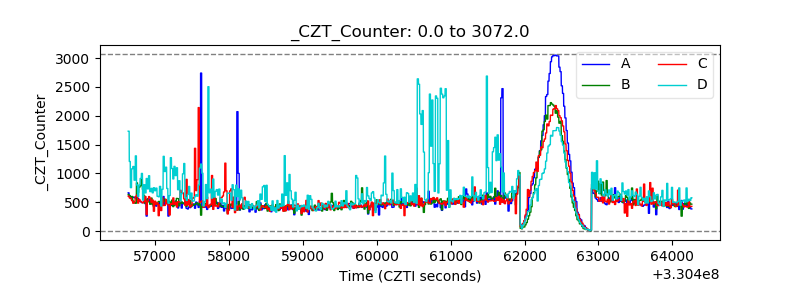 |
| +2.5 Volts monitor |  |
| +5 Volts monitor |  |
| _ROLL_ROT | 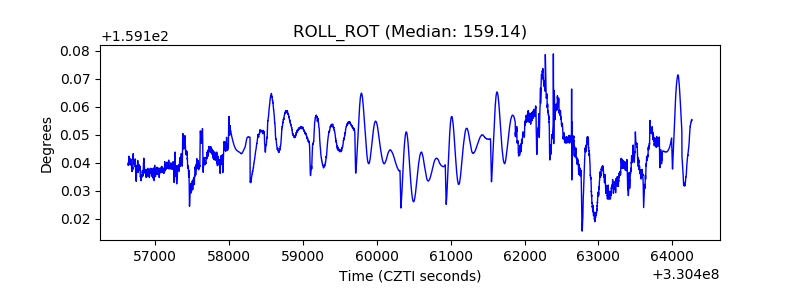 |
| _Roll_DEC | 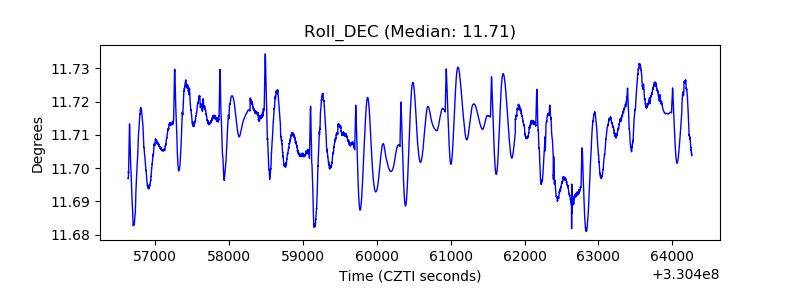 |
| _Roll_RA | 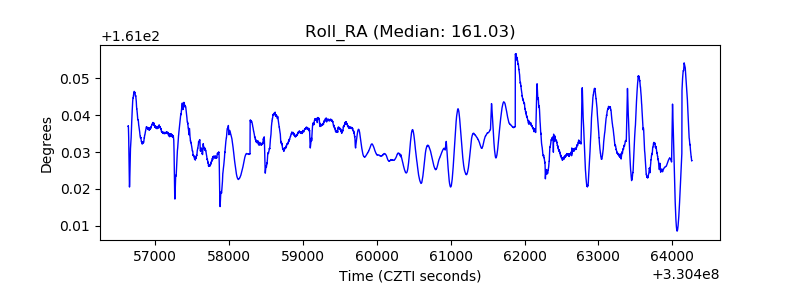 |
| Veto Counter |  |