| Param | Original file | Final file |
|---|---|---|
| Filename | modeM0/AS1A09_043T02_9000003726_25588cztM0_level2.evt | modeM0/AS1A09_043T02_9000003726_25588cztM0_level2_quad_clean.evt |
| Size (bytes) | 474,655,680 | 87,284,160 |
| Size | 452.7 MB | 83.2 MB |
| Events in quadrant A | 3,196,881 | 561,912 |
| Events in quadrant B | 3,400,233 | 575,028 |
| Events in quadrant C | 3,197,489 | 536,095 |
| Events in quadrant D | 4,139,462 | 517,211 |
| Mode M0 | |||
|---|---|---|---|
| Quadrant | BADHDUFLAG | Total packets | Discarded packets |
| A | 0 | 13463 | 0 |
| B | 0 | 14121 | 0 |
| C | 0 | 13451 | 0 |
| D | 0 | 16815 | 0 |
| Mode M9 | |||
|---|---|---|---|
| Quadrant | BADHDUFLAG | Total packets | Discarded packets |
| A | 0 | 12 | 0 |
| B | 0 | 12 | 0 |
| C | 0 | 13 | 0 |
| D | 0 | 13 | 0 |
| Quadrant | Total seconds | Saturated seconds | Saturation percentage |
|---|---|---|---|
| A | 6488 | 30 | 0.462392% |
| B | 6488 | 33 | 0.508631% |
| C | 6488 | 61 | 0.940197% |
| D | 6488 | 95 | 1.464242% |
Noise dominated data is calculated using 1-second bins in cleaned event files. If a bin has >2000 counts, and if more than 50% of those come from <1% of pixels, then it is considered to be noise-dominated and hence unusable.
| Quadrant | # 1 sec bins | Bins with >0 counts | Bins with >2000 counts | High rate bins dominated by noise | Noise dominated (total time) | Noise dominated (detector-on time) | Marked lightcurve |
|---|---|---|---|---|---|---|---|
| A | 7583 | 6489 | 0 | 0 | 0.00% | 0.00% | 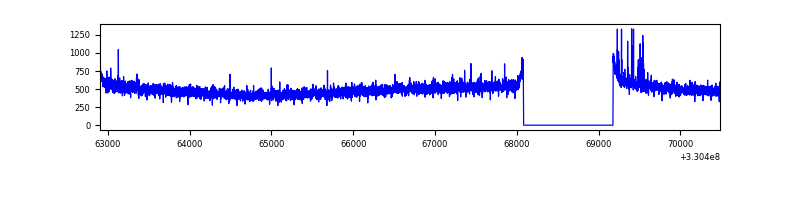 |
| B | 7583 | 6489 | 2 | 2 | 0.03% | 0.03% | 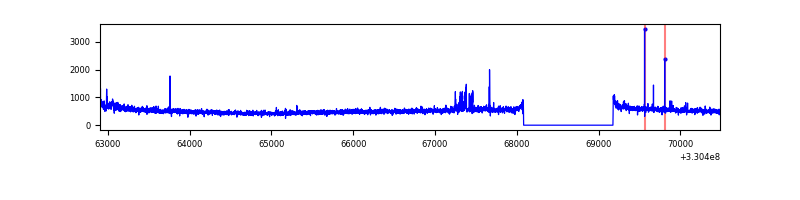 |
| C | 7583 | 6489 | 0 | 0 | 0.00% | 0.00% | 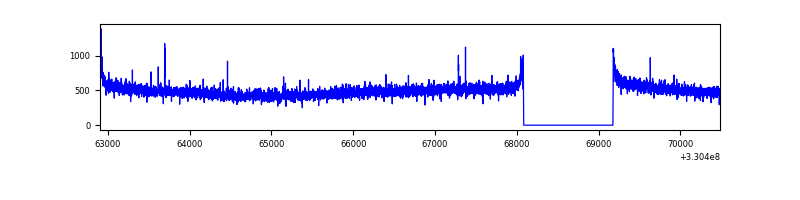 |
| D | 7583 | 6489 | 55 | 55 | 0.73% | 0.85% | 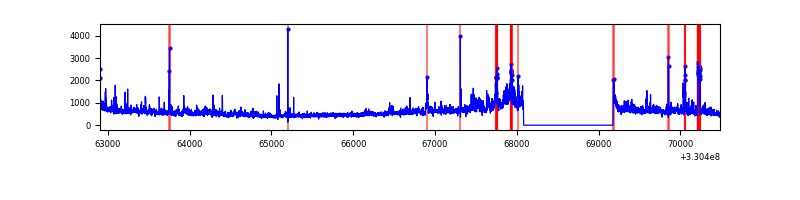 |
Top three noisy pixels from each quadrant. If the there are fewer than three noisy pixels in the level2.evt file, extra rows are filled as -1
| Pixel properties | Quadrant properties | ||||||
|---|---|---|---|---|---|---|---|
| Quadrant | DetID | PixID | Counts | Sigma | Mean | Median | Sigma |
| A | 6 | 16 | 20540 | 118.69 | 823 | 809 | 166.2 |
| A | 13 | 254 | 10452 | 58.01 | 823 | 809 | 166.2 |
| A | 3 | 137 | 7302 | 39.06 | 823 | 809 | 166.2 |
| B | 0 | 219 | 65540 | 419.22 | 822 | 803 | 154.4 |
| B | 0 | 190 | 44529 | 283.16 | 822 | 803 | 154.4 |
| B | 5 | 171 | 29113 | 183.33 | 822 | 803 | 154.4 |
| C | 14 | 238 | 126439 | 677.85 | 781 | 787 | 185.4 |
| C | 3 | 233 | 13941 | 70.96 | 781 | 787 | 185.4 |
| C | 2 | 16 | 10858 | 54.33 | 781 | 787 | 185.4 |
| D | 8 | 195 | 689799 | 3593.15 | 786 | 764 | 191.8 |
| D | 1 | 52 | 369313 | 1921.89 | 786 | 764 | 191.8 |
| D | 2 | 244 | 50096 | 257.25 | 786 | 764 | 191.8 |
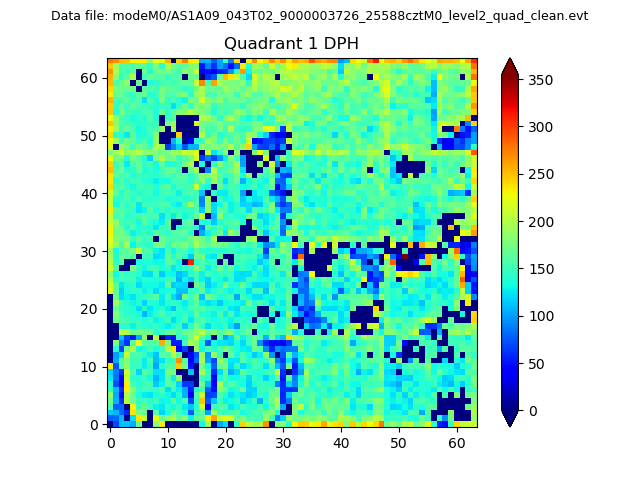
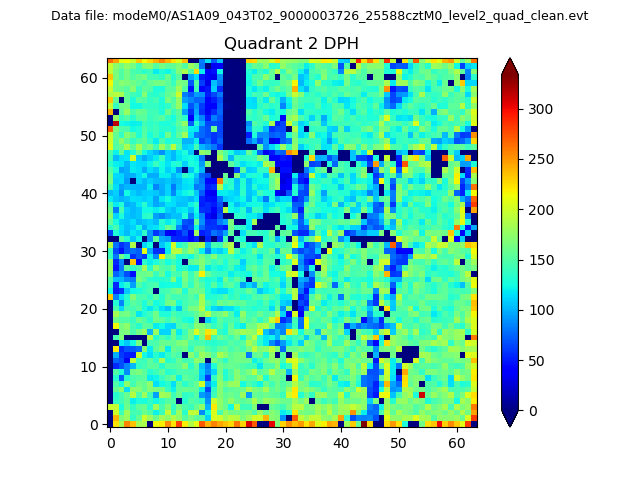
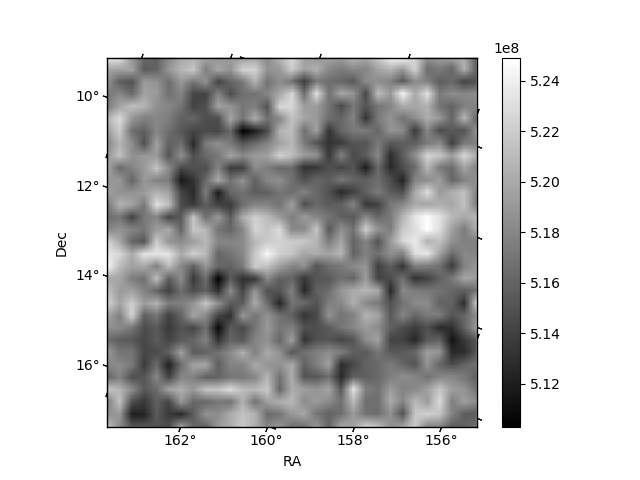
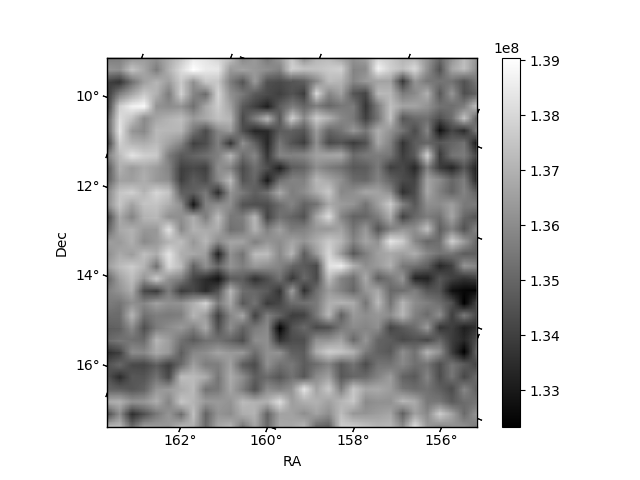
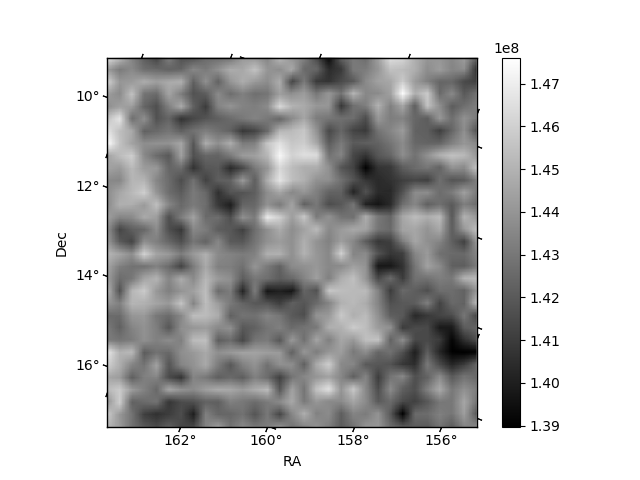
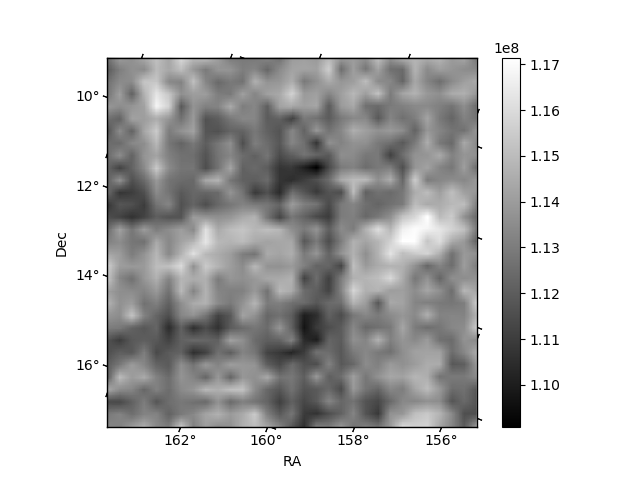
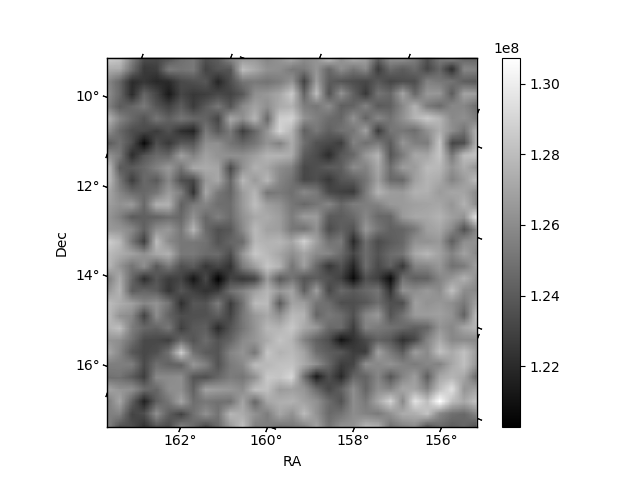
Histogram calculated using DETX and DETY for each event in the final _common_clean file
| Quadrant A |  |
 |
Quadrant B |
|---|---|---|---|
| Quadrant D | 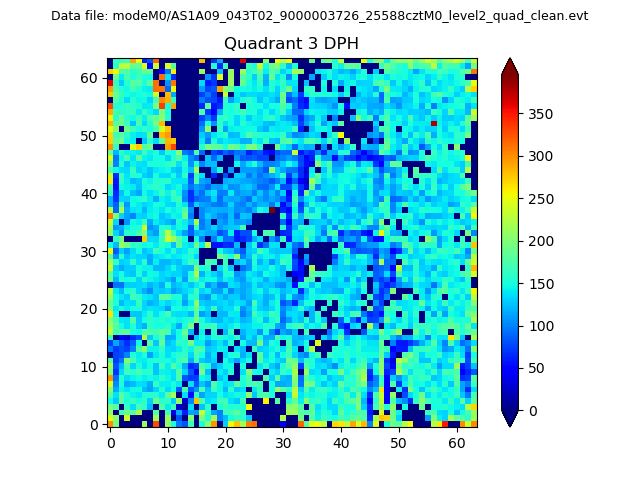 |
 |
Quadrant C |
| Plot type | Count rate plots | Images |
|---|---|---|
| Comparison with Poisson distribution Blue bars denote a histogram of data divided into 1 sec bins. Red curve is a Poisson curve with rate = median count rate of data. |
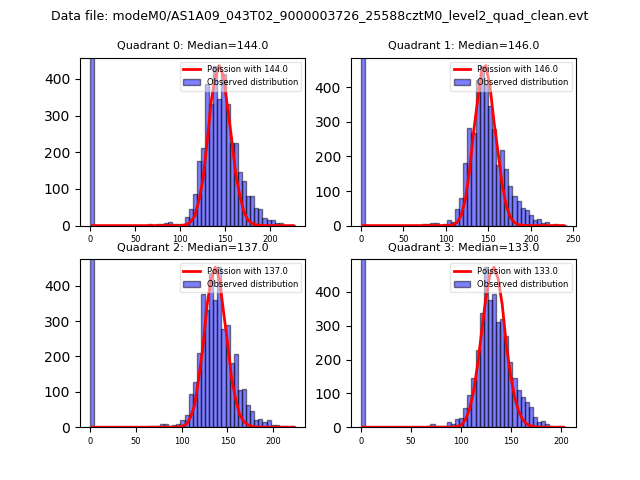 |
 |
| Quadrant-wise count rates Data is divided into 100 sec bins |
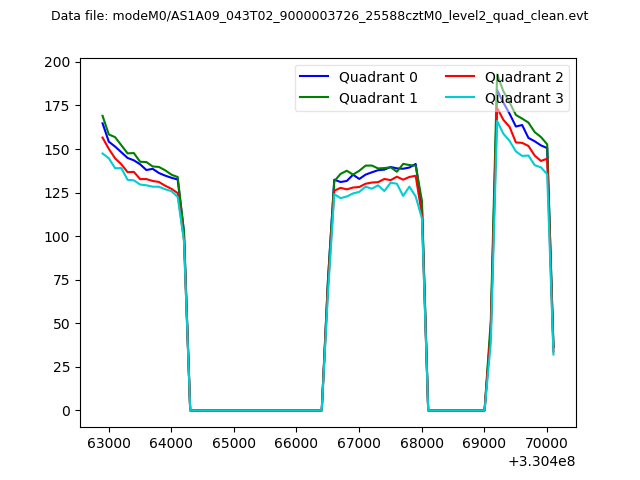 |
|
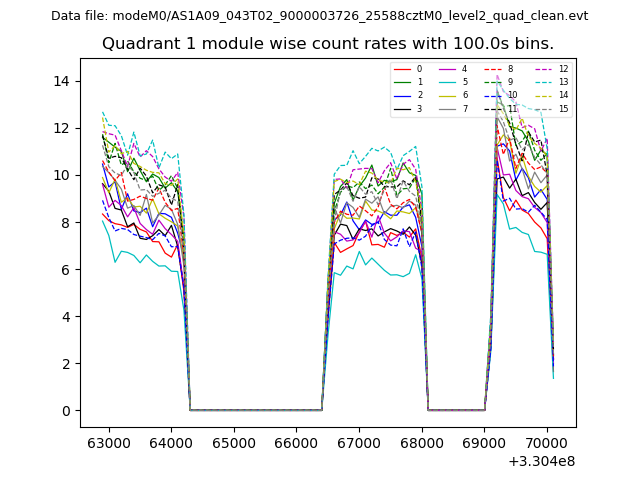
| Module-wise count rates for Quadrant A Data is divided into 100 sec bins |
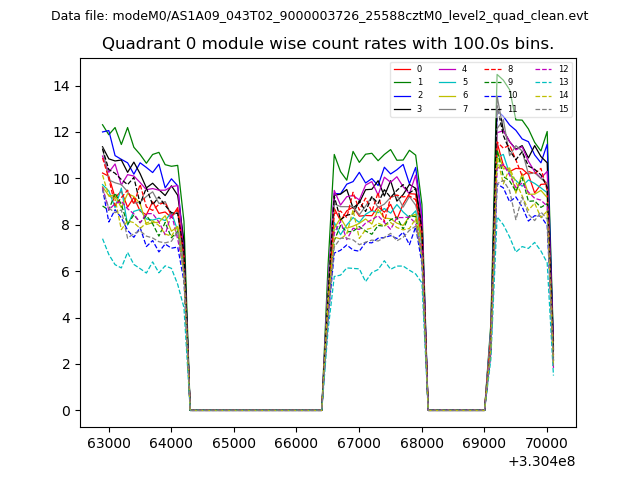 |
 |
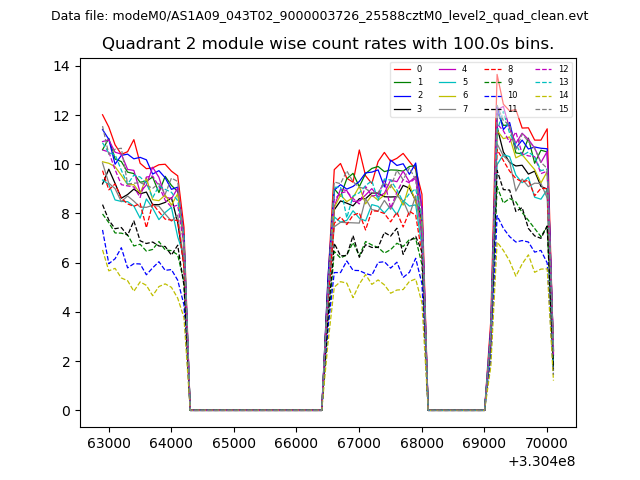
| Module-wise count rates for Quadrant B Data is divided into 100 sec bins |
 |
 |
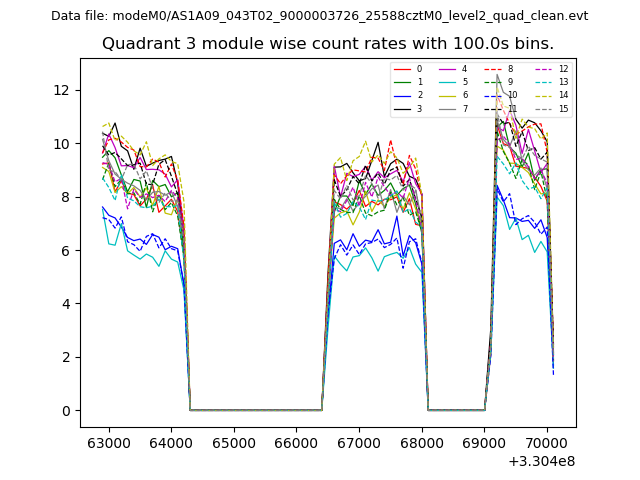
| Module-wise count rates for Quadrant C Data is divided into 100 sec bins |
 |
 |
| Module-wise count rates for Quadrant D Data is divided into 100 sec bins |
 |
 |
| Parameter | Plot |
|---|---|
| CZT HV Monitor | 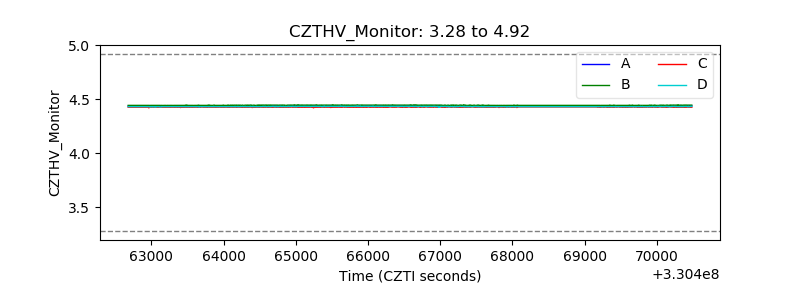 |
| D_VDD | 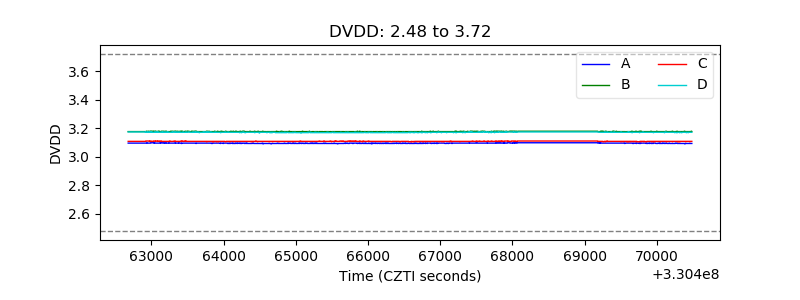 |
| Temperature 1 | 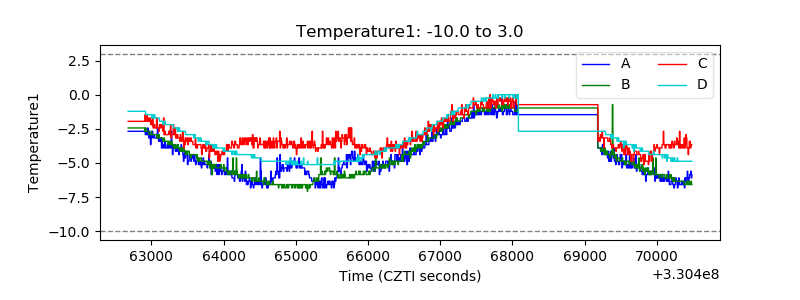 |
| Veto HV Monitor | 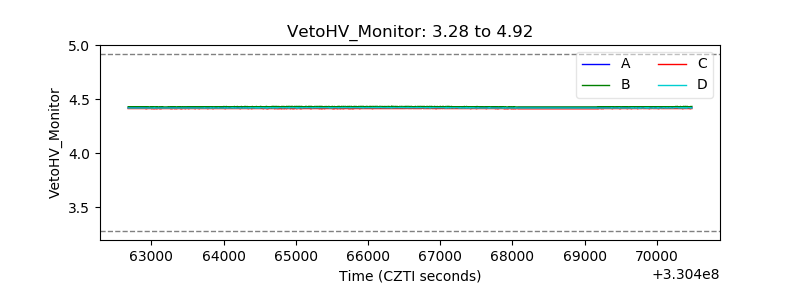 |
| Veto LLD | 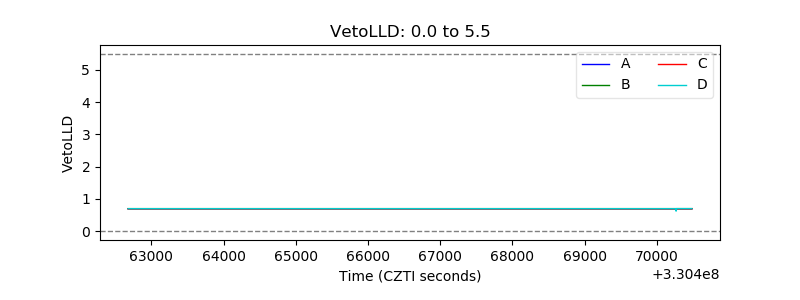 |
| Alpha Counter | 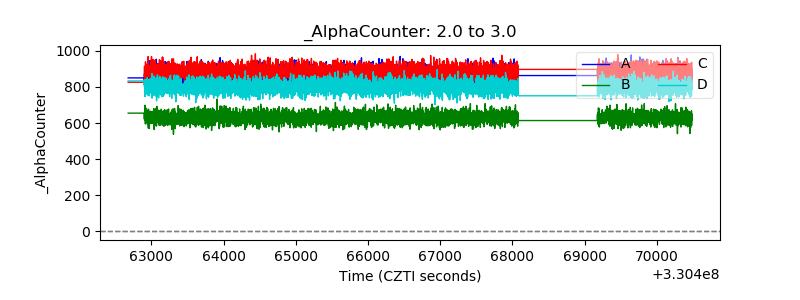 |
| _CPM_Rate | 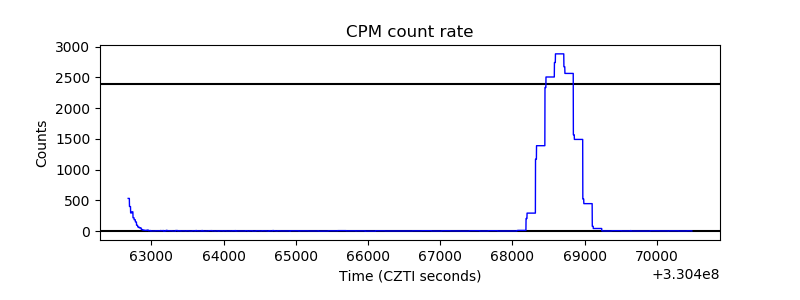 |
| CZT Counter | 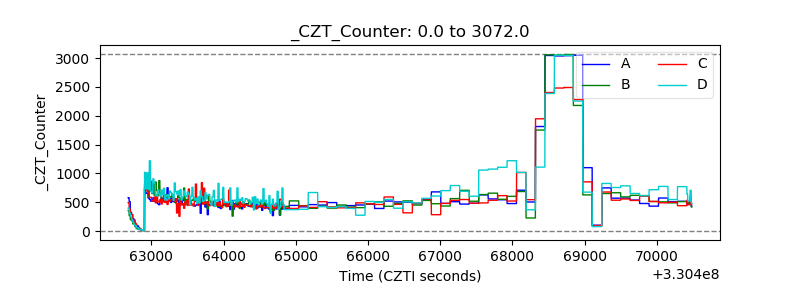 |
| +2.5 Volts monitor |  |
| +5 Volts monitor | 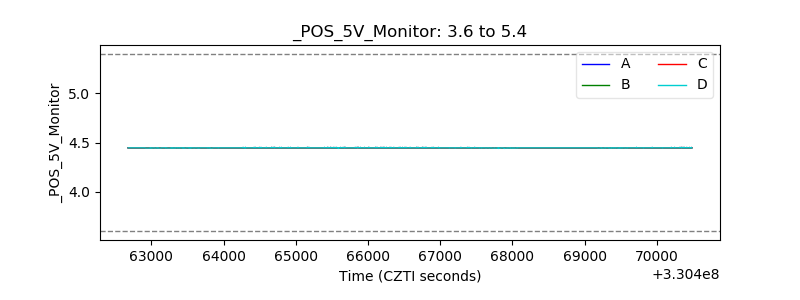 |
| _ROLL_ROT | 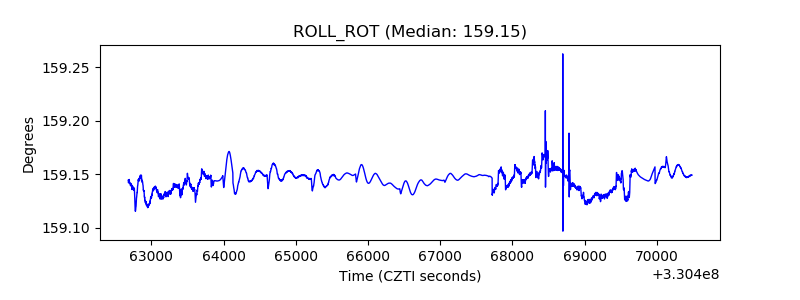 |
| _Roll_DEC | 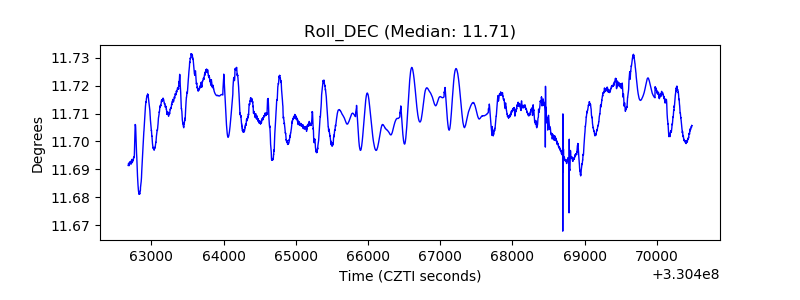 |
| _Roll_RA | 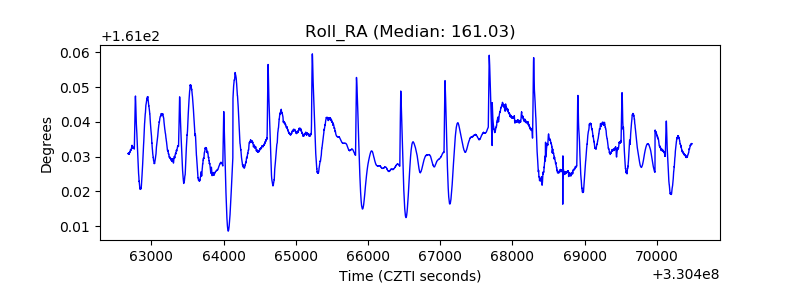 |
| Veto Counter | 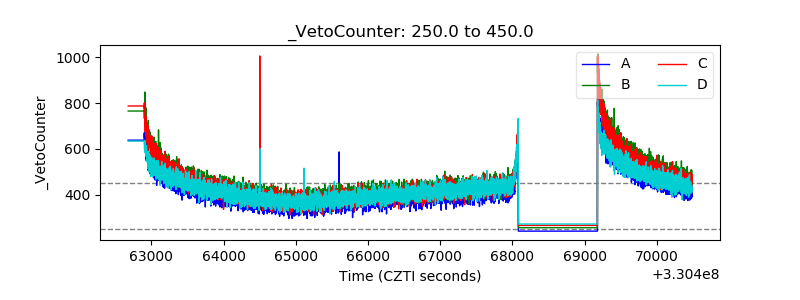 |