| Param | Original file | Final file |
|---|---|---|
| Filename | modeM0/AS1A09_043T02_9000003726_25589cztM0_level2.evt | modeM0/AS1A09_043T02_9000003726_25589cztM0_level2_quad_clean.evt |
| Size (bytes) | 511,168,320 | 80,763,840 |
| Size | 487.5 MB | 77.0 MB |
| Events in quadrant A | 3,830,812 | 502,795 |
| Events in quadrant B | 3,465,425 | 535,125 |
| Events in quadrant C | 3,357,501 | 489,055 |
| Events in quadrant D | 4,393,037 | 471,916 |
| Mode M0 | |||
|---|---|---|---|
| Quadrant | BADHDUFLAG | Total packets | Discarded packets |
| A | 0 | 15187 | 0 |
| B | 0 | 14129 | 0 |
| C | 0 | 13768 | 0 |
| D | 0 | 17384 | 0 |
| Mode M9 | |||
|---|---|---|---|
| Quadrant | BADHDUFLAG | Total packets | Discarded packets |
| A | 0 | 15 | 0 |
| B | 0 | 16 | 0 |
| C | 0 | 16 | 0 |
| D | 0 | 16 | 0 |
| Quadrant | Total seconds | Saturated seconds | Saturation percentage |
|---|---|---|---|
| A | 6402 | 258 | 4.029991% |
| B | 6402 | 50 | 0.781006% |
| C | 6402 | 91 | 1.421431% |
| D | 6402 | 102 | 1.593252% |
Noise dominated data is calculated using 1-second bins in cleaned event files. If a bin has >2000 counts, and if more than 50% of those come from <1% of pixels, then it is considered to be noise-dominated and hence unusable.
| Quadrant | # 1 sec bins | Bins with >0 counts | Bins with >2000 counts | High rate bins dominated by noise | Noise dominated (total time) | Noise dominated (detector-on time) | Marked lightcurve |
|---|---|---|---|---|---|---|---|
| A | 7597 | 6403 | 180 | 180 | 2.37% | 2.81% | 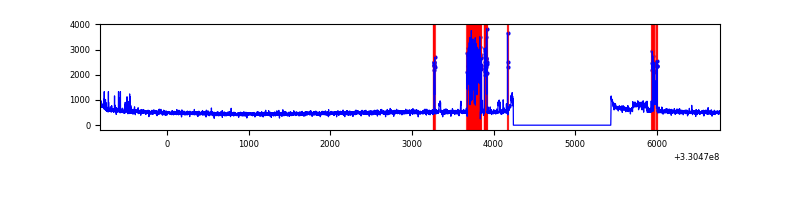 |
| B | 7597 | 6403 | 3 | 3 | 0.04% | 0.05% | 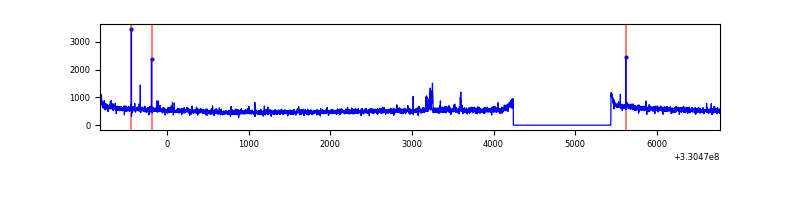 |
| C | 7597 | 6403 | 13 | 13 | 0.17% | 0.20% | 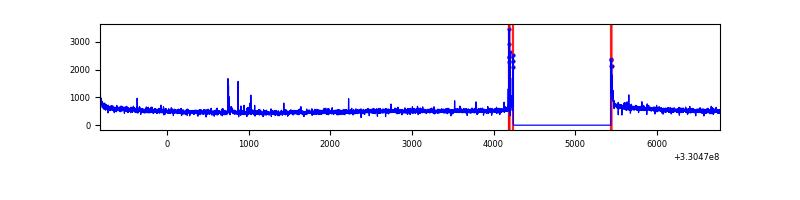 |
| D | 7597 | 6403 | 72 | 72 | 0.95% | 1.12% | 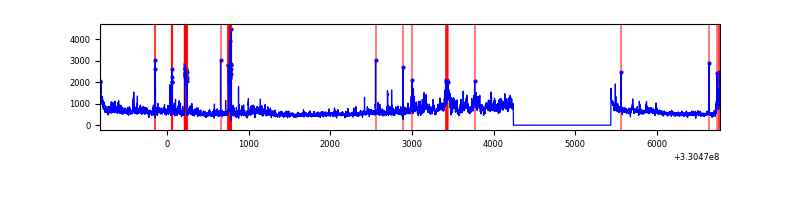 |
Top three noisy pixels from each quadrant. If the there are fewer than three noisy pixels in the level2.evt file, extra rows are filled as -1
| Pixel properties | Quadrant properties | ||||||
|---|---|---|---|---|---|---|---|
| Quadrant | DetID | PixID | Counts | Sigma | Mean | Median | Sigma |
| A | 8 | 192 | 565319 | 3342.68 | 844 | 828 | 168.9 |
| A | 6 | 16 | 15649 | 87.76 | 844 | 828 | 168.9 |
| A | 13 | 254 | 10328 | 56.25 | 844 | 828 | 168.9 |
| B | 0 | 219 | 36744 | 224.53 | 858 | 839 | 159.9 |
| B | 0 | 190 | 35715 | 218.09 | 858 | 839 | 159.9 |
| B | 0 | 245 | 19952 | 119.52 | 858 | 839 | 159.9 |
| C | 14 | 238 | 131461 | 698.58 | 804 | 809 | 187.0 |
| C | 3 | 233 | 35208 | 183.93 | 804 | 809 | 187.0 |
| C | 0 | 207 | 33206 | 173.22 | 804 | 809 | 187.0 |
| D | 8 | 195 | 609807 | 3072.06 | 809 | 788 | 198.2 |
| D | 1 | 52 | 587099 | 2957.51 | 809 | 788 | 198.2 |
| D | 2 | 244 | 56533 | 281.19 | 809 | 788 | 198.2 |
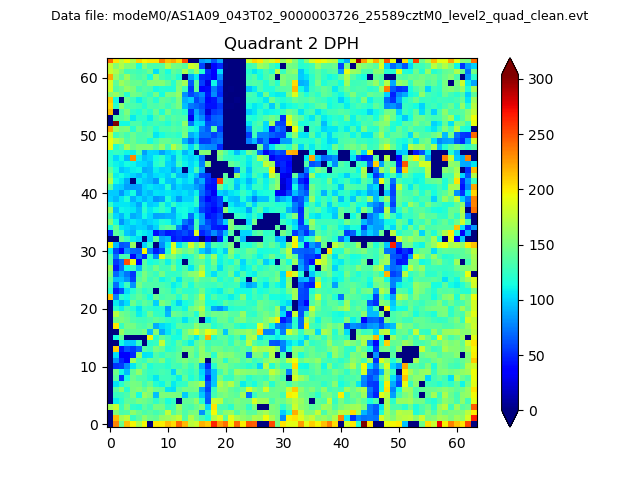
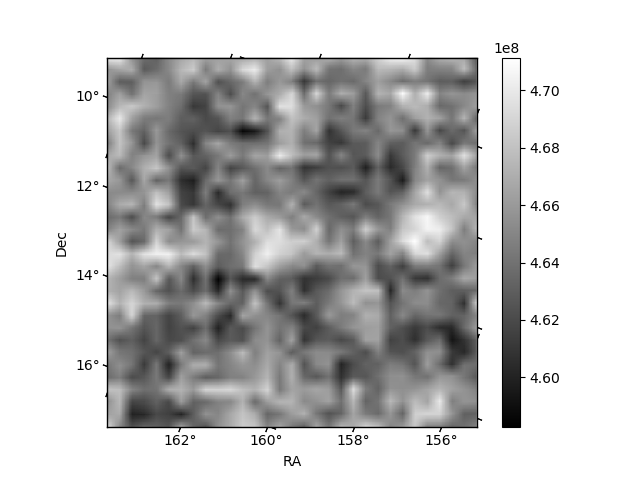
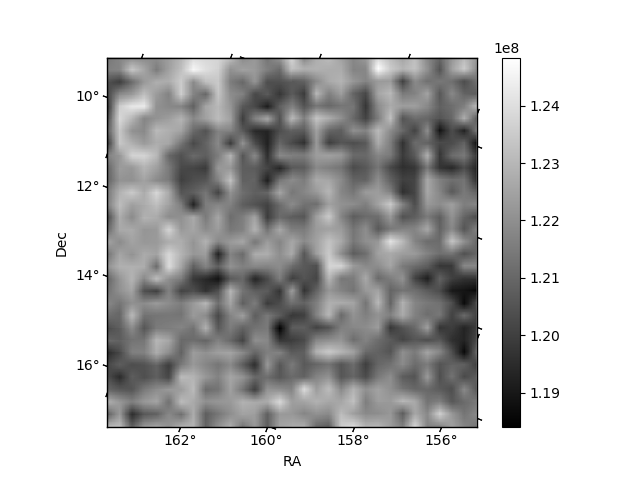
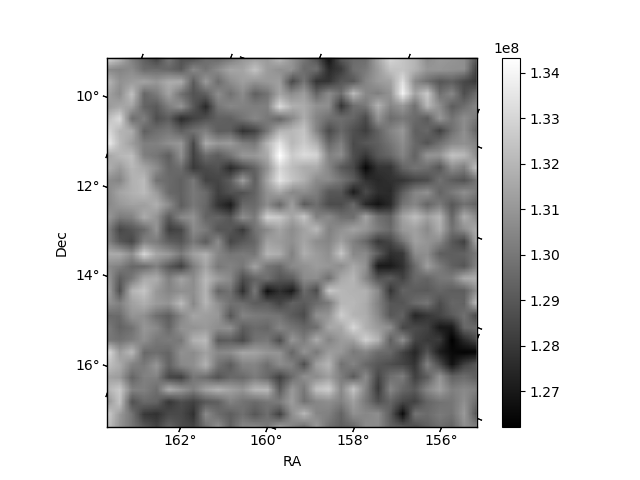
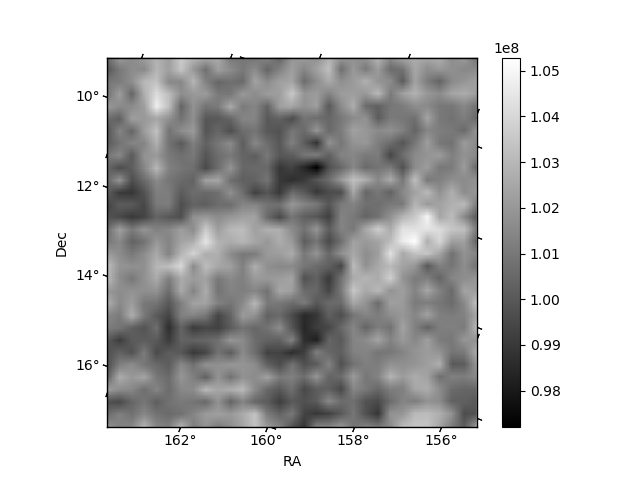
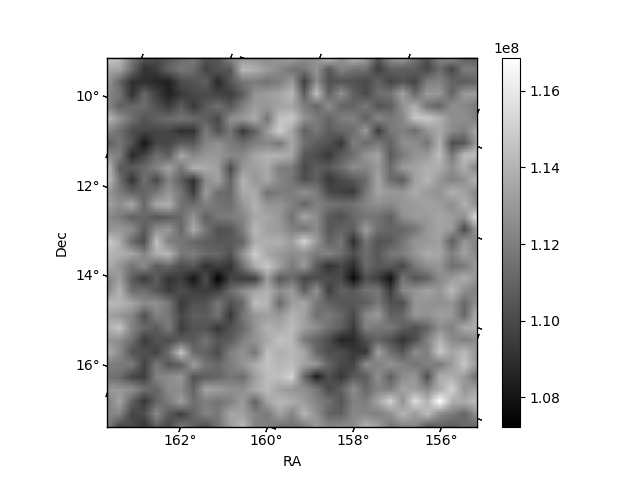
Histogram calculated using DETX and DETY for each event in the final _common_clean file
| Quadrant A | 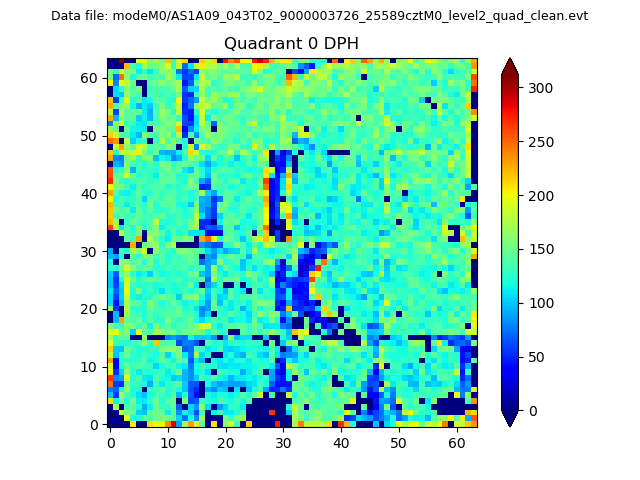 |
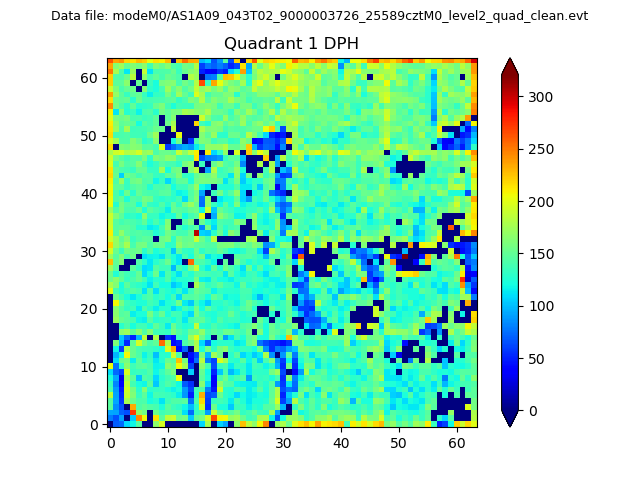 |
Quadrant B |
|---|---|---|---|
| Quadrant D | 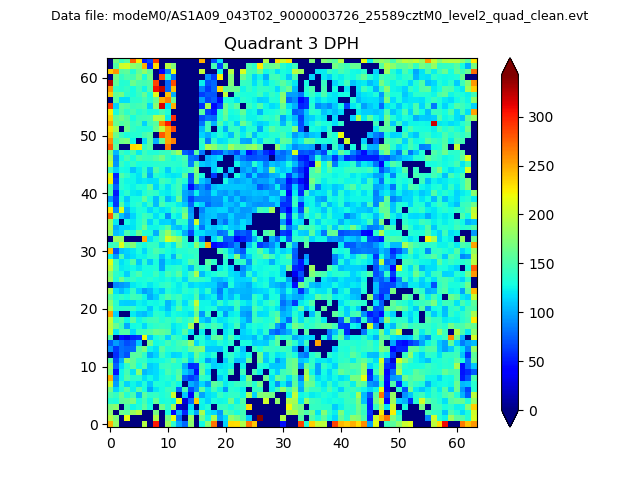 |
 |
Quadrant C |
| Plot type | Count rate plots | Images |
|---|---|---|
| Comparison with Poisson distribution Blue bars denote a histogram of data divided into 1 sec bins. Red curve is a Poisson curve with rate = median count rate of data. |
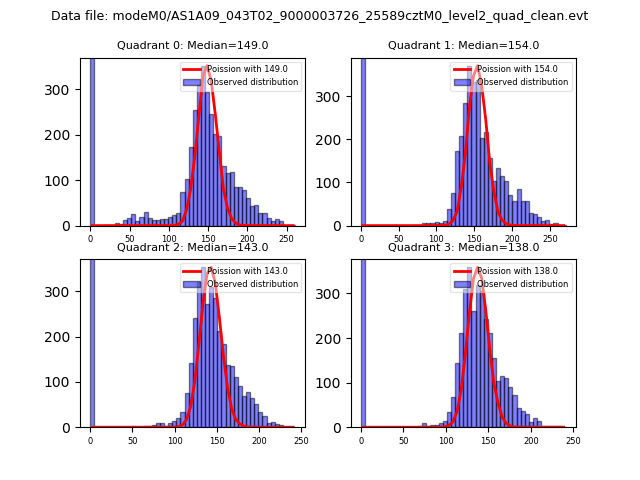 |
 |
| Quadrant-wise count rates Data is divided into 100 sec bins |
 |
|
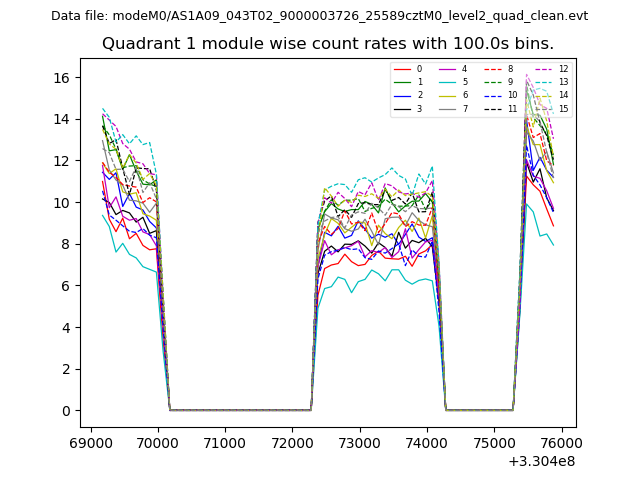
| Module-wise count rates for Quadrant A Data is divided into 100 sec bins |
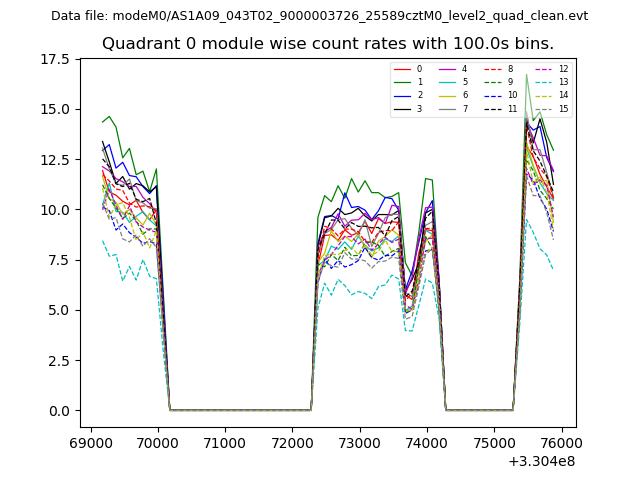 |
 |
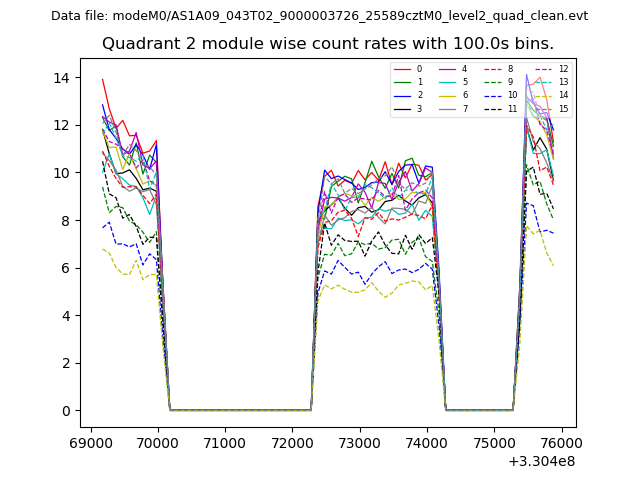
| Module-wise count rates for Quadrant B Data is divided into 100 sec bins |
 |
 |
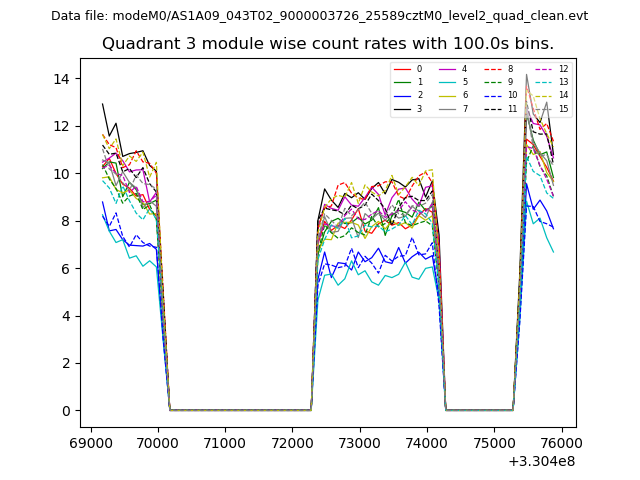
| Module-wise count rates for Quadrant C Data is divided into 100 sec bins |
 |
 |
| Module-wise count rates for Quadrant D Data is divided into 100 sec bins |
 |
 |
| Parameter | Plot |
|---|---|
| CZT HV Monitor |  |
| D_VDD | 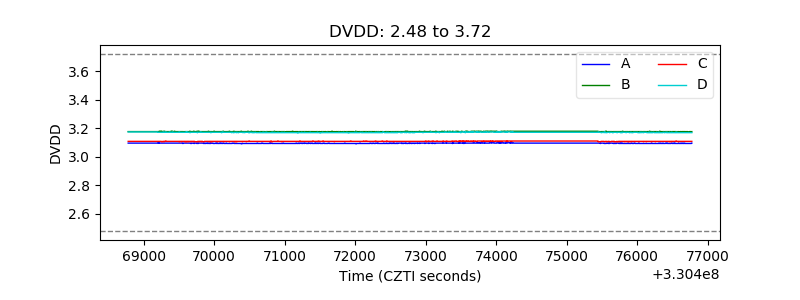 |
| Temperature 1 | 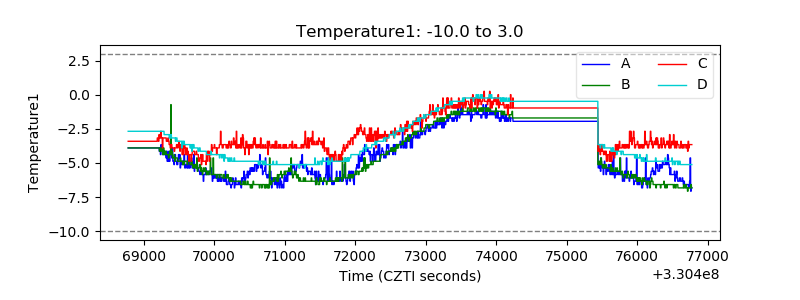 |
| Veto HV Monitor | 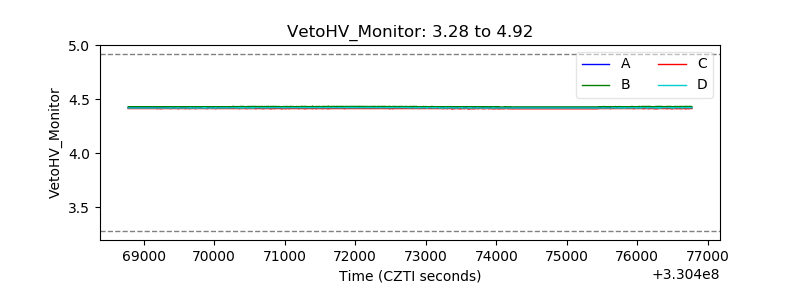 |
| Veto LLD | 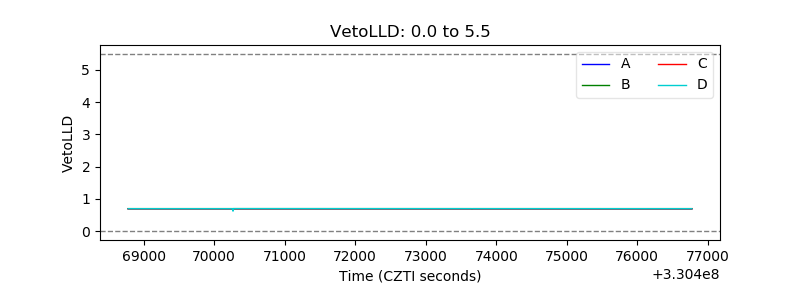 |
| Alpha Counter | 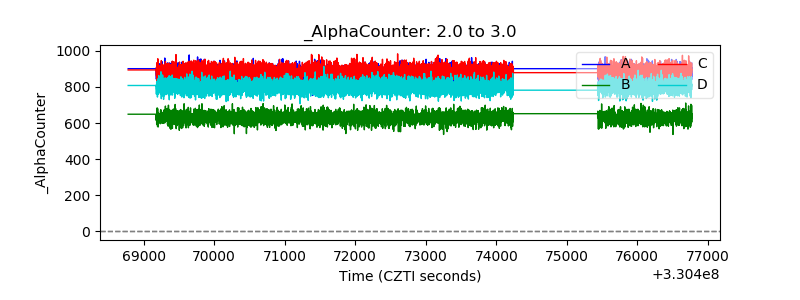 |
| _CPM_Rate | 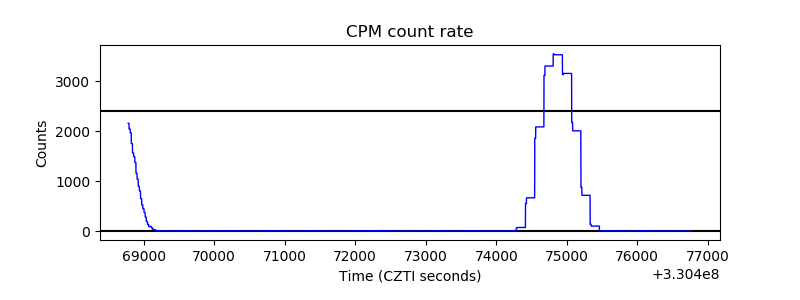 |
| CZT Counter | 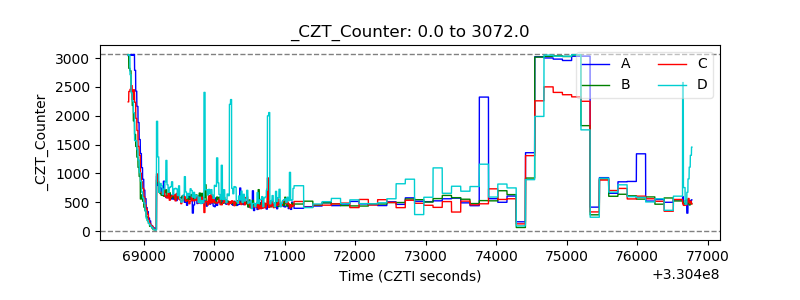 |
| +2.5 Volts monitor |  |
| +5 Volts monitor |  |
| _ROLL_ROT | 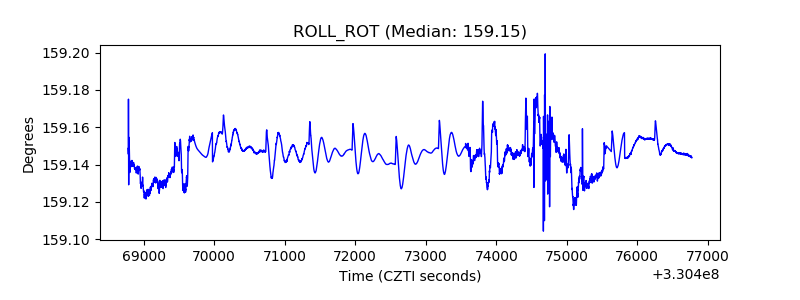 |
| _Roll_DEC | 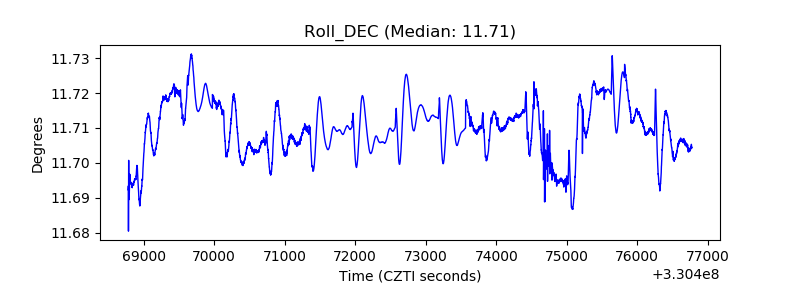 |
| _Roll_RA | 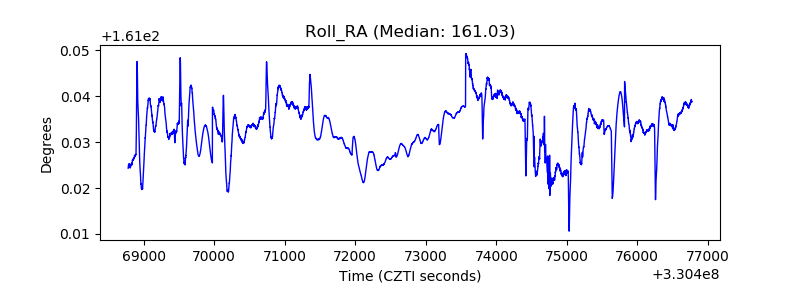 |
| Veto Counter |  |