| Param | Original file | Final file |
|---|---|---|
| Filename | modeM0/AS1A09_043T02_9000003726_25590cztM0_level2.evt | modeM0/AS1A09_043T02_9000003726_25590cztM0_level2_quad_clean.evt |
| Size (bytes) | 683,098,560 | 68,664,960 |
| Size | 651.5 MB | 65.5 MB |
| Events in quadrant A | 4,246,659 | 440,667 |
| Events in quadrant B | 3,602,338 | 455,100 |
| Events in quadrant C | 3,488,499 | 414,589 |
| Events in quadrant D | 8,914,116 | 317,830 |
| Mode M0 | |||
|---|---|---|---|
| Quadrant | BADHDUFLAG | Total packets | Discarded packets |
| A | 0 | 16523 | 0 |
| B | 0 | 14540 | 0 |
| C | 0 | 14144 | 0 |
| D | 0 | 30850 | 0 |
| Mode M9 | |||
|---|---|---|---|
| Quadrant | BADHDUFLAG | Total packets | Discarded packets |
| A | 0 | 20 | 0 |
| B | 0 | 21 | 0 |
| C | 0 | 21 | 0 |
| D | 0 | 21 | 0 |
| Quadrant | Total seconds | Saturated seconds | Saturation percentage |
|---|---|---|---|
| A | 6456 | 176 | 2.726146% |
| B | 6456 | 27 | 0.418216% |
| C | 6456 | 57 | 0.882900% |
| D | 6456 | 1818 | 28.159851% |
Noise dominated data is calculated using 1-second bins in cleaned event files. If a bin has >2000 counts, and if more than 50% of those come from <1% of pixels, then it is considered to be noise-dominated and hence unusable.
| Quadrant | # 1 sec bins | Bins with >0 counts | Bins with >2000 counts | High rate bins dominated by noise | Noise dominated (total time) | Noise dominated (detector-on time) | Marked lightcurve |
|---|---|---|---|---|---|---|---|
| A | 7786 | 6457 | 141 | 141 | 1.81% | 2.18% | 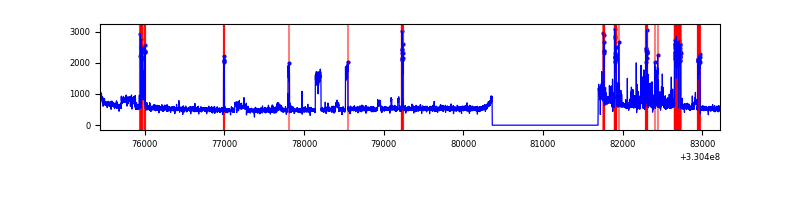 |
| B | 7786 | 6457 | 2 | 2 | 0.03% | 0.03% | 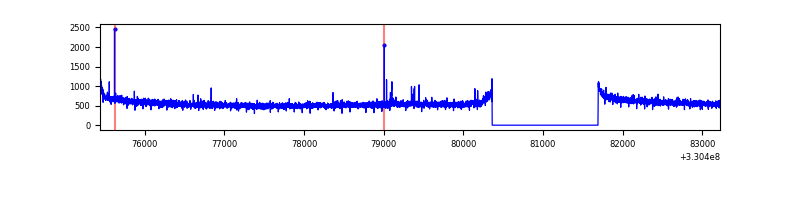 |
| C | 7786 | 6457 | 5 | 5 | 0.06% | 0.08% | 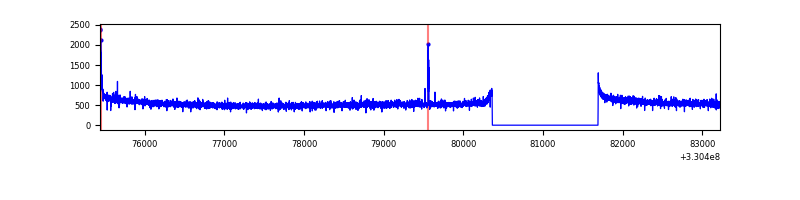 |
| D | 7786 | 6456 | 1668 | 1668 | 21.42% | 25.84% | 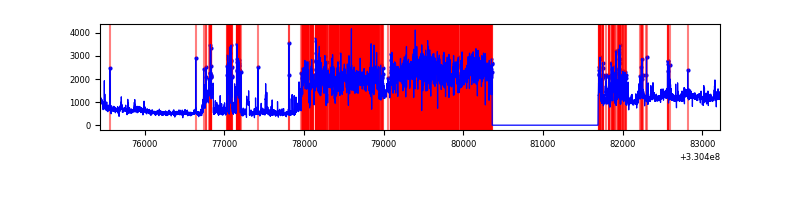 |
Top three noisy pixels from each quadrant. If the there are fewer than three noisy pixels in the level2.evt file, extra rows are filled as -1
| Pixel properties | Quadrant properties | ||||||
|---|---|---|---|---|---|---|---|
| Quadrant | DetID | PixID | Counts | Sigma | Mean | Median | Sigma |
| A | 8 | 192 | 588166 | 3299.04 | 902 | 887 | 178.0 |
| A | 6 | 16 | 180654 | 1009.84 | 902 | 887 | 178.0 |
| A | 13 | 254 | 10707 | 55.16 | 902 | 887 | 178.0 |
| B | 12 | 111 | 19312 | 109.14 | 908 | 890 | 168.8 |
| B | 11 | 111 | 17451 | 98.12 | 908 | 890 | 168.8 |
| B | 14 | 111 | 15784 | 88.24 | 908 | 890 | 168.8 |
| C | 14 | 238 | 140255 | 711.57 | 848 | 856 | 195.9 |
| C | 3 | 233 | 31461 | 156.22 | 848 | 856 | 195.9 |
| C | 0 | 207 | 13895 | 66.56 | 848 | 856 | 195.9 |
| D | 1 | 52 | 4386137 | 23500.35 | 778 | 758 | 186.6 |
| D | 12 | 2 | 1039289 | 5565.28 | 778 | 758 | 186.6 |
| D | 8 | 195 | 414897 | 2219.29 | 778 | 758 | 186.6 |
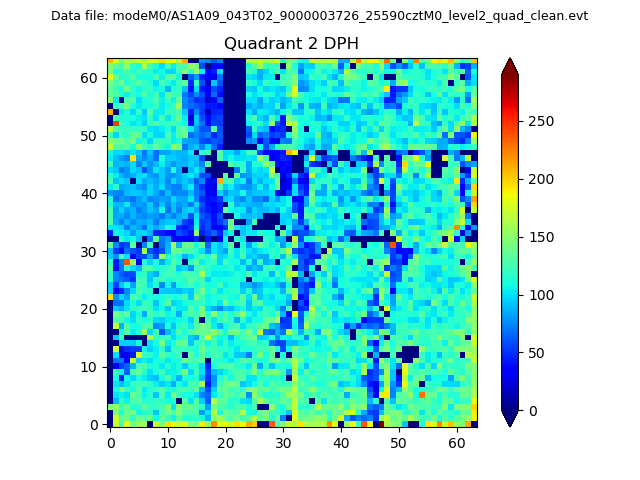
Histogram calculated using DETX and DETY for each event in the final _common_clean file
| Quadrant A | 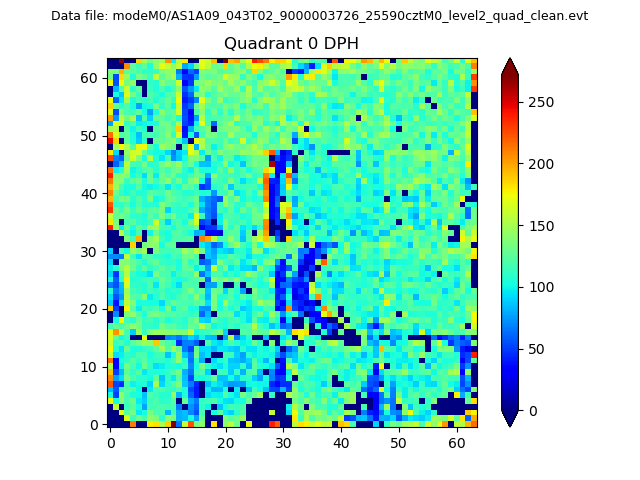 |
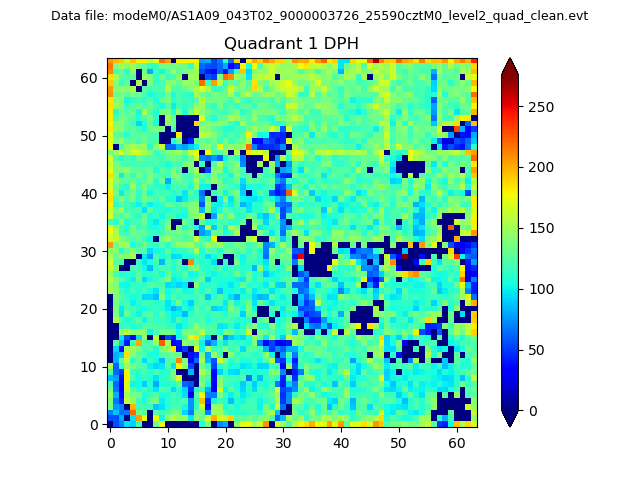 |
Quadrant B |
|---|---|---|---|
| Quadrant D | 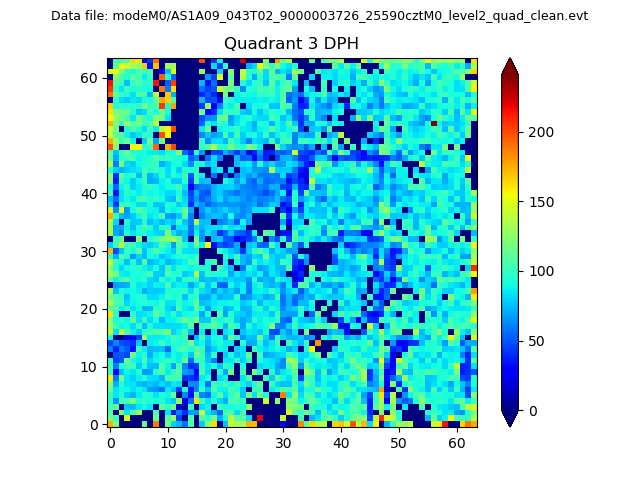 |
 |
Quadrant C |
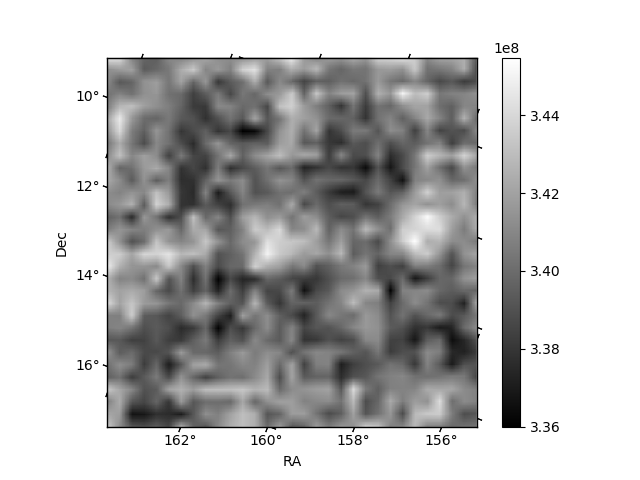
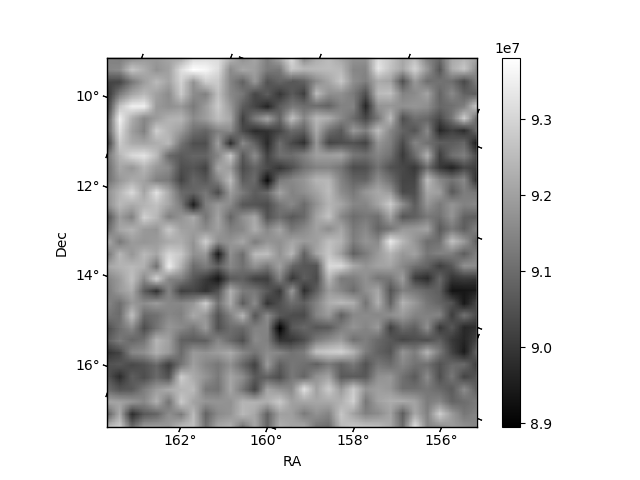
| Plot type | Count rate plots | Images |
|---|---|---|
| Comparison with Poisson distribution Blue bars denote a histogram of data divided into 1 sec bins. Red curve is a Poisson curve with rate = median count rate of data. |
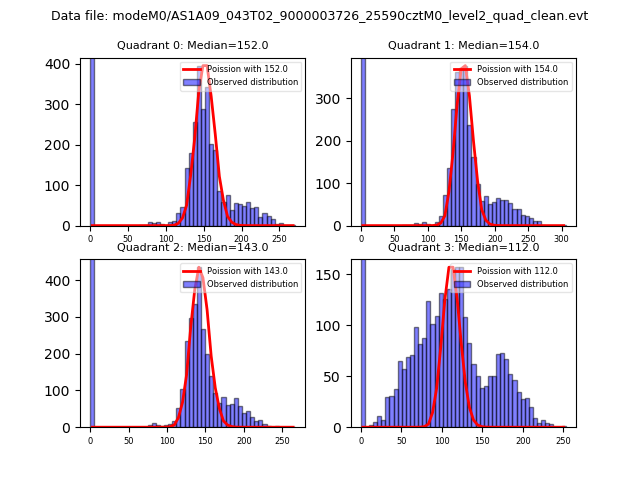 |
 |
| Quadrant-wise count rates Data is divided into 100 sec bins |
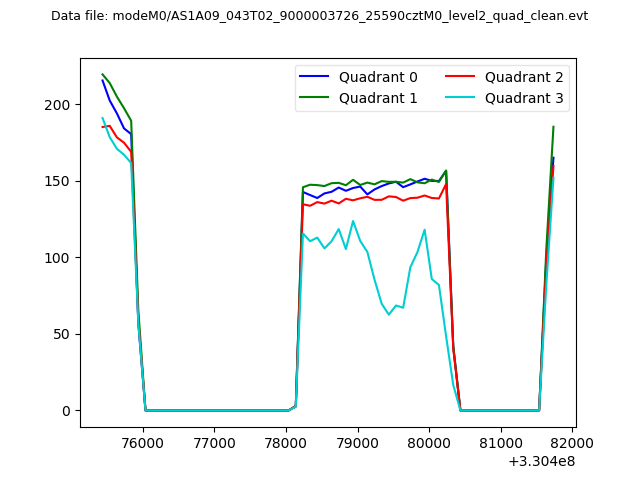 |
|
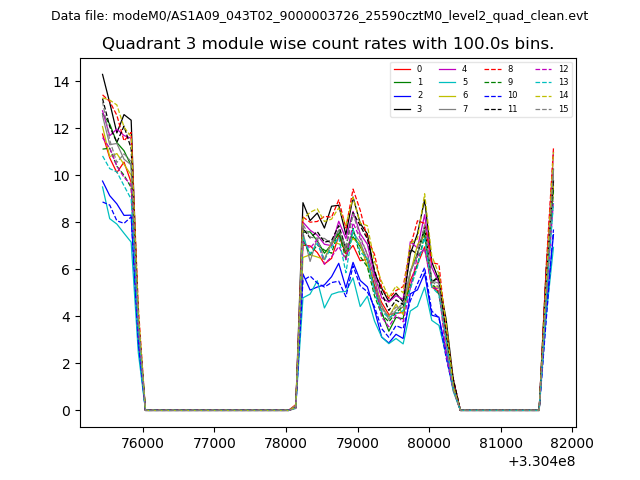
| Module-wise count rates for Quadrant A Data is divided into 100 sec bins |
 |
 |
| Module-wise count rates for Quadrant B Data is divided into 100 sec bins |
 |
 |
| Module-wise count rates for Quadrant C Data is divided into 100 sec bins |
 |
 |
| Module-wise count rates for Quadrant D Data is divided into 100 sec bins |
 |
 |
| Parameter | Plot |
|---|---|
| CZT HV Monitor |  |
| D_VDD | 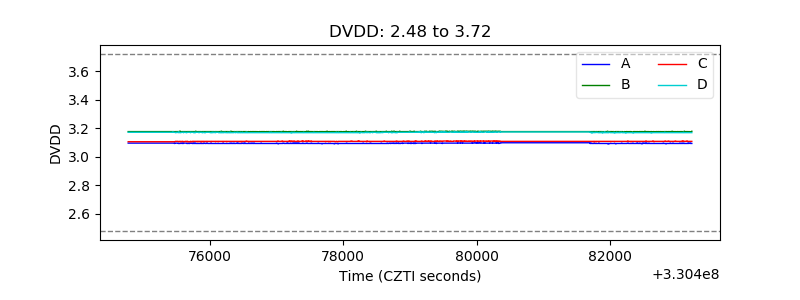 |
| Temperature 1 | 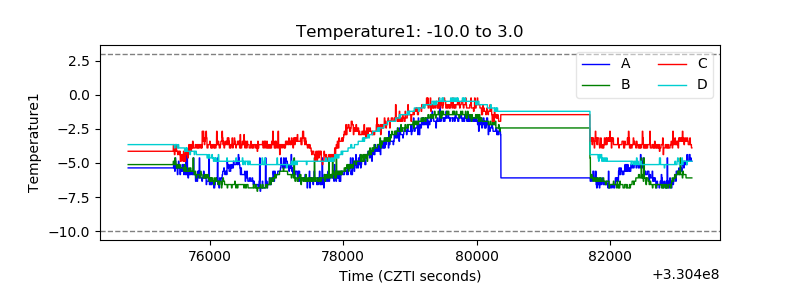 |
| Veto HV Monitor | 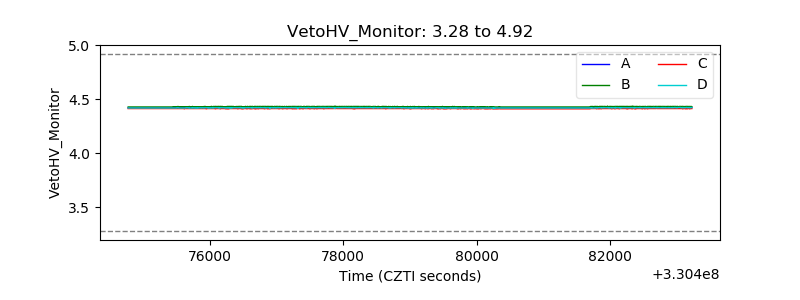 |
| Veto LLD | 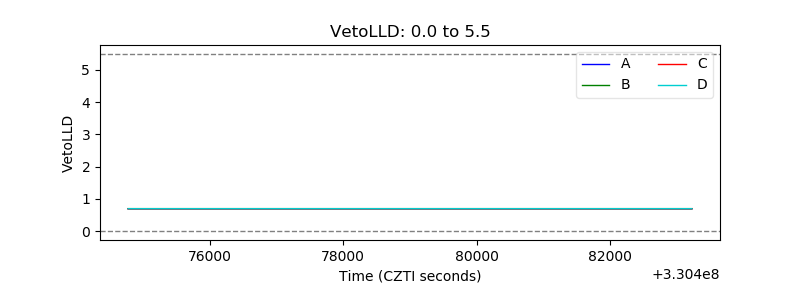 |
| Alpha Counter | 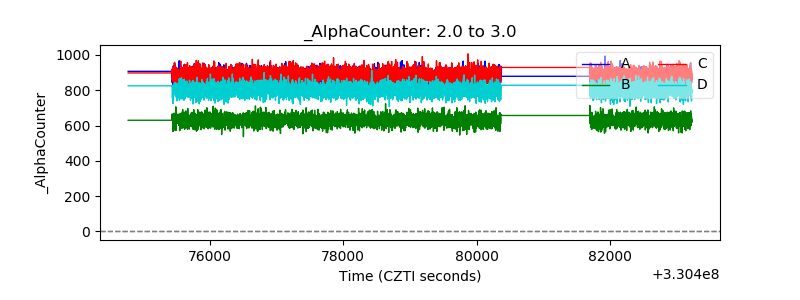 |
| _CPM_Rate | 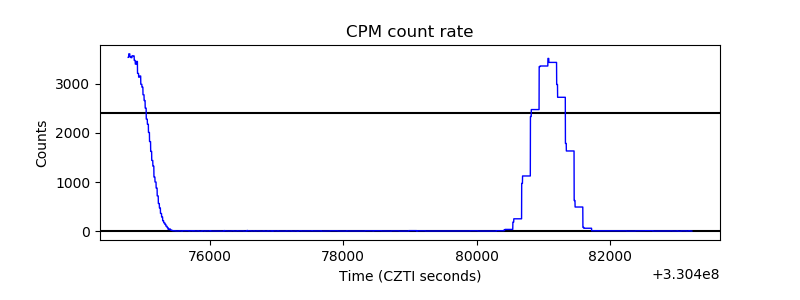 |
| CZT Counter | 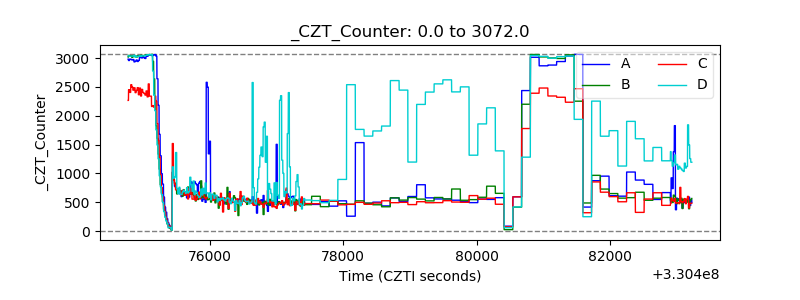 |
| +2.5 Volts monitor |  |
| +5 Volts monitor |  |
| _ROLL_ROT | 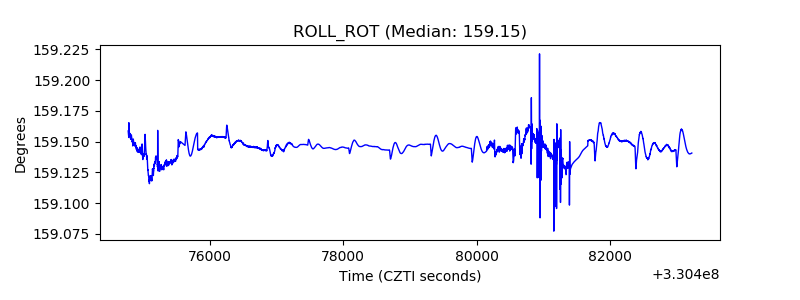 |
| _Roll_DEC | 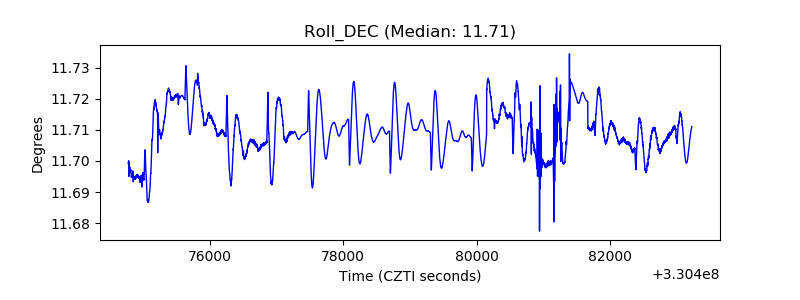 |
| _Roll_RA | 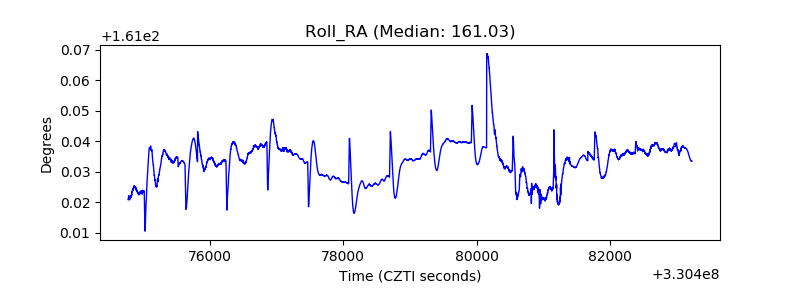 |
| Veto Counter |  |