| Param | Original file | Final file |
|---|---|---|
| Filename | modeM0/AS1A09_043T02_9000003726_25591cztM0_level2.evt | modeM0/AS1A09_043T02_9000003726_25591cztM0_level2_quad_clean.evt |
| Size (bytes) | 681,894,720 | 65,911,680 |
| Size | 650.3 MB | 62.9 MB |
| Events in quadrant A | 4,604,939 | 404,955 |
| Events in quadrant B | 3,717,037 | 414,015 |
| Events in quadrant C | 3,517,236 | 380,413 |
| Events in quadrant D | 8,381,342 | 350,429 |
| Mode M0 | |||
|---|---|---|---|
| Quadrant | BADHDUFLAG | Total packets | Discarded packets |
| A | 0 | 17719 | 0 |
| B | 0 | 14876 | 0 |
| C | 0 | 14106 | 0 |
| D | 0 | 29390 | 0 |
| Mode M9 | |||
|---|---|---|---|
| Quadrant | BADHDUFLAG | Total packets | Discarded packets |
| A | 0 | 19 | 0 |
| B | 0 | 20 | 0 |
| C | 0 | 20 | 0 |
| D | 0 | 20 | 0 |
| Quadrant | Total seconds | Saturated seconds | Saturation percentage |
|---|---|---|---|
| A | 6394 | 265 | 4.144510% |
| B | 6394 | 67 | 1.047857% |
| C | 6394 | 90 | 1.407570% |
| D | 6393 | 696 | 10.886908% |
Noise dominated data is calculated using 1-second bins in cleaned event files. If a bin has >2000 counts, and if more than 50% of those come from <1% of pixels, then it is considered to be noise-dominated and hence unusable.
| Quadrant | # 1 sec bins | Bins with >0 counts | Bins with >2000 counts | High rate bins dominated by noise | Noise dominated (total time) | Noise dominated (detector-on time) | Marked lightcurve |
|---|---|---|---|---|---|---|---|
| A | 7744 | 6395 | 172 | 172 | 2.22% | 2.69% | 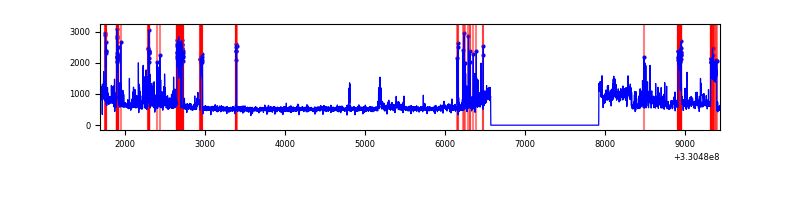 |
| B | 7744 | 6395 | 7 | 7 | 0.09% | 0.11% | 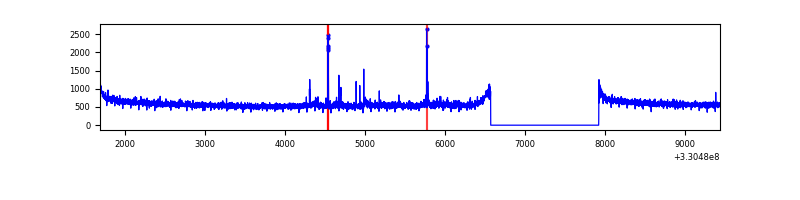 |
| C | 7744 | 6395 | 0 | 0 | 0.00% | 0.00% | 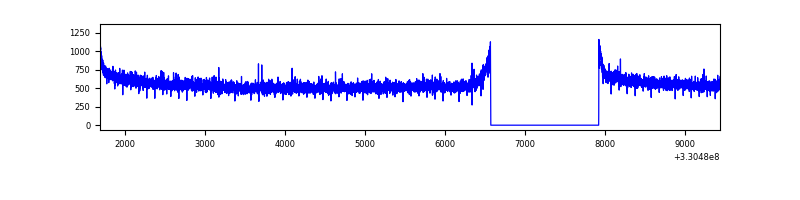 |
| D | 7743 | 6394 | 495 | 495 | 6.39% | 7.74% | 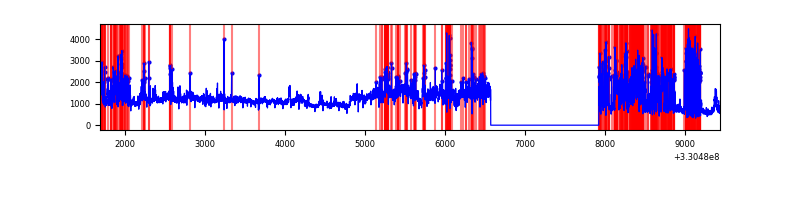 |
Top three noisy pixels from each quadrant. If the there are fewer than three noisy pixels in the level2.evt file, extra rows are filled as -1
| Pixel properties | Quadrant properties | ||||||
|---|---|---|---|---|---|---|---|
| Quadrant | DetID | PixID | Counts | Sigma | Mean | Median | Sigma |
| A | 6 | 16 | 544594 | 2996.09 | 924 | 910 | 181.5 |
| A | 8 | 192 | 433962 | 2386.43 | 924 | 910 | 181.5 |
| A | 9 | 130 | 68580 | 372.91 | 924 | 910 | 181.5 |
| B | 0 | 219 | 39141 | 222.67 | 928 | 911 | 171.7 |
| B | 5 | 235 | 28436 | 160.32 | 928 | 911 | 171.7 |
| B | 12 | 111 | 20104 | 111.79 | 928 | 911 | 171.7 |
| C | 14 | 238 | 141548 | 710.56 | 864 | 873 | 198.0 |
| C | 3 | 233 | 8758 | 39.83 | 864 | 873 | 198.0 |
| C | 13 | 61 | 5982 | 25.81 | 864 | 873 | 198.0 |
| D | 1 | 52 | 3880008 | 18865.95 | 840 | 816 | 205.6 |
| D | 8 | 195 | 739427 | 3592.14 | 840 | 816 | 205.6 |
| D | 2 | 244 | 264022 | 1280.07 | 840 | 816 | 205.6 |
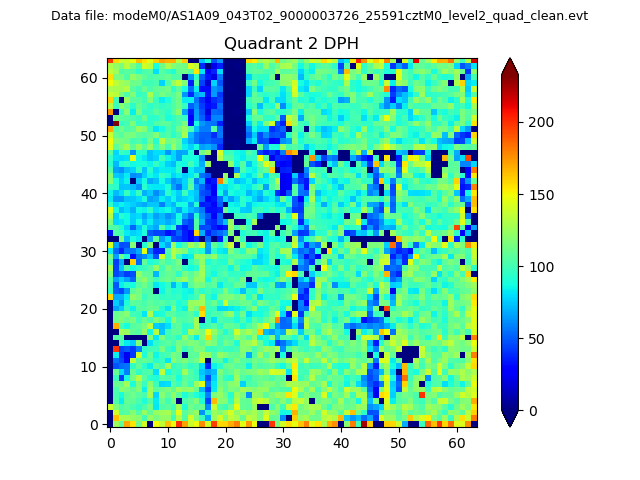
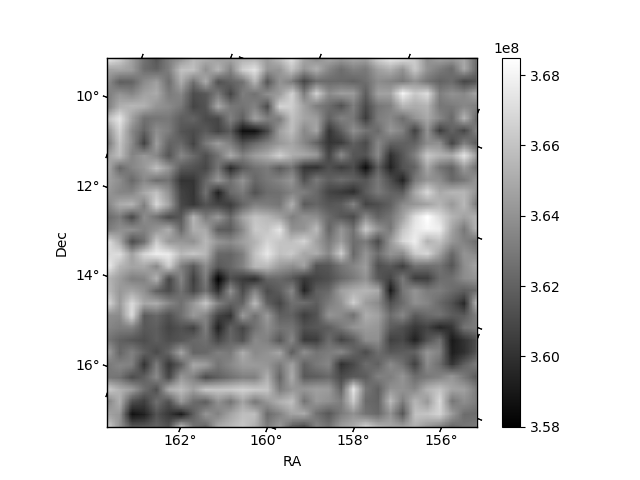
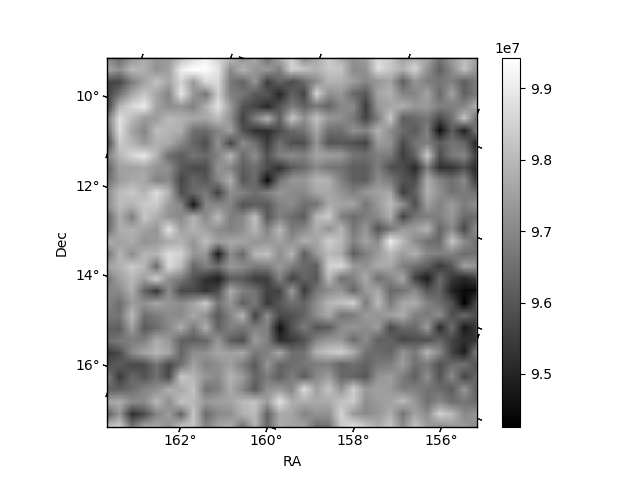
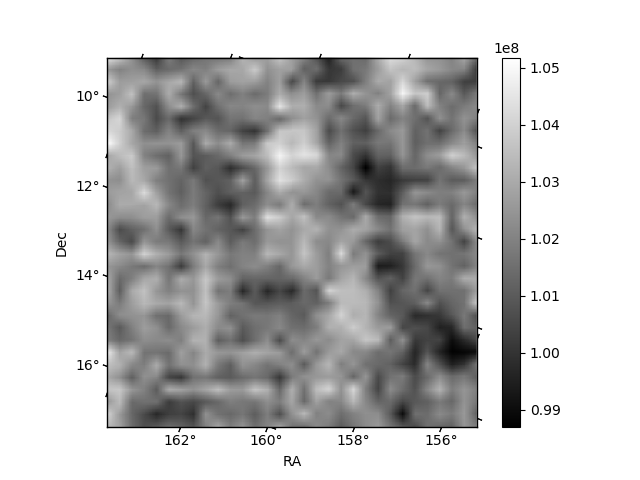
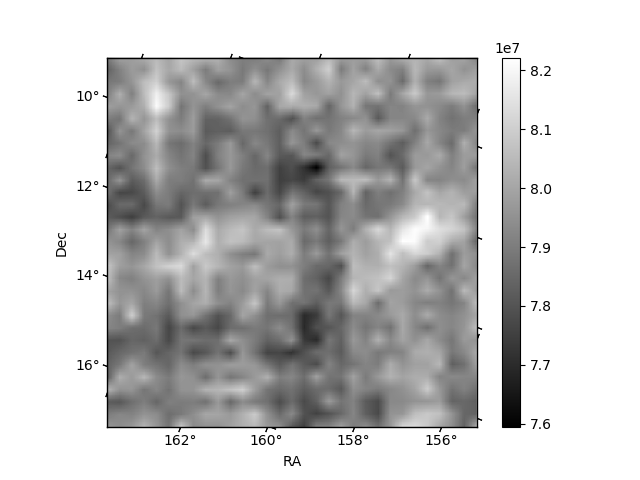
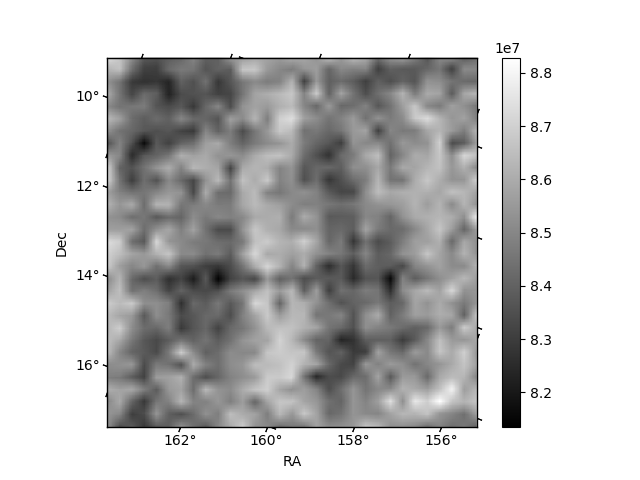
Histogram calculated using DETX and DETY for each event in the final _common_clean file
| Quadrant A | 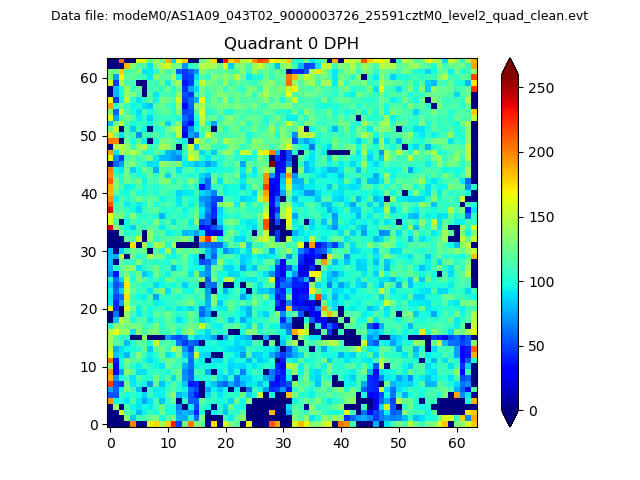 |
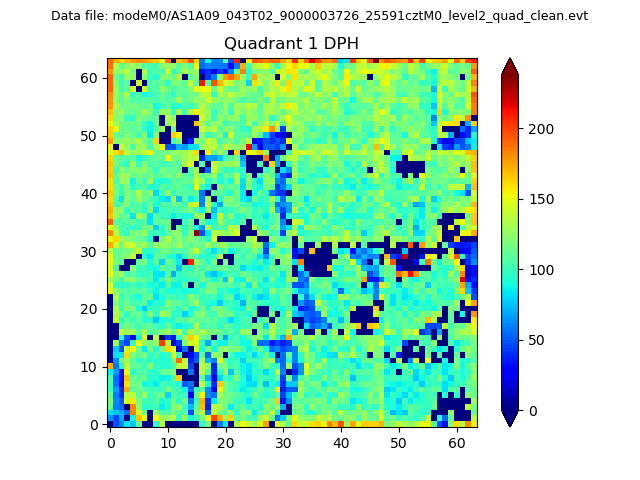 |
Quadrant B |
|---|---|---|---|
| Quadrant D | 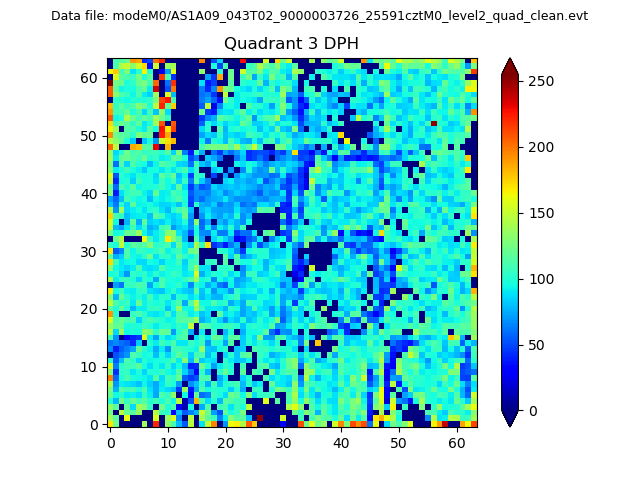 |
 |
Quadrant C |
| Plot type | Count rate plots | Images |
|---|---|---|
| Comparison with Poisson distribution Blue bars denote a histogram of data divided into 1 sec bins. Red curve is a Poisson curve with rate = median count rate of data. |
 |
 |
| Quadrant-wise count rates Data is divided into 100 sec bins |
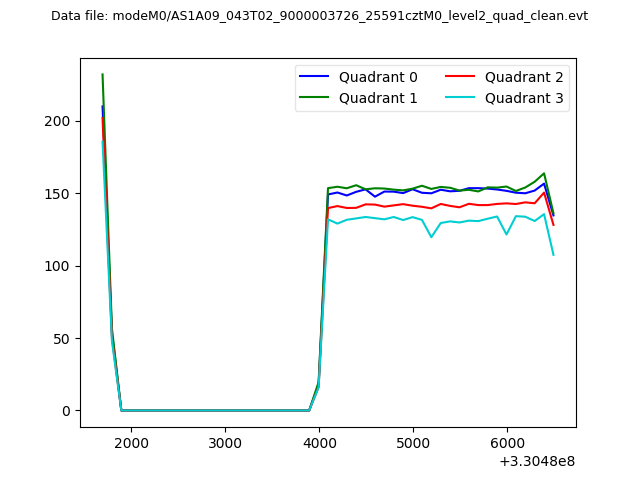 |
|
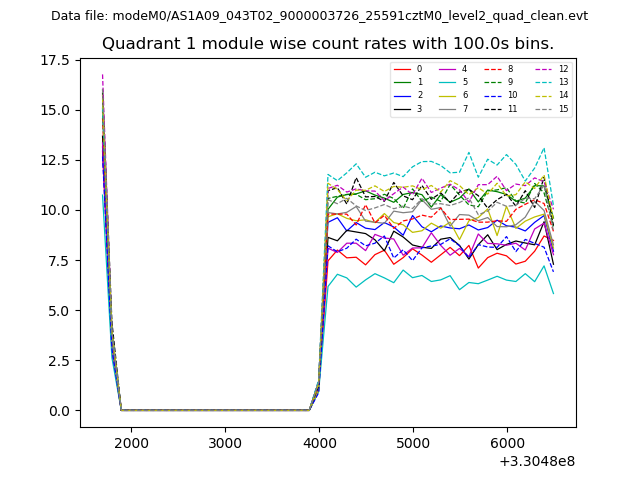
| Module-wise count rates for Quadrant A Data is divided into 100 sec bins |
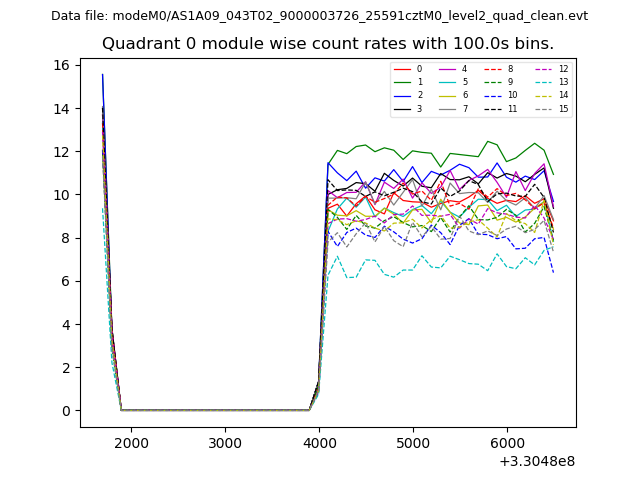 |
 |
| Module-wise count rates for Quadrant B Data is divided into 100 sec bins |
 |
 |
| Module-wise count rates for Quadrant C Data is divided into 100 sec bins |
 |
 |
| Module-wise count rates for Quadrant D Data is divided into 100 sec bins |
 |
 |
| Parameter | Plot |
|---|---|
| CZT HV Monitor |  |
| D_VDD | 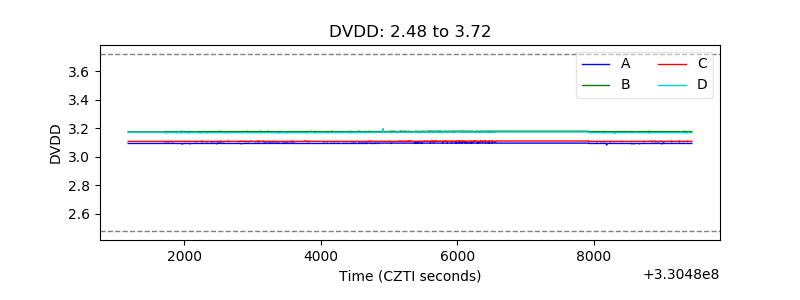 |
| Temperature 1 | 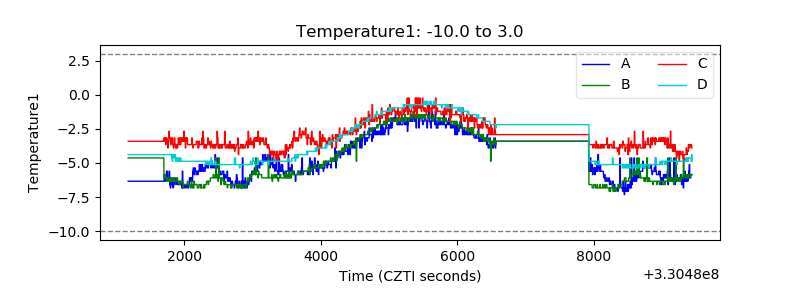 |
| Veto HV Monitor | 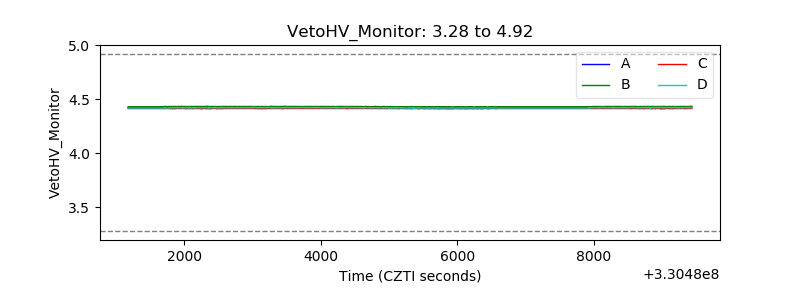 |
| Veto LLD | 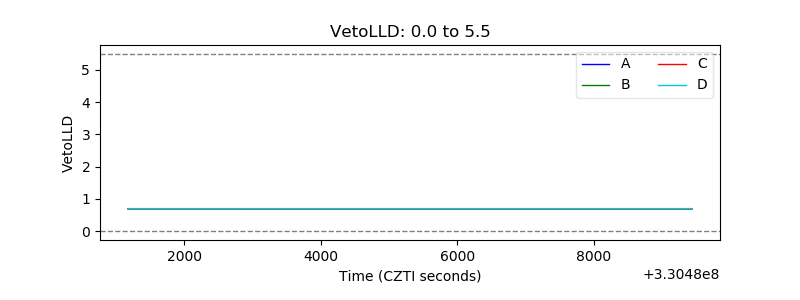 |
| Alpha Counter | 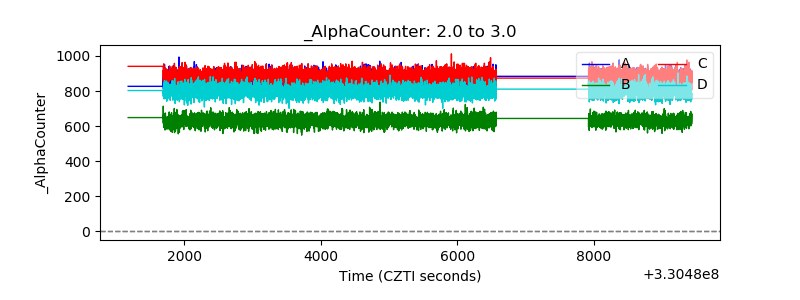 |
| _CPM_Rate | 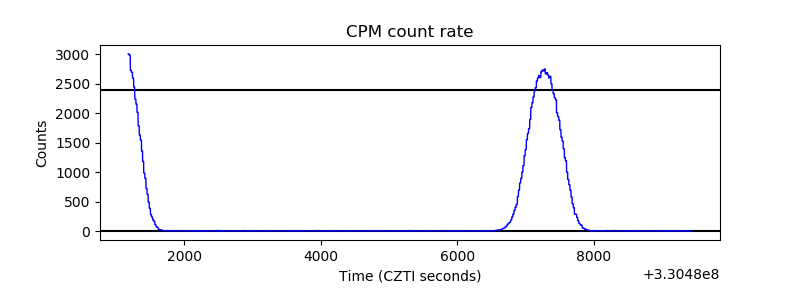 |
| CZT Counter | 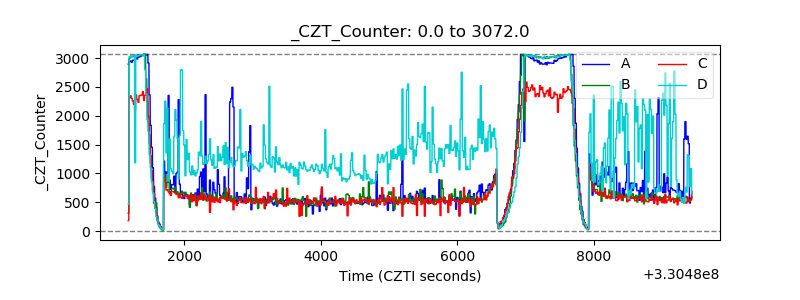 |
| +2.5 Volts monitor |  |
| +5 Volts monitor |  |
| _ROLL_ROT |  |
| _Roll_DEC | 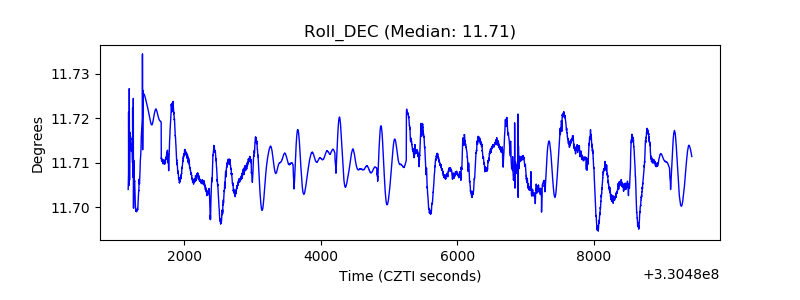 |
| _Roll_RA | 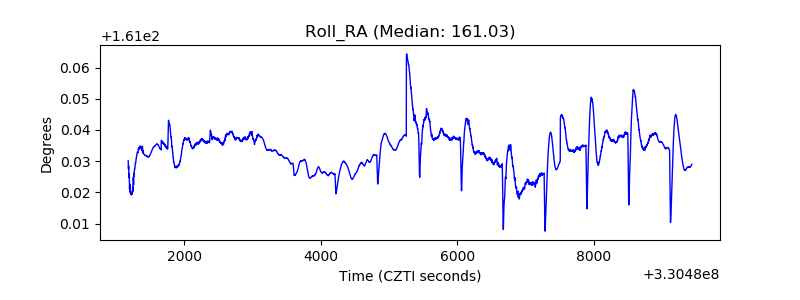 |
| Veto Counter |  |