| Param | Original file | Final file |
|---|---|---|
| Filename | modeM0/AS1A09_043T02_9000003726_25592cztM0_level2.evt | modeM0/AS1A09_043T02_9000003726_25592cztM0_level2_quad_clean.evt |
| Size (bytes) | 689,420,160 | 70,315,200 |
| Size | 657.5 MB | 67.1 MB |
| Events in quadrant A | 5,750,546 | 423,089 |
| Events in quadrant B | 3,669,900 | 457,324 |
| Events in quadrant C | 3,487,448 | 420,478 |
| Events in quadrant D | 7,543,344 | 385,511 |
| Mode M0 | |||
|---|---|---|---|
| Quadrant | BADHDUFLAG | Total packets | Discarded packets |
| A | 0 | 21377 | 0 |
| B | 0 | 14678 | 0 |
| C | 0 | 13974 | 0 |
| D | 0 | 26941 | 0 |
| Mode M9 | |||
|---|---|---|---|
| Quadrant | BADHDUFLAG | Total packets | Discarded packets |
| A | 0 | 16 | 0 |
| B | 0 | 17 | 0 |
| C | 0 | 17 | 0 |
| D | 0 | 17 | 0 |
| Quadrant | Total seconds | Saturated seconds | Saturation percentage |
|---|---|---|---|
| A | 6340 | 782 | 12.334385% |
| B | 6340 | 164 | 2.586751% |
| C | 6340 | 167 | 2.634069% |
| D | 6339 | 971 | 15.317873% |
Noise dominated data is calculated using 1-second bins in cleaned event files. If a bin has >2000 counts, and if more than 50% of those come from <1% of pixels, then it is considered to be noise-dominated and hence unusable.
| Quadrant | # 1 sec bins | Bins with >0 counts | Bins with >2000 counts | High rate bins dominated by noise | Noise dominated (total time) | Noise dominated (detector-on time) | Marked lightcurve |
|---|---|---|---|---|---|---|---|
| A | 7610 | 6341 | 479 | 479 | 6.29% | 7.55% | 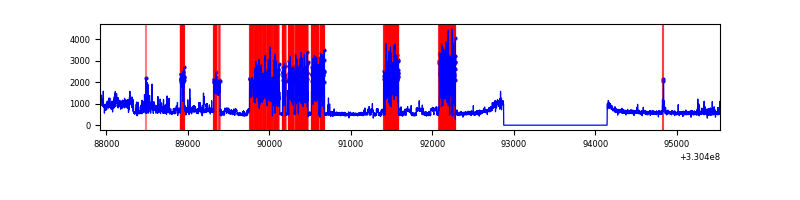 |
| B | 7610 | 6341 | 0 | 0 | 0.00% | 0.00% | 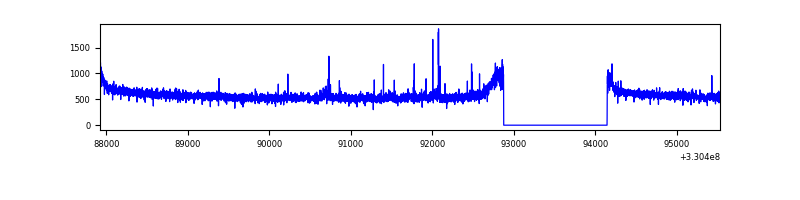 |
| C | 7610 | 6341 | 0 | 0 | 0.00% | 0.00% | 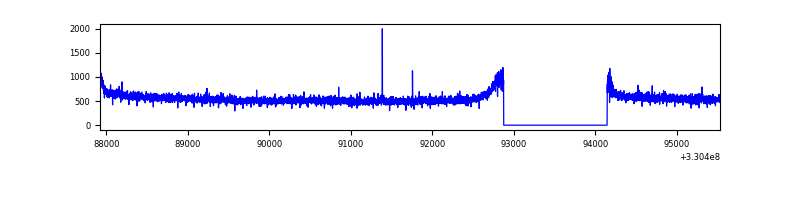 |
| D | 7609 | 6340 | 733 | 733 | 9.63% | 11.56% | 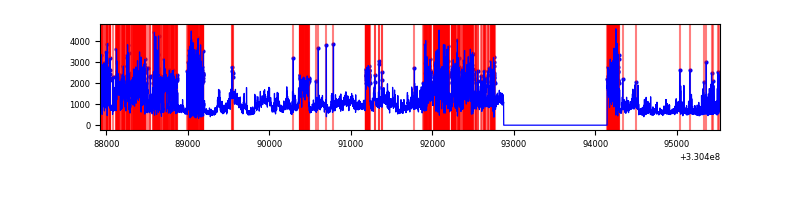 |
Top three noisy pixels from each quadrant. If the there are fewer than three noisy pixels in the level2.evt file, extra rows are filled as -1
| Pixel properties | Quadrant properties | ||||||
|---|---|---|---|---|---|---|---|
| Quadrant | DetID | PixID | Counts | Sigma | Mean | Median | Sigma |
| A | 8 | 192 | 1896133 | 10547.54 | 903 | 889 | 179.7 |
| A | 6 | 16 | 344593 | 1912.8 | 903 | 889 | 179.7 |
| A | 9 | 130 | 32125 | 173.84 | 903 | 889 | 179.7 |
| B | 0 | 219 | 47376 | 271.38 | 917 | 899 | 171.3 |
| B | 12 | 111 | 20170 | 112.52 | 917 | 899 | 171.3 |
| B | 11 | 111 | 17804 | 98.71 | 917 | 899 | 171.3 |
| C | 14 | 238 | 139311 | 693.47 | 857 | 864 | 199.6 |
| C | 3 | 233 | 6218 | 26.82 | 857 | 864 | 199.6 |
| C | 13 | 61 | 5856 | 25.0 | 857 | 864 | 199.6 |
| D | 1 | 52 | 2229658 | 11154.73 | 823 | 799 | 199.8 |
| D | 9 | 35 | 1074190 | 5371.98 | 823 | 799 | 199.8 |
| D | 8 | 195 | 723608 | 3617.43 | 823 | 799 | 199.8 |
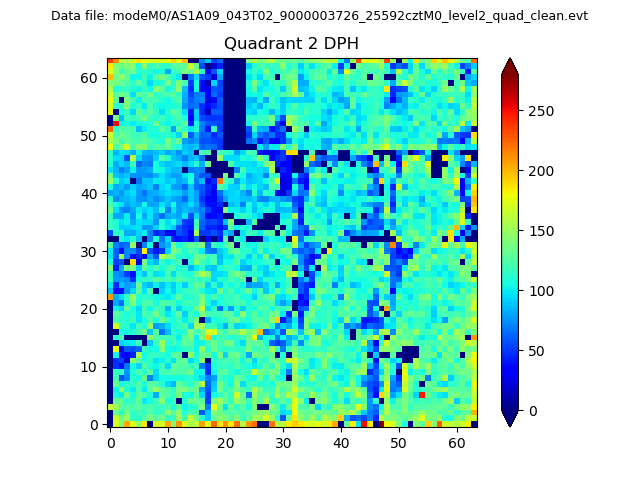
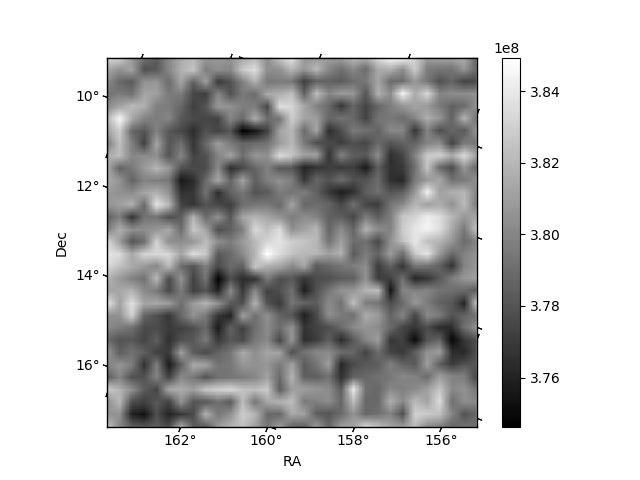
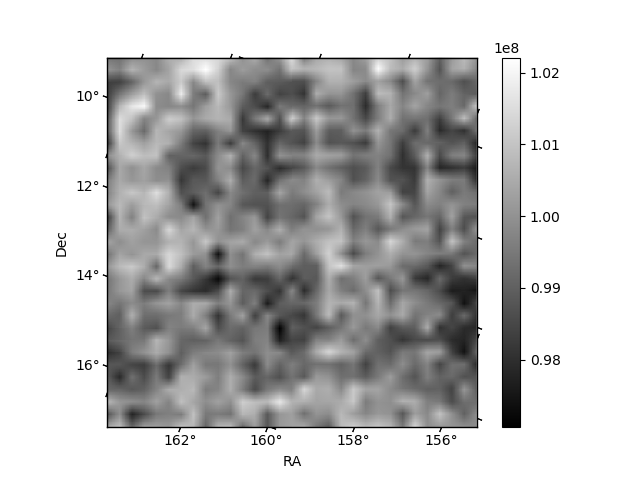
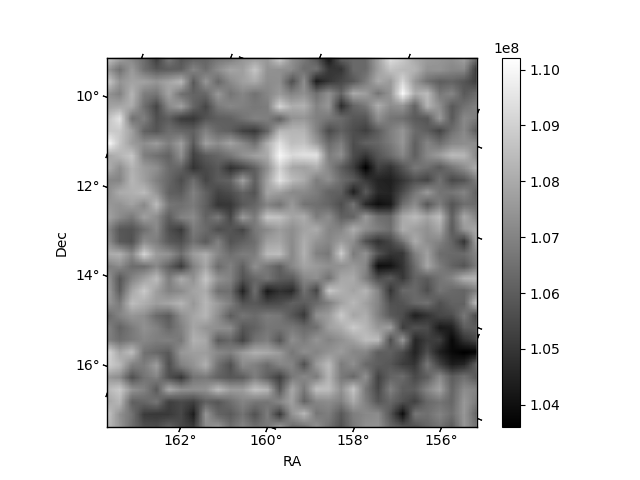
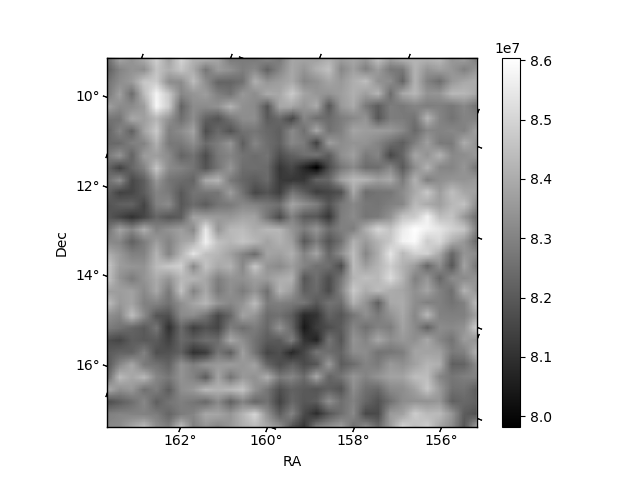
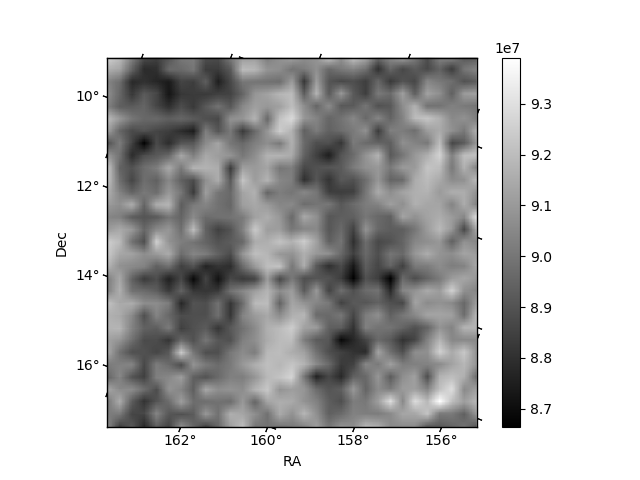
Histogram calculated using DETX and DETY for each event in the final _common_clean file
| Quadrant A | 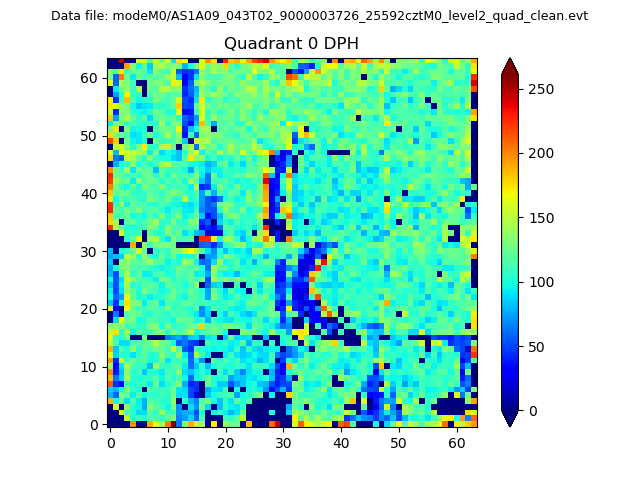 |
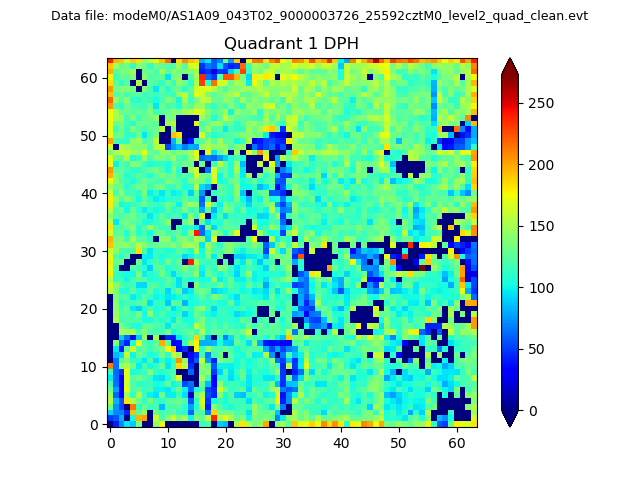 |
Quadrant B |
|---|---|---|---|
| Quadrant D | 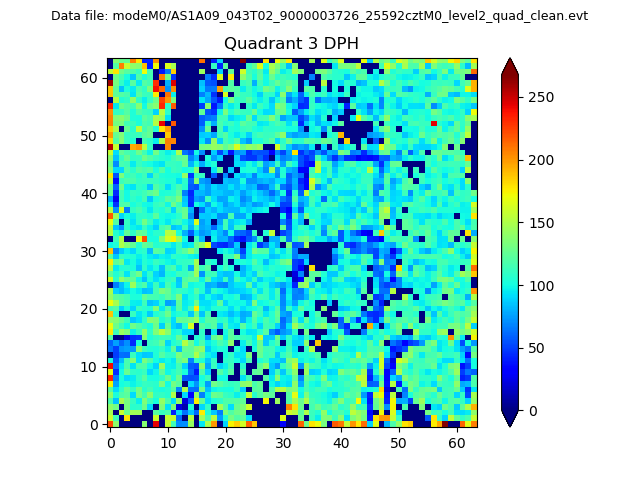 |
 |
Quadrant C |
| Plot type | Count rate plots | Images |
|---|---|---|
| Comparison with Poisson distribution Blue bars denote a histogram of data divided into 1 sec bins. Red curve is a Poisson curve with rate = median count rate of data. |
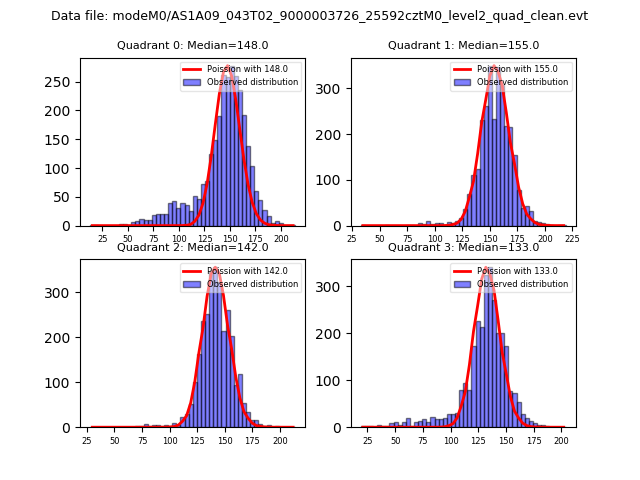 |
 |
| Quadrant-wise count rates Data is divided into 100 sec bins |
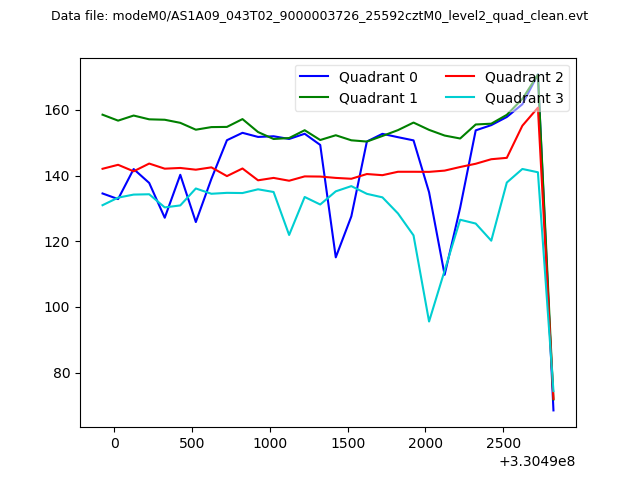 |
|
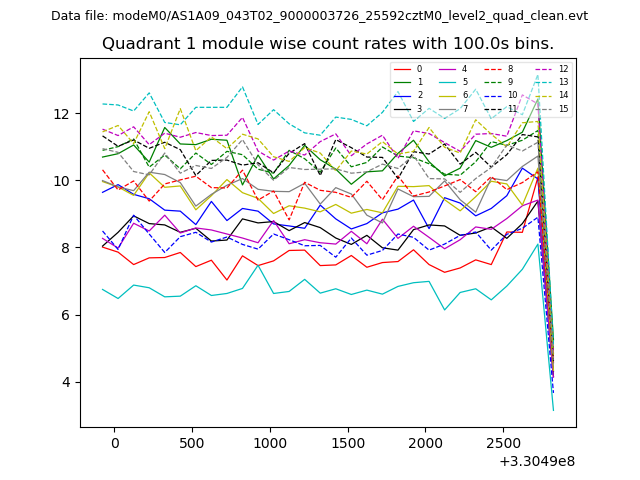
| Module-wise count rates for Quadrant A Data is divided into 100 sec bins |
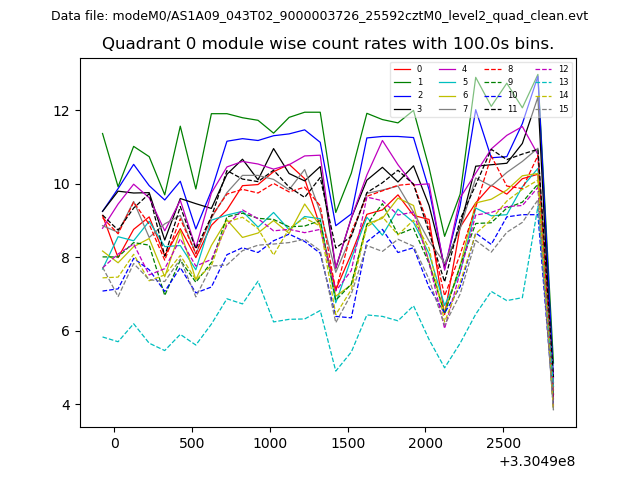 |
 |
| Module-wise count rates for Quadrant B Data is divided into 100 sec bins |
 |
 |
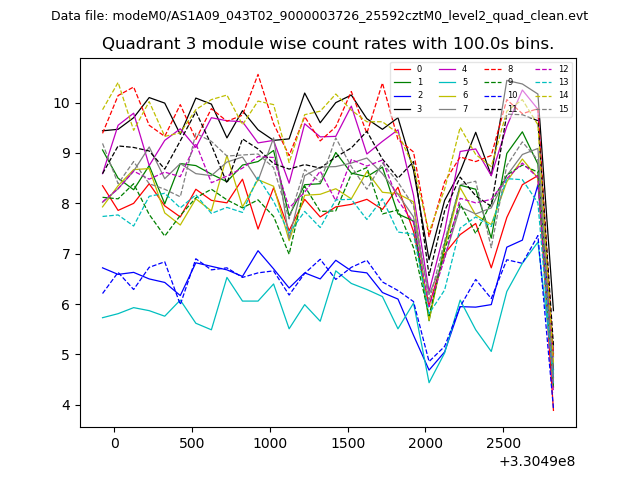
| Module-wise count rates for Quadrant C Data is divided into 100 sec bins |
 |
 |
| Module-wise count rates for Quadrant D Data is divided into 100 sec bins |
 |
 |
| Parameter | Plot |
|---|---|
| CZT HV Monitor |  |
| D_VDD | 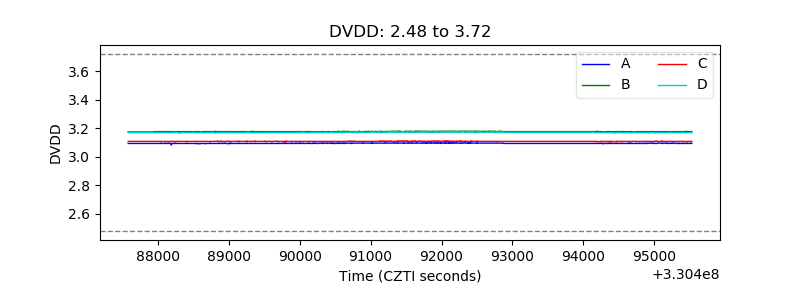 |
| Temperature 1 | 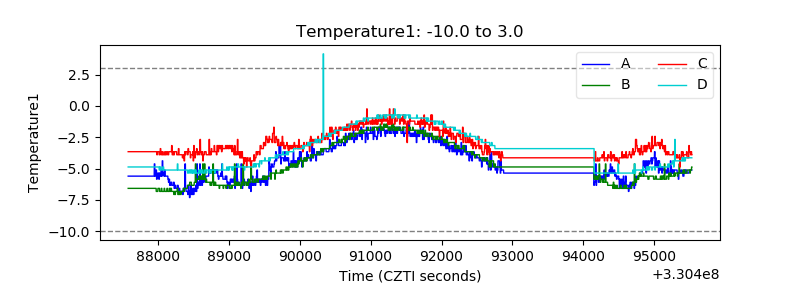 |
| Veto HV Monitor | 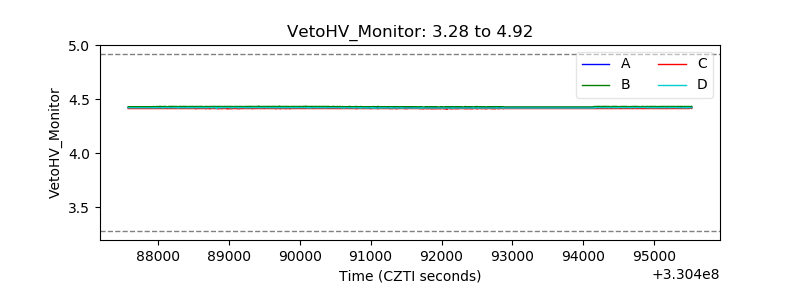 |
| Veto LLD | 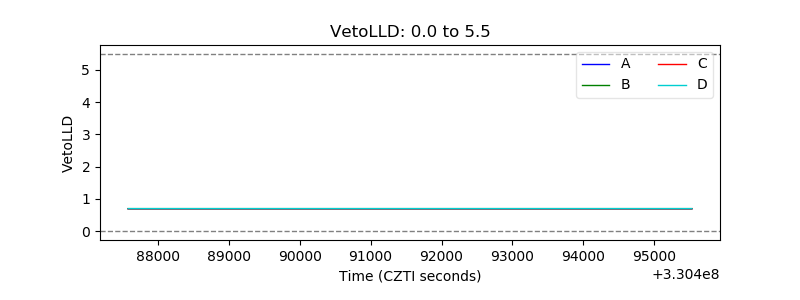 |
| Alpha Counter | 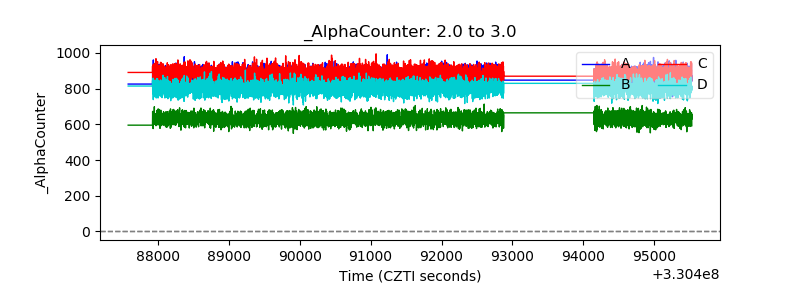 |
| _CPM_Rate | 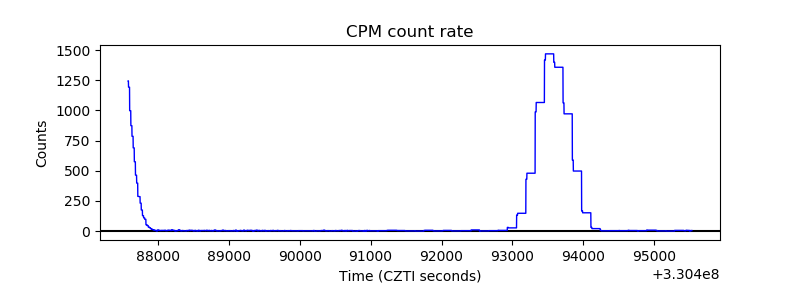 |
| CZT Counter | 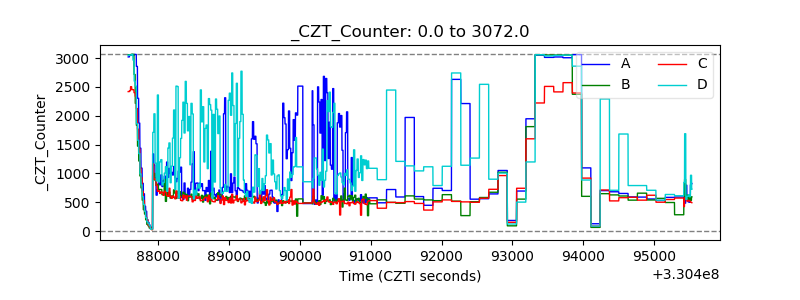 |
| +2.5 Volts monitor |  |
| +5 Volts monitor |  |
| _ROLL_ROT | 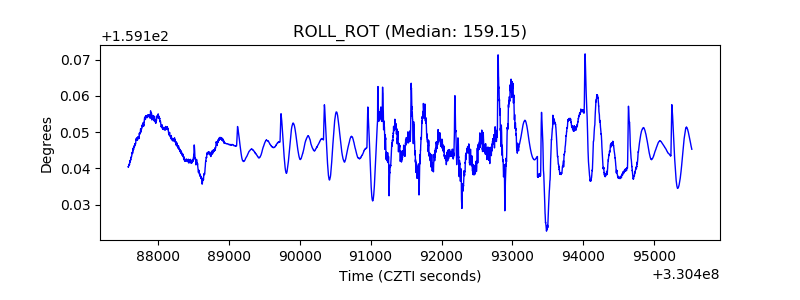 |
| _Roll_DEC | 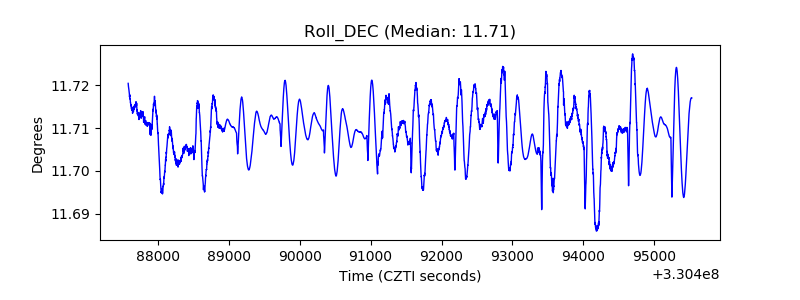 |
| _Roll_RA | 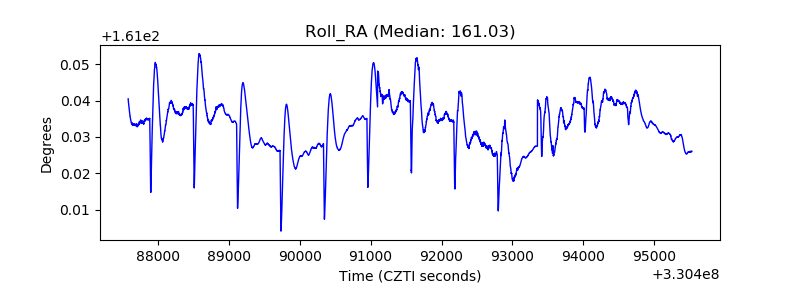 |
| Veto Counter | 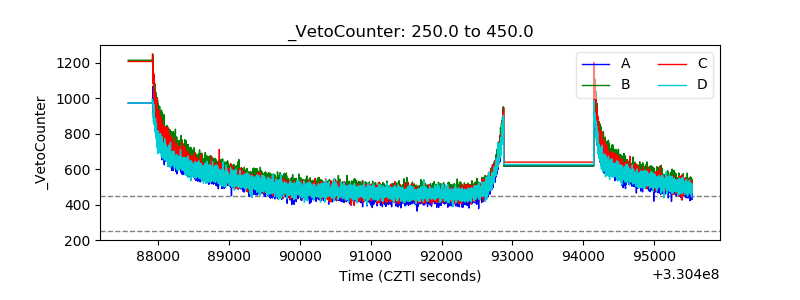 |