| Param | Original file | Final file |
|---|---|---|
| Filename | modeM0/AS1A09_043T02_9000003726_25593cztM0_level2.evt | modeM0/AS1A09_043T02_9000003726_25593cztM0_level2_quad_clean.evt |
| Size (bytes) | 613,376,640 | 82,065,600 |
| Size | 585.0 MB | 78.3 MB |
| Events in quadrant A | 3,820,390 | 540,800 |
| Events in quadrant B | 3,595,607 | 548,618 |
| Events in quadrant C | 3,438,277 | 507,510 |
| Events in quadrant D | 7,282,956 | 435,436 |
| Mode M0 | |||
|---|---|---|---|
| Quadrant | BADHDUFLAG | Total packets | Discarded packets |
| A | 0 | 15193 | 0 |
| B | 0 | 14384 | 0 |
| C | 0 | 13886 | 0 |
| D | 0 | 26474 | 0 |
| Mode M9 | |||
|---|---|---|---|
| Quadrant | BADHDUFLAG | Total packets | Discarded packets |
| A | 0 | 14 | 0 |
| B | 0 | 15 | 0 |
| C | 0 | 15 | 0 |
| D | 0 | 15 | 0 |
| Quadrant | Total seconds | Saturated seconds | Saturation percentage |
|---|---|---|---|
| A | 6484 | 120 | 1.850709% |
| B | 6484 | 145 | 2.236274% |
| C | 6484 | 158 | 2.436767% |
| D | 6483 | 1070 | 16.504705% |
Noise dominated data is calculated using 1-second bins in cleaned event files. If a bin has >2000 counts, and if more than 50% of those come from <1% of pixels, then it is considered to be noise-dominated and hence unusable.
| Quadrant | # 1 sec bins | Bins with >0 counts | Bins with >2000 counts | High rate bins dominated by noise | Noise dominated (total time) | Noise dominated (detector-on time) | Marked lightcurve |
|---|---|---|---|---|---|---|---|
| A | 7650 | 6485 | 6 | 6 | 0.08% | 0.09% | 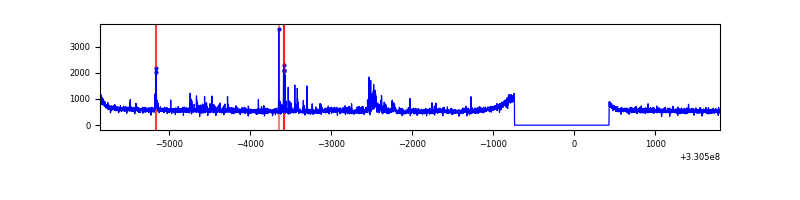 |
| B | 7650 | 6485 | 0 | 0 | 0.00% | 0.00% | 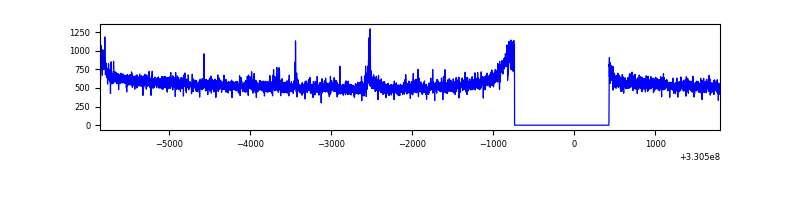 |
| C | 7650 | 6484 | 0 | 0 | 0.00% | 0.00% | 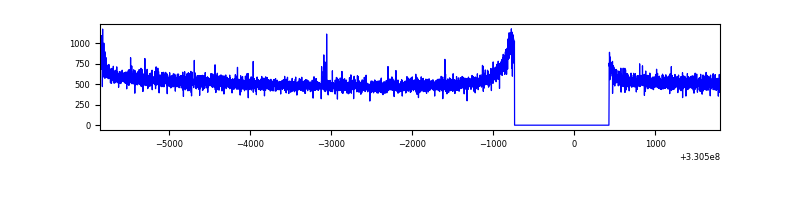 |
| D | 7649 | 6484 | 830 | 830 | 10.85% | 12.80% | 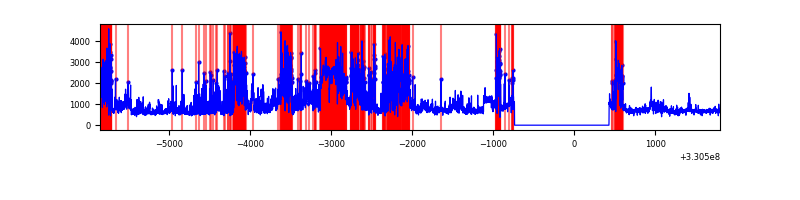 |
Top three noisy pixels from each quadrant. If the there are fewer than three noisy pixels in the level2.evt file, extra rows are filled as -1
| Pixel properties | Quadrant properties | ||||||
|---|---|---|---|---|---|---|---|
| Quadrant | DetID | PixID | Counts | Sigma | Mean | Median | Sigma |
| A | 6 | 16 | 196405 | 1087.13 | 902 | 886 | 179.8 |
| A | 8 | 192 | 147478 | 815.09 | 902 | 886 | 179.8 |
| A | 13 | 254 | 10801 | 55.13 | 902 | 886 | 179.8 |
| B | 0 | 219 | 59203 | 344.04 | 894 | 874 | 169.5 |
| B | 12 | 111 | 20059 | 113.16 | 894 | 874 | 169.5 |
| B | 15 | 33 | 18673 | 104.98 | 894 | 874 | 169.5 |
| C | 14 | 238 | 138025 | 695.8 | 843 | 851 | 197.1 |
| C | 3 | 233 | 9966 | 46.23 | 843 | 851 | 197.1 |
| C | 0 | 207 | 5996 | 26.1 | 843 | 851 | 197.1 |
| D | 12 | 2 | 1839721 | 9454.65 | 795 | 773 | 194.5 |
| D | 1 | 52 | 1432821 | 7362.64 | 795 | 773 | 194.5 |
| D | 2 | 244 | 534927 | 2746.27 | 795 | 773 | 194.5 |
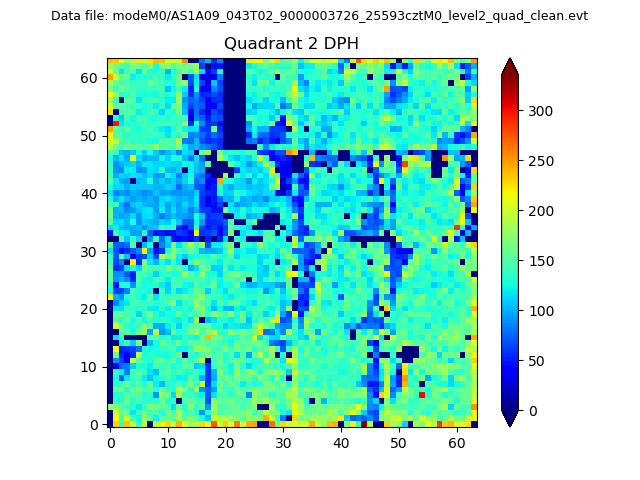
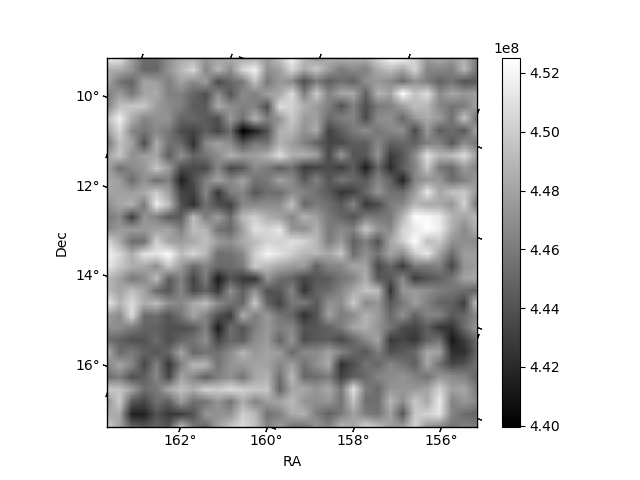
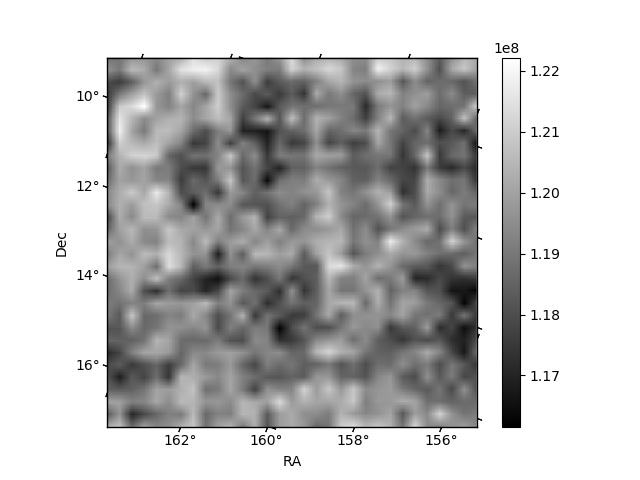
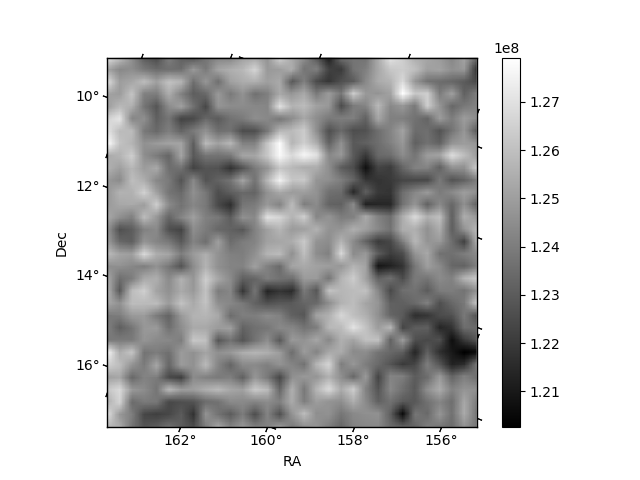
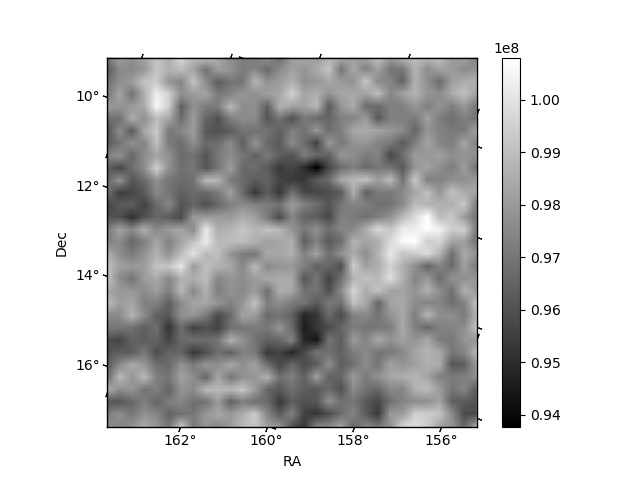
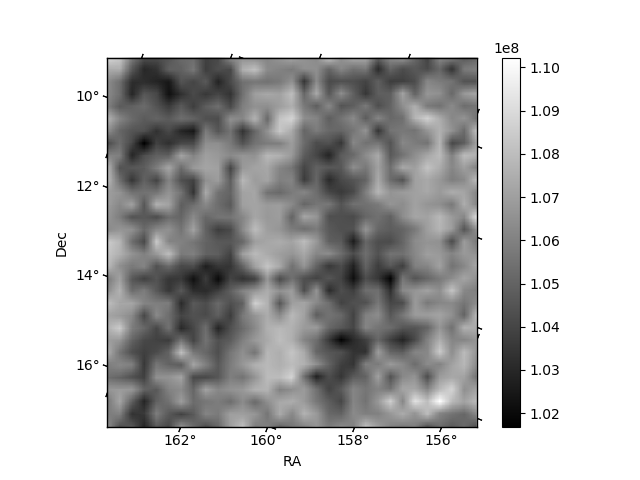
Histogram calculated using DETX and DETY for each event in the final _common_clean file
| Quadrant A | 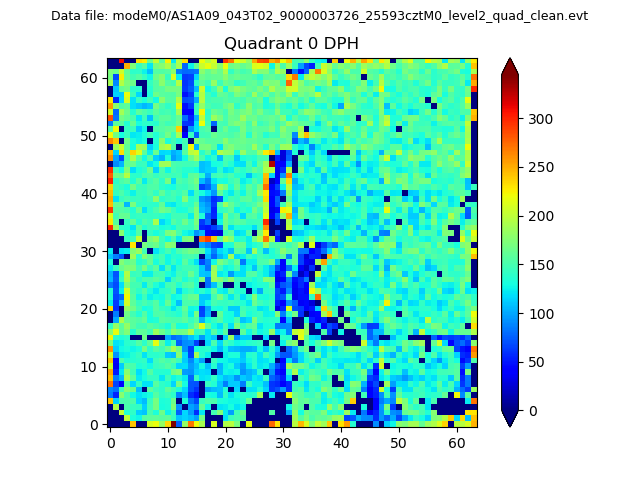 |
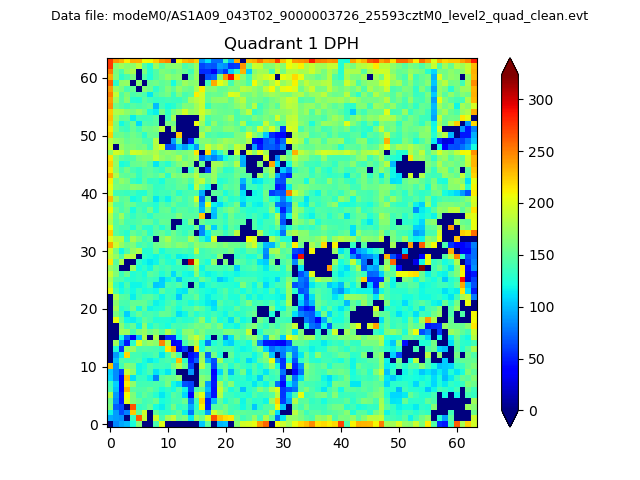 |
Quadrant B |
|---|---|---|---|
| Quadrant D | 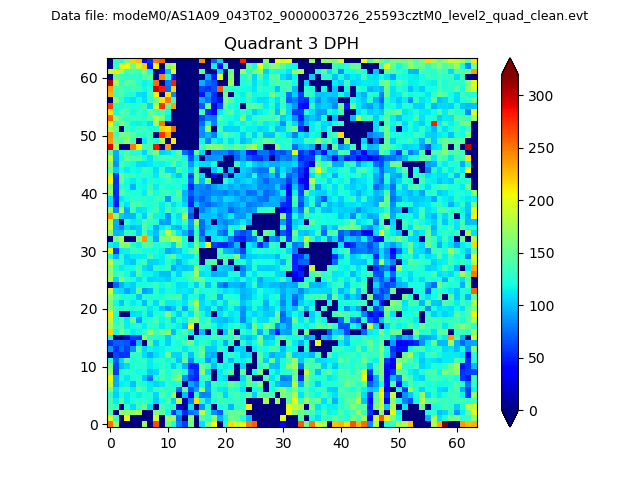 |
 |
Quadrant C |
| Plot type | Count rate plots | Images |
|---|---|---|
| Comparison with Poisson distribution Blue bars denote a histogram of data divided into 1 sec bins. Red curve is a Poisson curve with rate = median count rate of data. |
 |
 |
| Quadrant-wise count rates Data is divided into 100 sec bins |
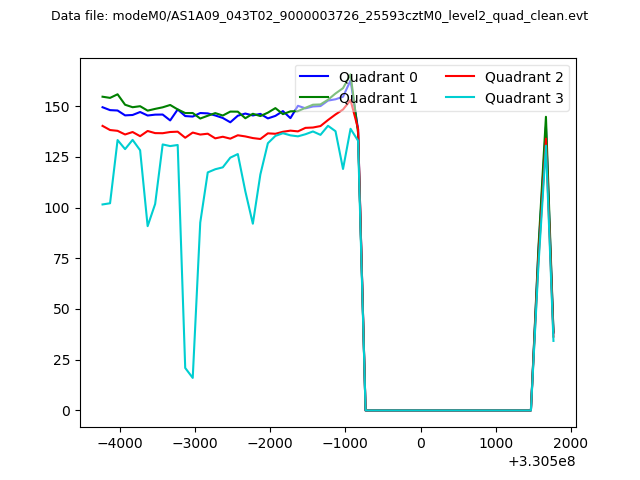 |
|
| Module-wise count rates for Quadrant A Data is divided into 100 sec bins |
 |
 |
| Module-wise count rates for Quadrant B Data is divided into 100 sec bins |
 |
 |
| Module-wise count rates for Quadrant C Data is divided into 100 sec bins |
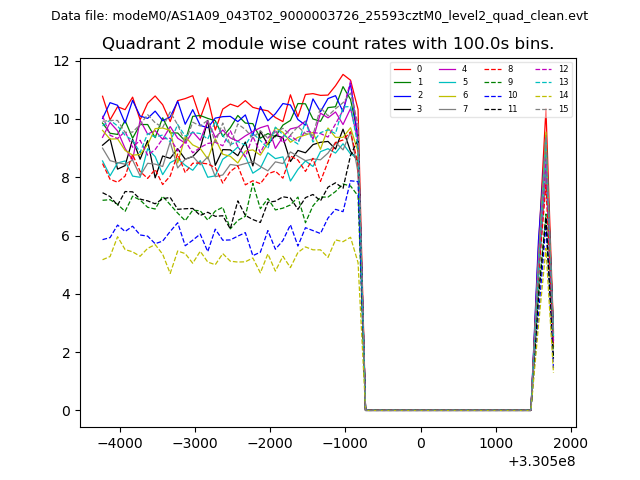 |
 |
| Module-wise count rates for Quadrant D Data is divided into 100 sec bins |
 |
 |
| Parameter | Plot |
|---|---|
| CZT HV Monitor | 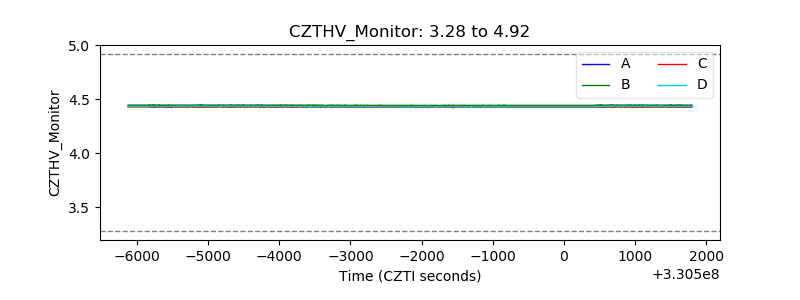 |
| D_VDD | 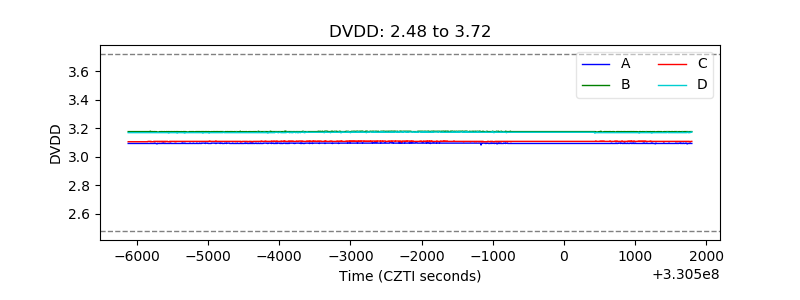 |
| Temperature 1 | 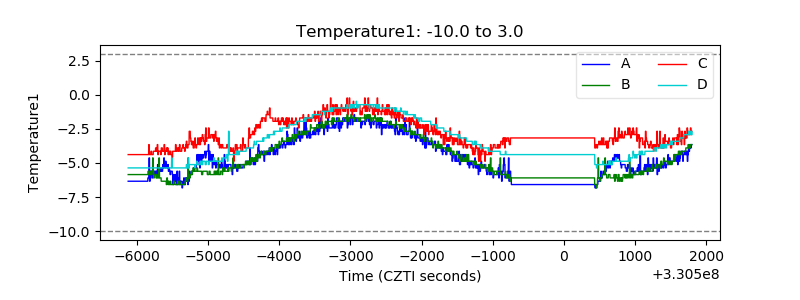 |
| Veto HV Monitor | 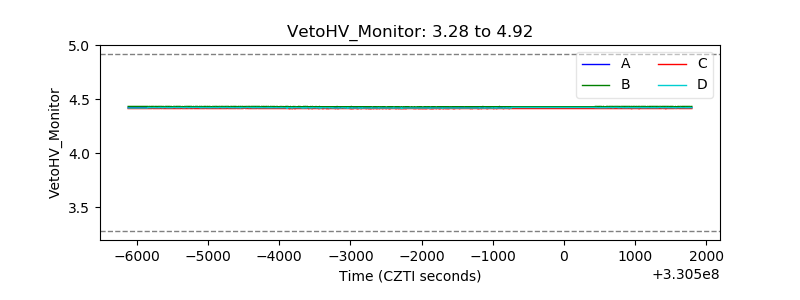 |
| Veto LLD | 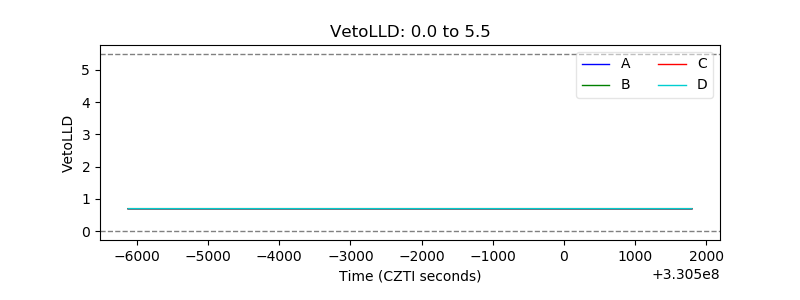 |
| Alpha Counter | 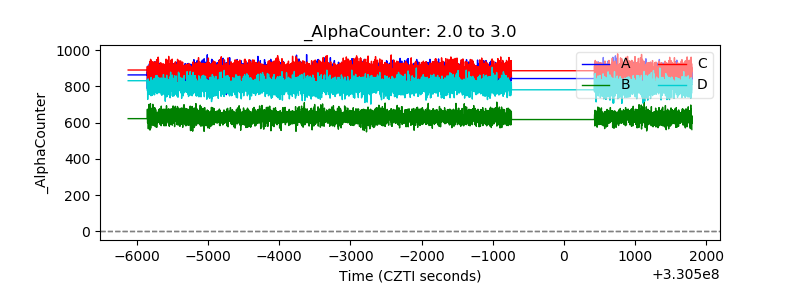 |
| _CPM_Rate | 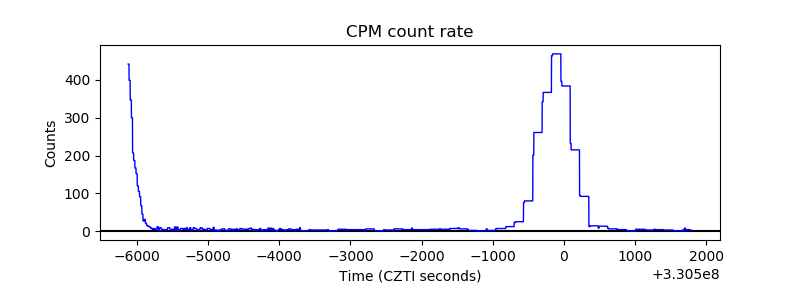 |
| CZT Counter | 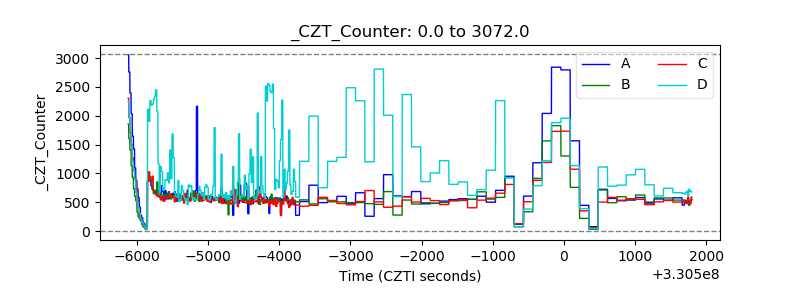 |
| +2.5 Volts monitor |  |
| +5 Volts monitor |  |
| _ROLL_ROT | 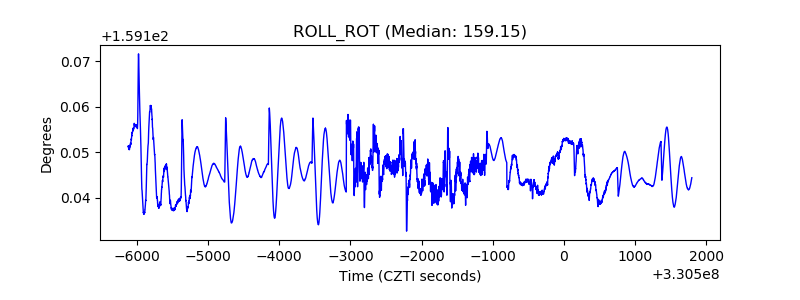 |
| _Roll_DEC |  |
| _Roll_RA | 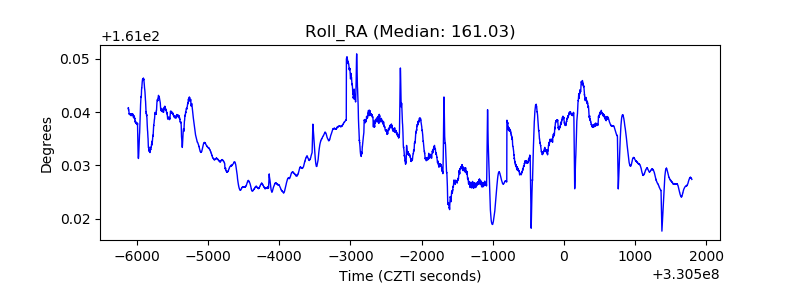 |
| Veto Counter | 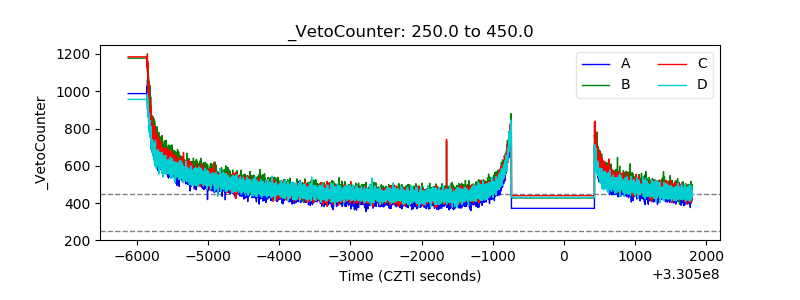 |