| Param | Original file | Final file |
|---|---|---|
| Filename | modeM0/AS1A09_043T02_9000003726_25594cztM0_level2.evt | modeM0/AS1A09_043T02_9000003726_25594cztM0_level2_quad_clean.evt |
| Size (bytes) | 628,384,320 | 87,125,760 |
| Size | 599.3 MB | 83.1 MB |
| Events in quadrant A | 4,352,400 | 577,665 |
| Events in quadrant B | 3,412,302 | 588,663 |
| Events in quadrant C | 3,280,090 | 548,721 |
| Events in quadrant D | 7,539,979 | 463,417 |
| Mode M0 | |||
|---|---|---|---|
| Quadrant | BADHDUFLAG | Total packets | Discarded packets |
| A | 0 | 16799 | 0 |
| B | 0 | 13835 | 0 |
| C | 0 | 13555 | 0 |
| D | 0 | 27243 | 0 |
| Mode M9 | |||
|---|---|---|---|
| Quadrant | BADHDUFLAG | Total packets | Discarded packets |
| A | 0 | 8 | 0 |
| B | 0 | 8 | 0 |
| C | 0 | 8 | 0 |
| D | 0 | 8 | 0 |
| Quadrant | Total seconds | Saturated seconds | Saturation percentage |
|---|---|---|---|
| A | 6589 | 167 | 2.534527% |
| B | 6590 | 118 | 1.790592% |
| C | 6590 | 127 | 1.927162% |
| D | 6590 | 960 | 14.567527% |
Noise dominated data is calculated using 1-second bins in cleaned event files. If a bin has >2000 counts, and if more than 50% of those come from <1% of pixels, then it is considered to be noise-dominated and hence unusable.
| Quadrant | # 1 sec bins | Bins with >0 counts | Bins with >2000 counts | High rate bins dominated by noise | Noise dominated (total time) | Noise dominated (detector-on time) | Marked lightcurve |
|---|---|---|---|---|---|---|---|
| A | 7409 | 6591 | 6 | 6 | 0.08% | 0.09% | 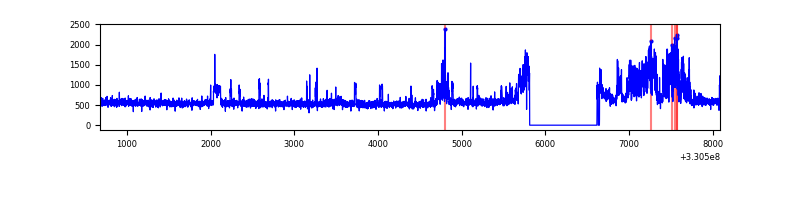 |
| B | 7410 | 6592 | 0 | 0 | 0.00% | 0.00% | 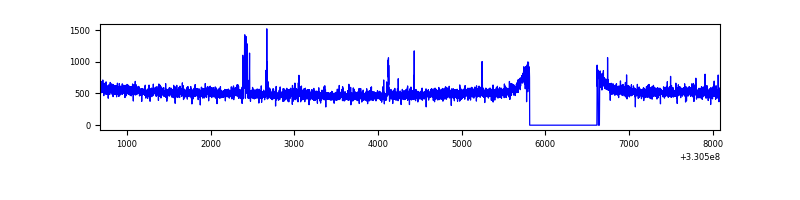 |
| C | 7410 | 6592 | 0 | 0 | 0.00% | 0.00% | 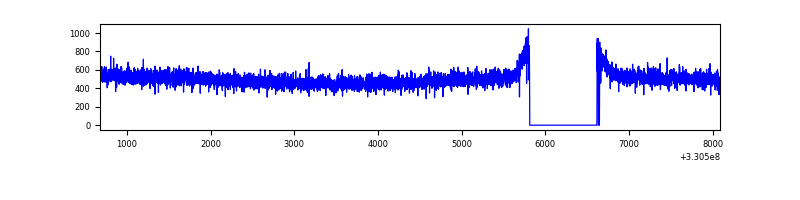 |
| D | 7410 | 6592 | 804 | 804 | 10.85% | 12.20% | 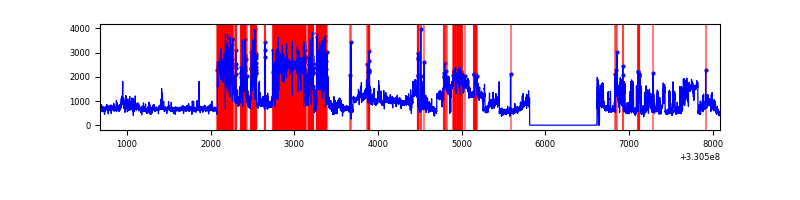 |
Top three noisy pixels from each quadrant. If the there are fewer than three noisy pixels in the level2.evt file, extra rows are filled as -1
| Pixel properties | Quadrant properties | ||||||
|---|---|---|---|---|---|---|---|
| Quadrant | DetID | PixID | Counts | Sigma | Mean | Median | Sigma |
| A | 6 | 16 | 626667 | 3645.63 | 850 | 832 | 171.7 |
| A | 8 | 192 | 445242 | 2588.79 | 850 | 832 | 171.7 |
| A | 13 | 254 | 10284 | 55.06 | 850 | 832 | 171.7 |
| B | 0 | 219 | 50934 | 309.85 | 845 | 826 | 161.7 |
| B | 0 | 190 | 33356 | 201.15 | 845 | 826 | 161.7 |
| B | 12 | 111 | 19696 | 116.69 | 845 | 826 | 161.7 |
| C | 14 | 238 | 131968 | 691.44 | 806 | 812 | 189.7 |
| C | 3 | 233 | 8182 | 38.85 | 806 | 812 | 189.7 |
| C | 13 | 61 | 5619 | 25.34 | 806 | 812 | 189.7 |
| D | 1 | 52 | 2251256 | 11998.67 | 766 | 745 | 187.6 |
| D | 12 | 2 | 1957120 | 10430.47 | 766 | 745 | 187.6 |
| D | 2 | 244 | 232658 | 1236.45 | 766 | 745 | 187.6 |
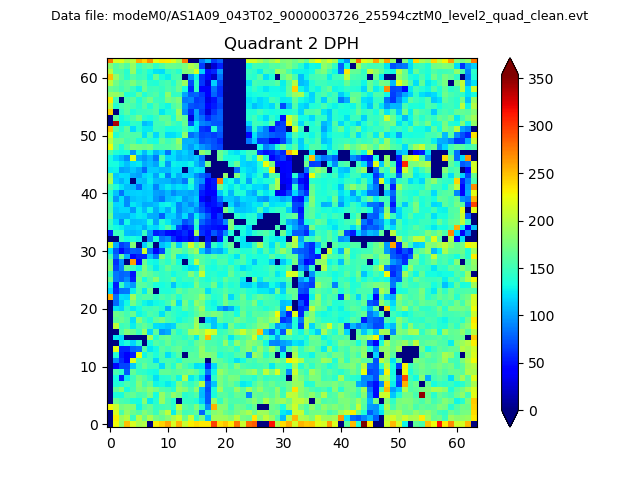
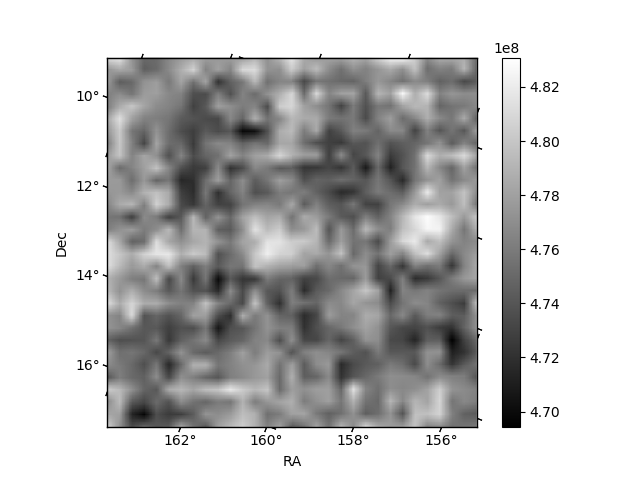
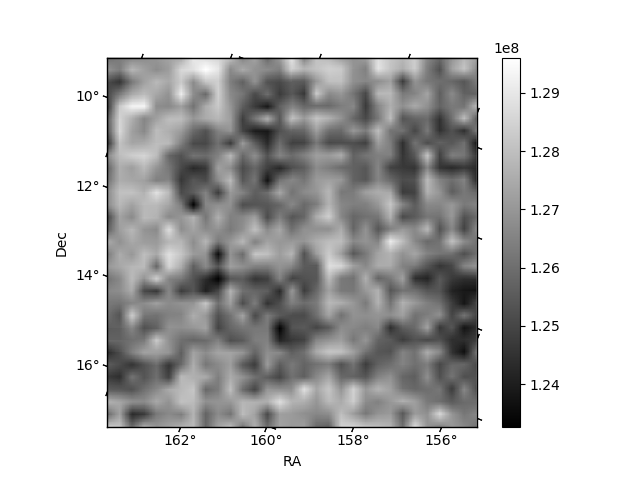
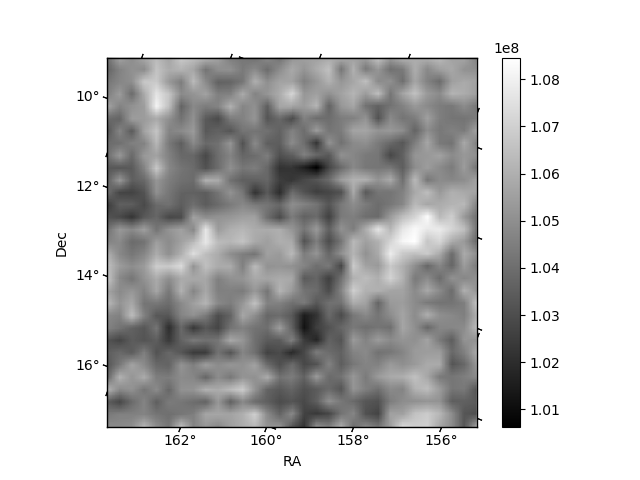
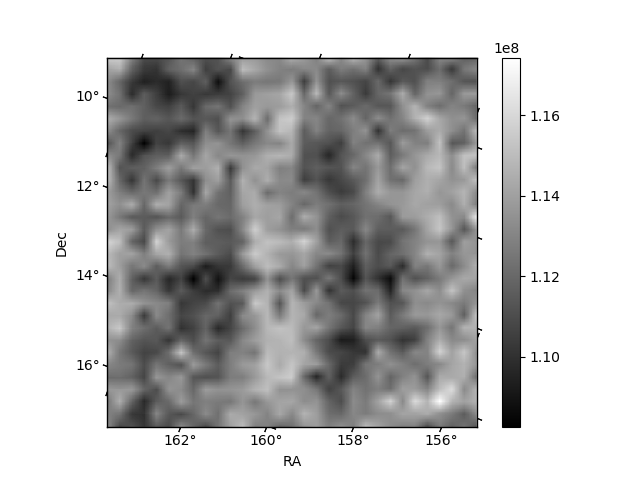
Histogram calculated using DETX and DETY for each event in the final _common_clean file
| Quadrant A | 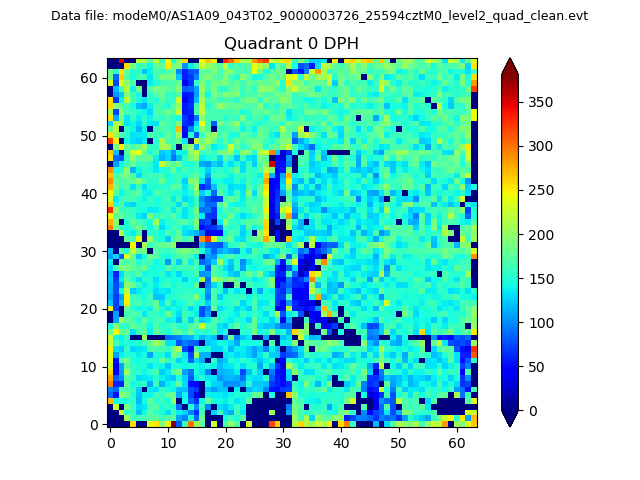 |
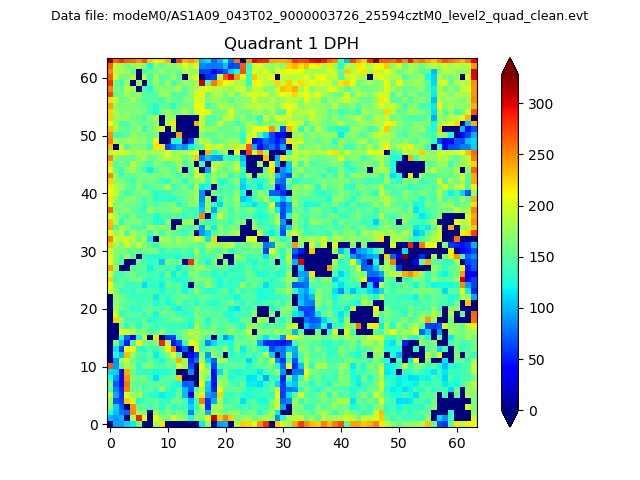 |
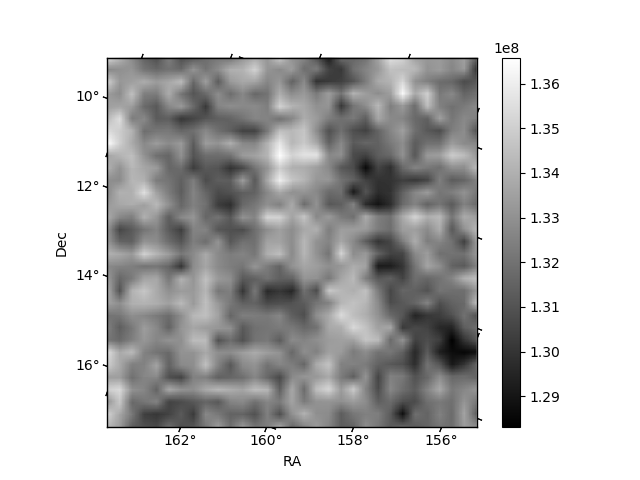
Quadrant B |
|---|---|---|---|
| Quadrant D | 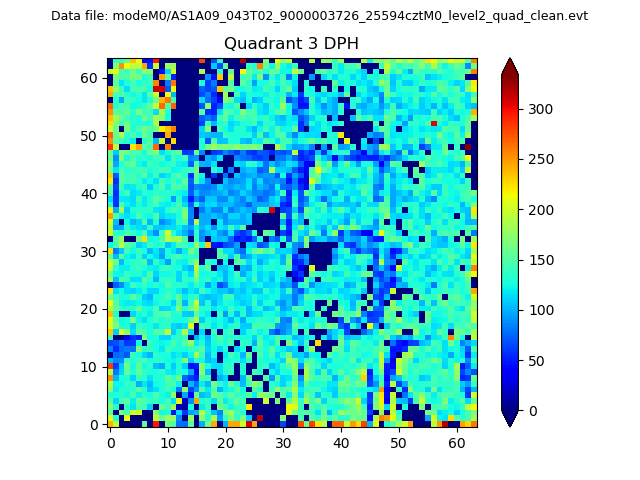 |
 |
Quadrant C |
| Plot type | Count rate plots | Images |
|---|---|---|
| Comparison with Poisson distribution Blue bars denote a histogram of data divided into 1 sec bins. Red curve is a Poisson curve with rate = median count rate of data. |
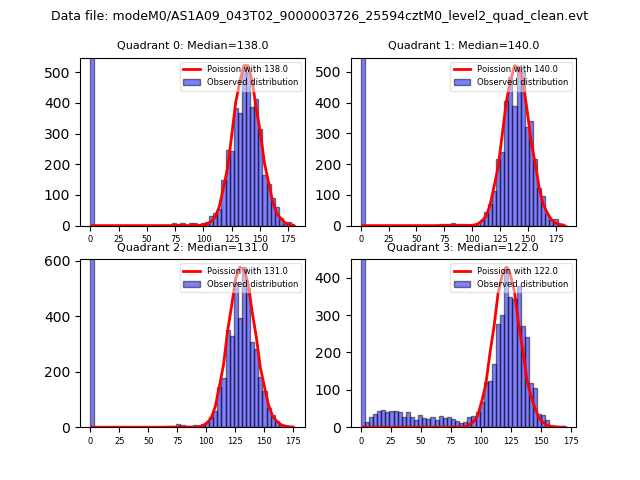 |
 |
| Quadrant-wise count rates Data is divided into 100 sec bins |
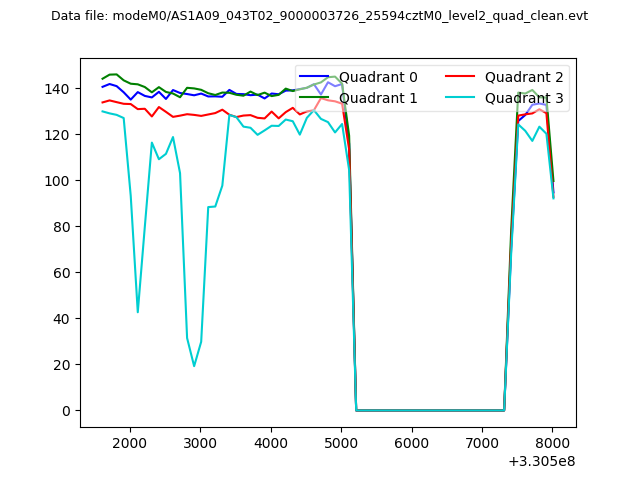 |
|
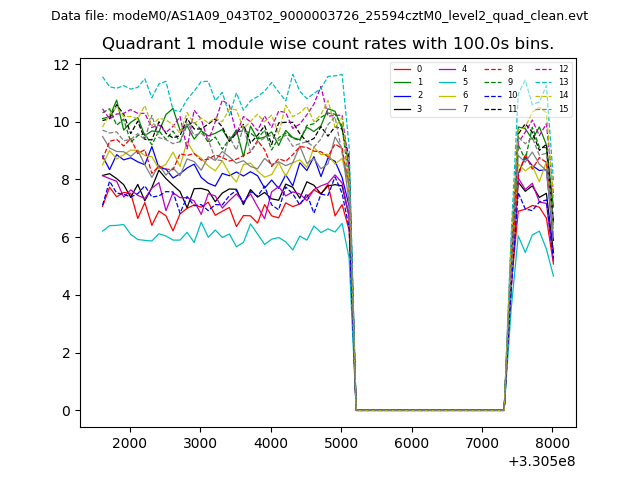
| Module-wise count rates for Quadrant A Data is divided into 100 sec bins |
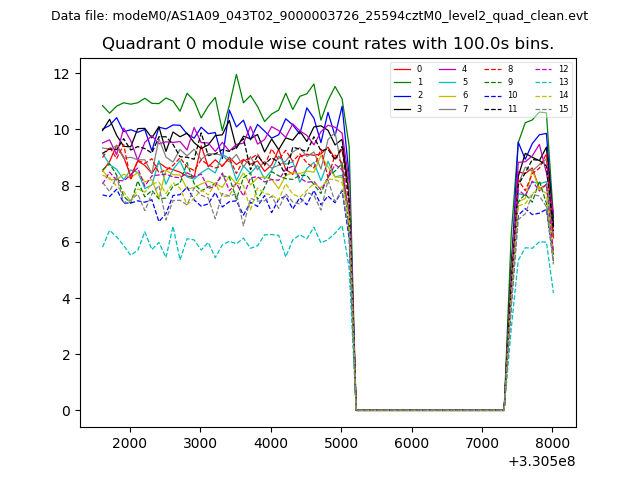 |
 |
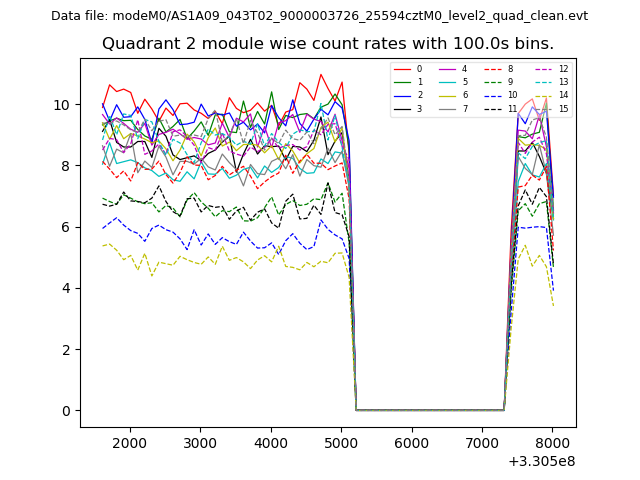
| Module-wise count rates for Quadrant B Data is divided into 100 sec bins |
 |
 |
| Module-wise count rates for Quadrant C Data is divided into 100 sec bins |
 |
 |
| Module-wise count rates for Quadrant D Data is divided into 100 sec bins |
 |
 |
| Parameter | Plot |
|---|---|
| CZT HV Monitor |  |
| D_VDD | 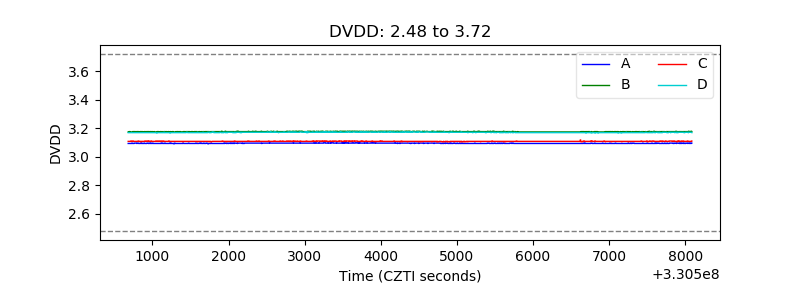 |
| Temperature 1 | 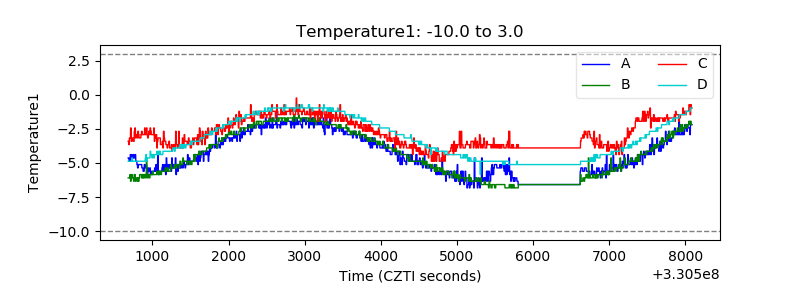 |
| Veto HV Monitor | 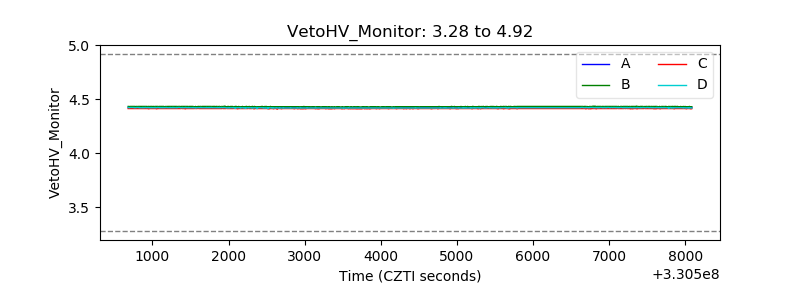 |
| Veto LLD | 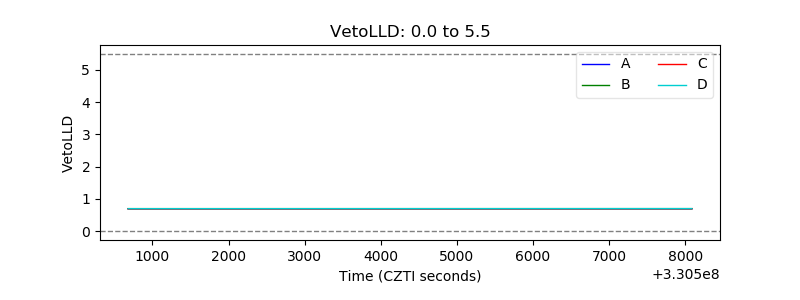 |
| Alpha Counter | 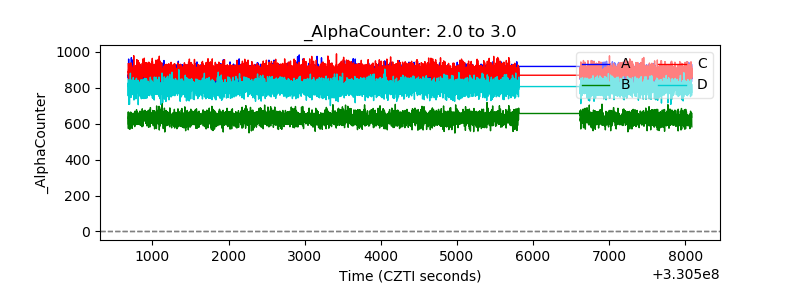 |
| _CPM_Rate | 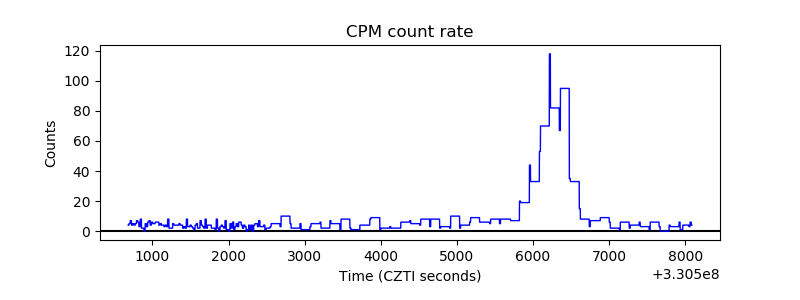 |
| CZT Counter | 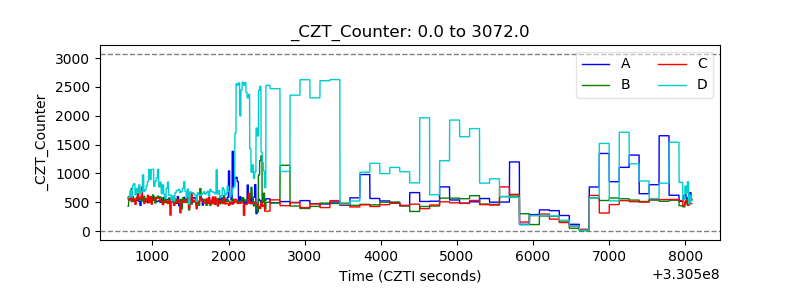 |
| +2.5 Volts monitor |  |
| +5 Volts monitor |  |
| _ROLL_ROT | 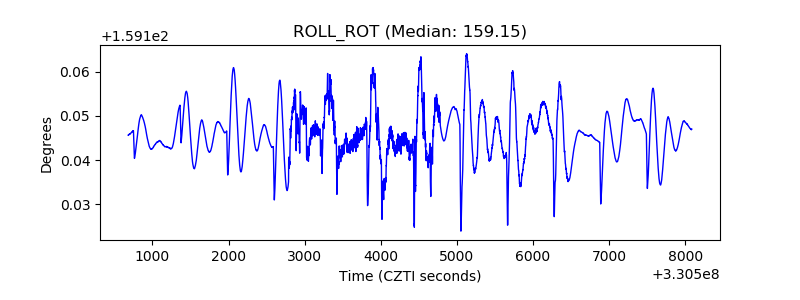 |
| _Roll_DEC | 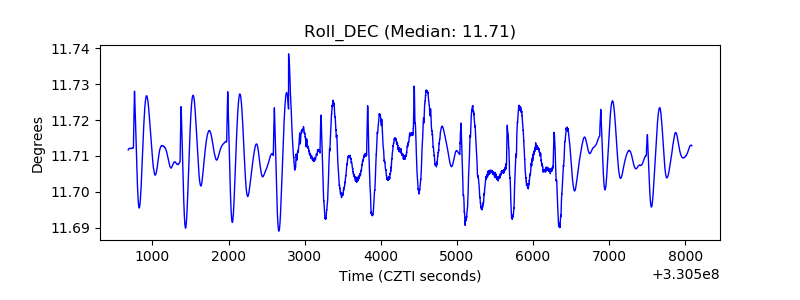 |
| _Roll_RA | 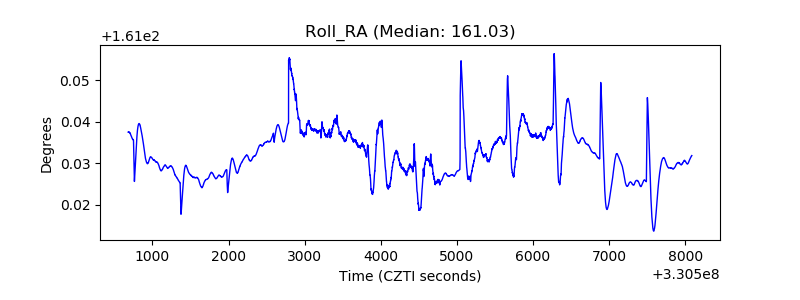 |
| Veto Counter | 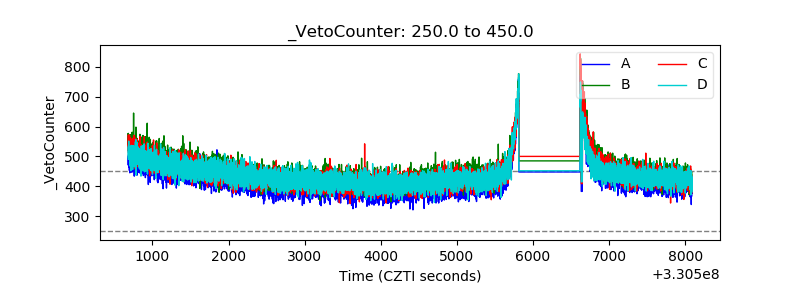 |