| Param | Original file | Final file |
|---|---|---|
| Filename | modeM0/AS1A09_043T02_9000003726_25595cztM0_level2.evt | modeM0/AS1A09_043T02_9000003726_25595cztM0_level2_quad_clean.evt |
| Size (bytes) | 678,530,880 | 100,272,960 |
| Size | 647.1 MB | 95.6 MB |
| Events in quadrant A | 4,914,743 | 643,848 |
| Events in quadrant B | 4,025,889 | 655,701 |
| Events in quadrant C | 3,810,868 | 615,162 |
| Events in quadrant D | 7,278,822 | 587,982 |
| Mode M0 | |||
|---|---|---|---|
| Quadrant | BADHDUFLAG | Total packets | Discarded packets |
| A | 0 | 19295 | 0 |
| B | 0 | 16435 | 0 |
| C | 0 | 15978 | 0 |
| D | 0 | 26860 | 0 |
| Mode M9 | |||
|---|---|---|---|
| Quadrant | BADHDUFLAG | Total packets | Discarded packets |
| A | 0 | 4 | 0 |
| B | 0 | 5 | 0 |
| C | 0 | 5 | 0 |
| D | 0 | 5 | 0 |
| Quadrant | Total seconds | Saturated seconds | Saturation percentage |
|---|---|---|---|
| A | 7675 | 276 | 3.596091% |
| B | 7675 | 239 | 3.114007% |
| C | 7675 | 246 | 3.205212% |
| D | 7675 | 513 | 6.684039% |
Noise dominated data is calculated using 1-second bins in cleaned event files. If a bin has >2000 counts, and if more than 50% of those come from <1% of pixels, then it is considered to be noise-dominated and hence unusable.
| Quadrant | # 1 sec bins | Bins with >0 counts | Bins with >2000 counts | High rate bins dominated by noise | Noise dominated (total time) | Noise dominated (detector-on time) | Marked lightcurve |
|---|---|---|---|---|---|---|---|
| A | 8015 | 7678 | 15 | 15 | 0.19% | 0.20% | 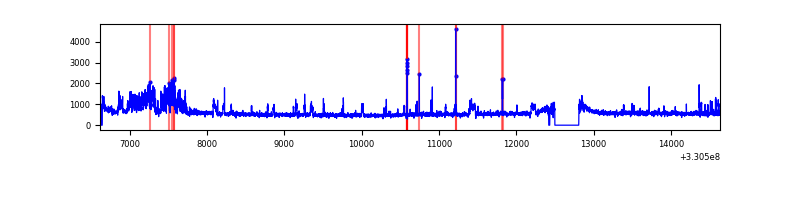 |
| B | 8015 | 7678 | 0 | 0 | 0.00% | 0.00% | 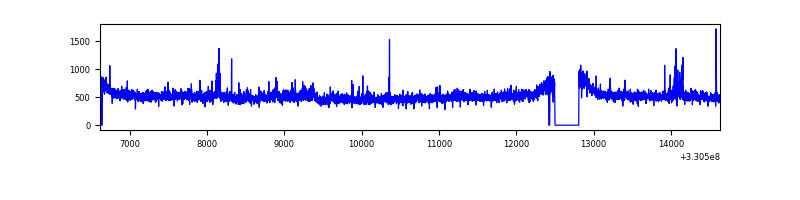 |
| C | 8015 | 7677 | 0 | 0 | 0.00% | 0.00% | 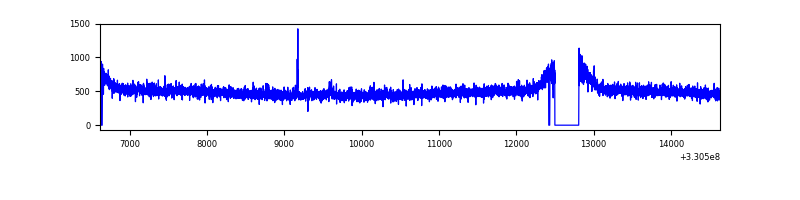 |
| D | 8015 | 7678 | 288 | 288 | 3.59% | 3.75% | 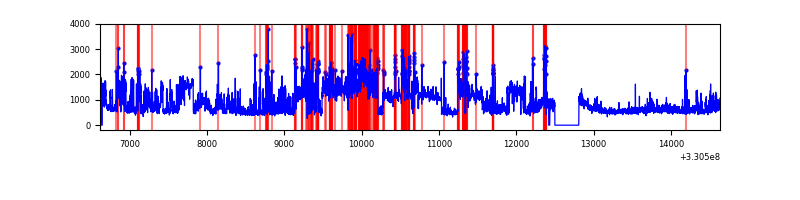 |
Top three noisy pixels from each quadrant. If the there are fewer than three noisy pixels in the level2.evt file, extra rows are filled as -1
| Pixel properties | Quadrant properties | ||||||
|---|---|---|---|---|---|---|---|
| Quadrant | DetID | PixID | Counts | Sigma | Mean | Median | Sigma |
| A | 8 | 192 | 598652 | 2997.84 | 982 | 959 | 199.4 |
| A | 6 | 16 | 519085 | 2598.75 | 982 | 959 | 199.4 |
| A | 4 | 2 | 12247 | 56.62 | 982 | 959 | 199.4 |
| B | 0 | 219 | 92566 | 492.83 | 973 | 947 | 185.9 |
| B | 0 | 190 | 66283 | 351.45 | 973 | 947 | 185.9 |
| B | 15 | 33 | 25270 | 130.84 | 973 | 947 | 185.9 |
| C | 14 | 238 | 149847 | 679.08 | 931 | 936 | 219.3 |
| C | 3 | 233 | 21069 | 91.81 | 931 | 936 | 219.3 |
| C | 0 | 207 | 9928 | 41.01 | 931 | 936 | 219.3 |
| D | 1 | 52 | 3078559 | 13354.59 | 943 | 918 | 230.5 |
| D | 2 | 244 | 362897 | 1570.71 | 943 | 918 | 230.5 |
| D | 8 | 195 | 204685 | 884.19 | 943 | 918 | 230.5 |
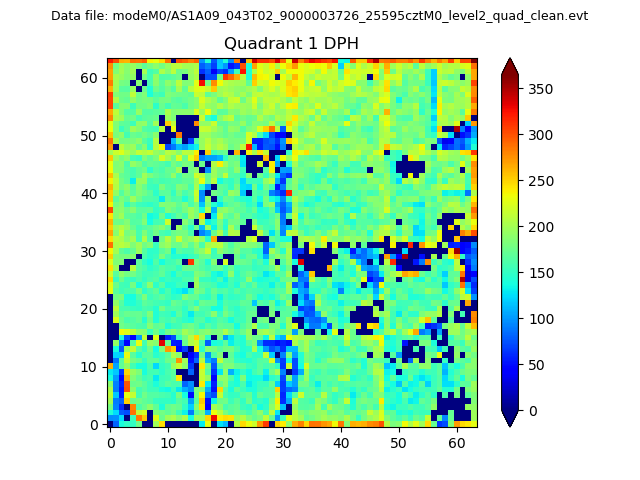
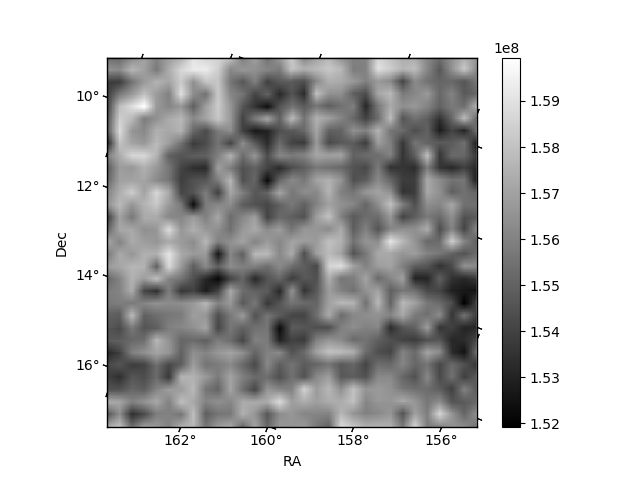
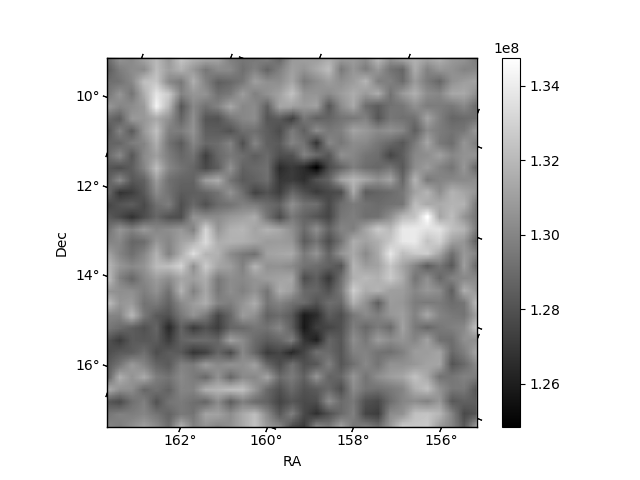
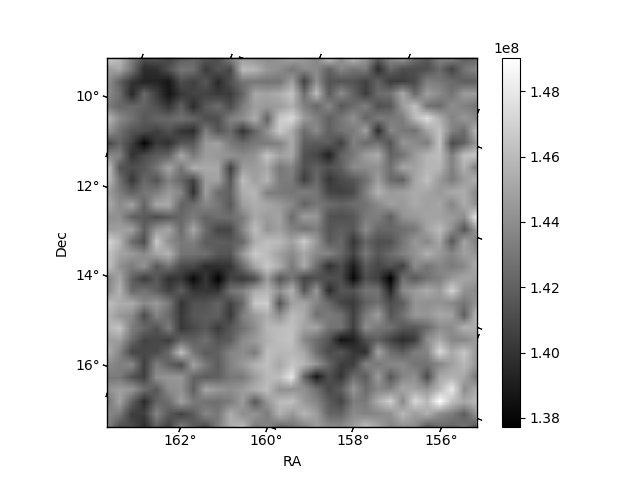
Histogram calculated using DETX and DETY for each event in the final _common_clean file
| Quadrant A |  |
 |
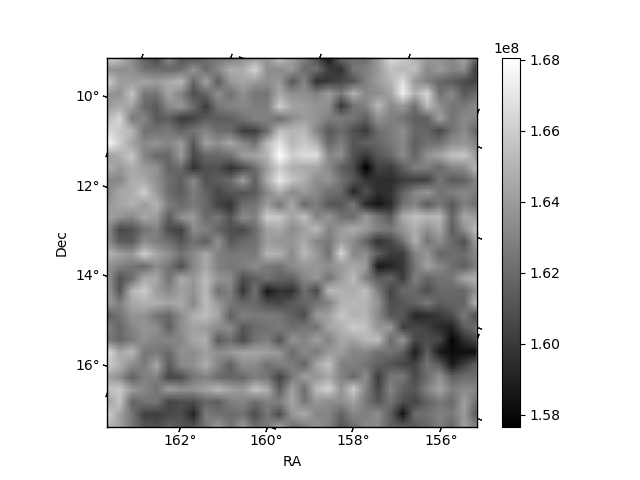
Quadrant B |
|---|---|---|---|
| Quadrant D | 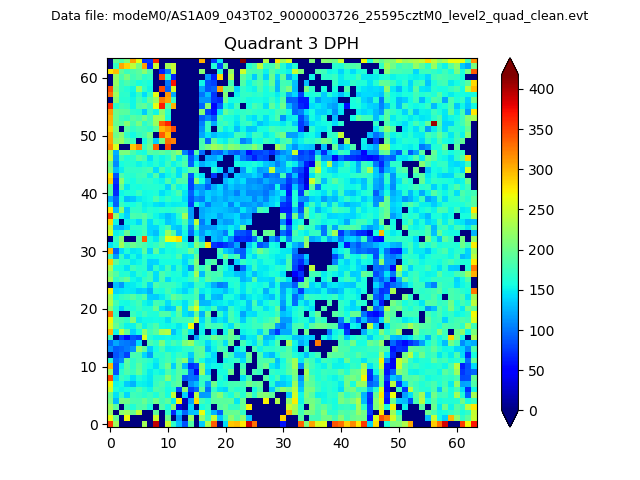 |
 |
Quadrant C |
| Plot type | Count rate plots | Images |
|---|---|---|
| Comparison with Poisson distribution Blue bars denote a histogram of data divided into 1 sec bins. Red curve is a Poisson curve with rate = median count rate of data. |
 |
 |
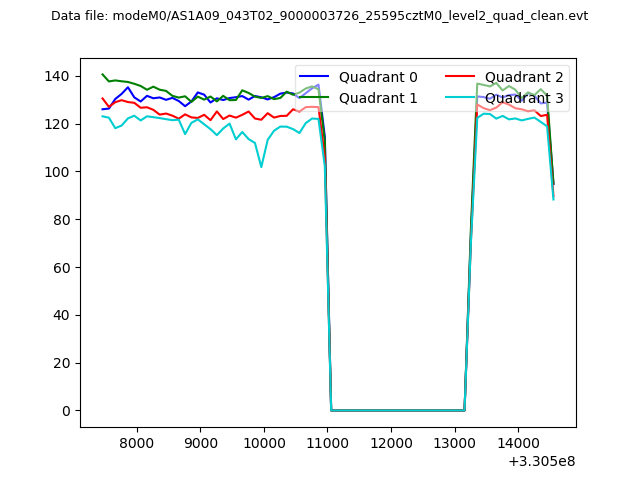
| Quadrant-wise count rates Data is divided into 100 sec bins |
 |
|
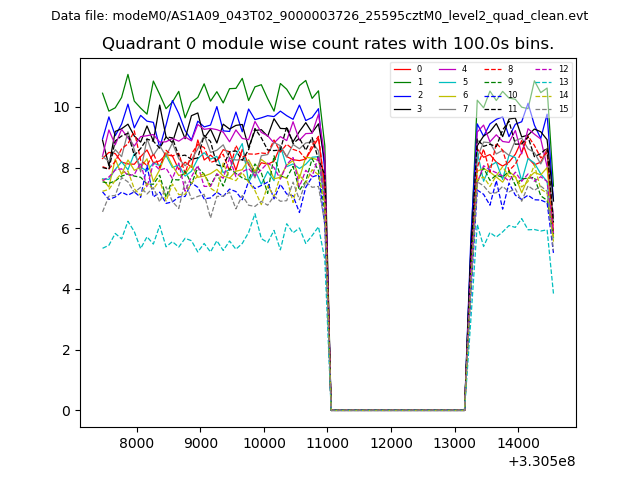
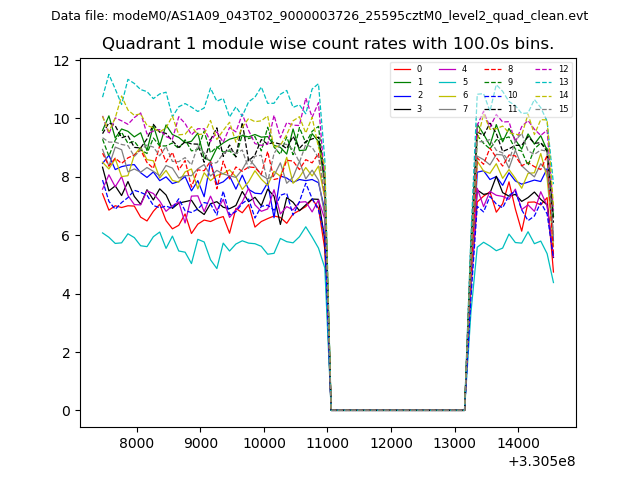
| Module-wise count rates for Quadrant A Data is divided into 100 sec bins |
 |
 |
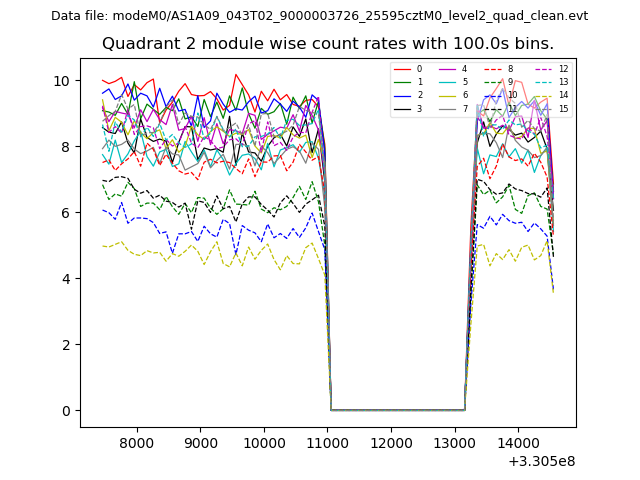
| Module-wise count rates for Quadrant B Data is divided into 100 sec bins |
 |
 |
| Module-wise count rates for Quadrant C Data is divided into 100 sec bins |
 |
 |
| Module-wise count rates for Quadrant D Data is divided into 100 sec bins |
 |
 |
| Parameter | Plot |
|---|---|
| CZT HV Monitor | 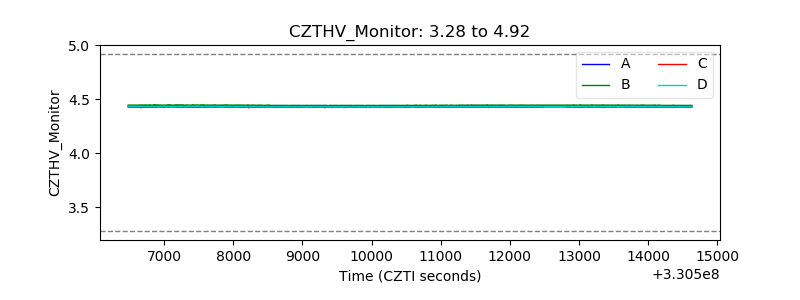 |
| D_VDD | 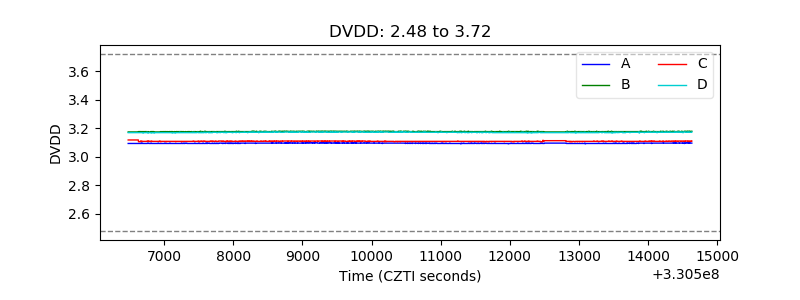 |
| Temperature 1 | 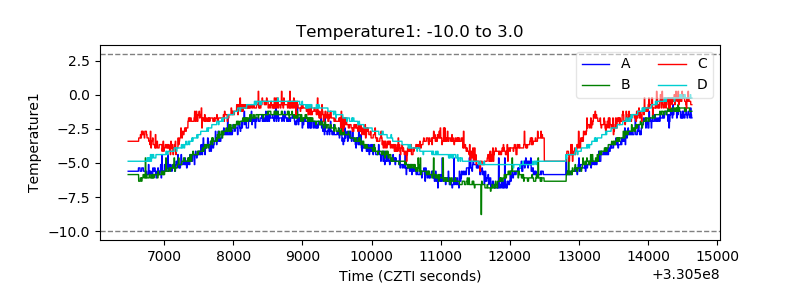 |
| Veto HV Monitor | 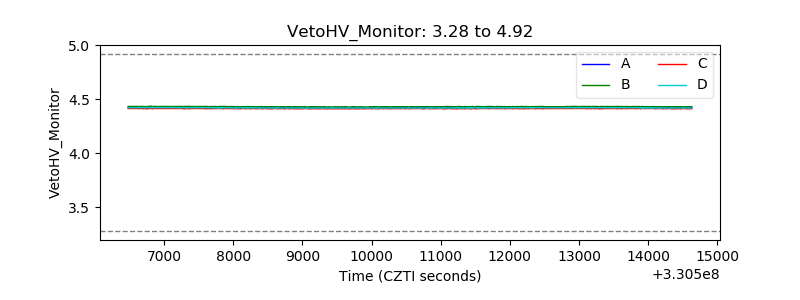 |
| Veto LLD | 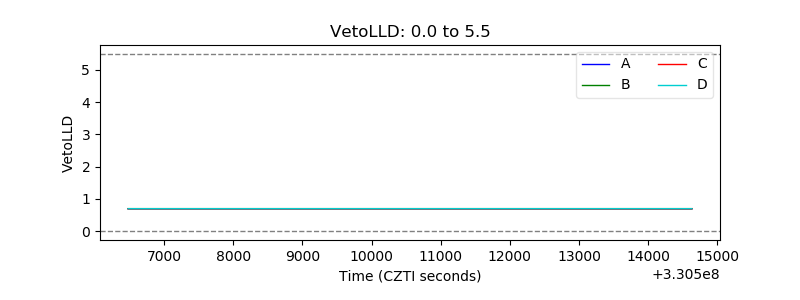 |
| Alpha Counter | 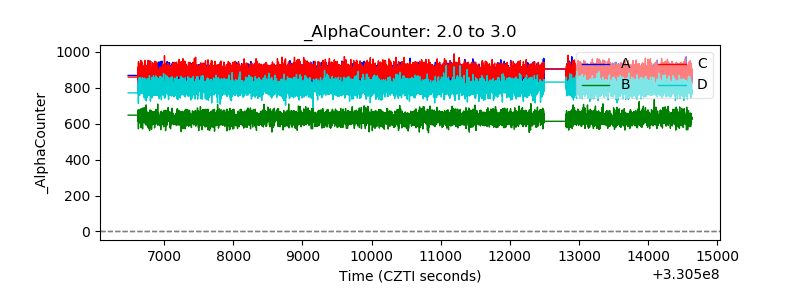 |
| _CPM_Rate | 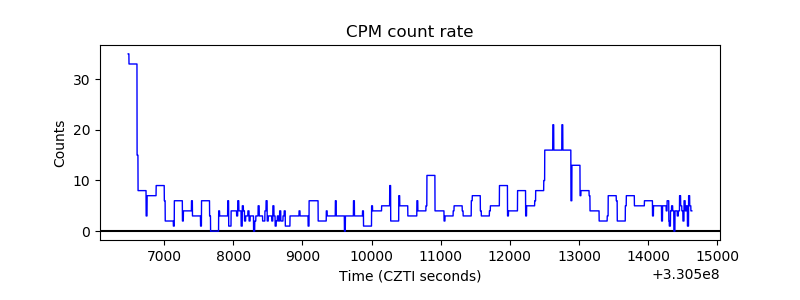 |
| CZT Counter |  |
| +2.5 Volts monitor |  |
| +5 Volts monitor | 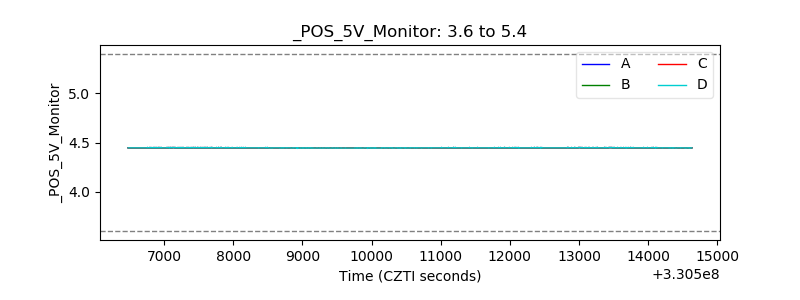 |
| _ROLL_ROT |  |
| _Roll_DEC | 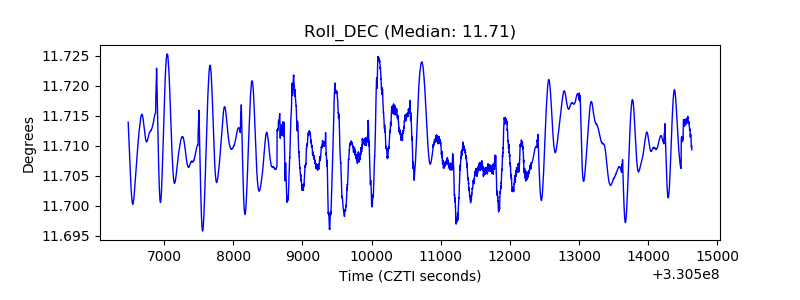 |
| _Roll_RA |  |
| Veto Counter | 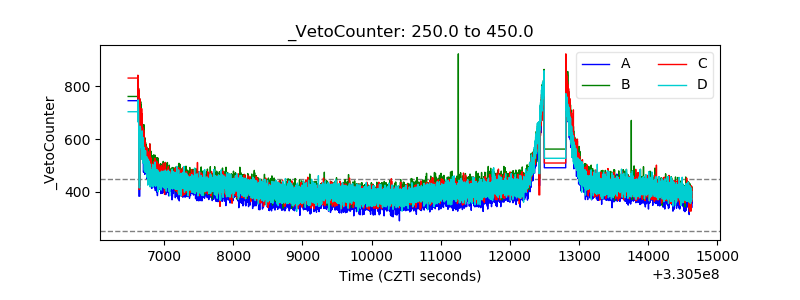 |