| Param | Original file | Final file |
|---|---|---|
| Filename | modeM0/AS1A09_043T02_9000003726_25596cztM0_level2.evt | modeM0/AS1A09_043T02_9000003726_25596cztM0_level2_quad_clean.evt |
| Size (bytes) | 652,942,080 | 100,540,800 |
| Size | 622.7 MB | 95.9 MB |
| Events in quadrant A | 4,939,359 | 652,696 |
| Events in quadrant B | 3,860,487 | 666,325 |
| Events in quadrant C | 3,617,413 | 630,075 |
| Events in quadrant D | 6,866,478 | 590,669 |
| Mode M0 | |||
|---|---|---|---|
| Quadrant | BADHDUFLAG | Total packets | Discarded packets |
| A | 0 | 19326 | 0 |
| B | 0 | 15751 | 0 |
| C | 0 | 15264 | 0 |
| D | 0 | 25537 | 0 |
| Mode M9 | |||
|---|---|---|---|
| Quadrant | BADHDUFLAG | Total packets | Discarded packets |
| A | 0 | 1 | 0 |
| B | 0 | 1 | 0 |
| C | 0 | 1 | 0 |
| D | 0 | 1 | 0 |
| Quadrant | Total seconds | Saturated seconds | Saturation percentage |
|---|---|---|---|
| A | 7247 | 315 | 4.346626% |
| B | 7248 | 273 | 3.766556% |
| C | 7248 | 270 | 3.725166% |
| D | 7248 | 786 | 10.844371% |
Noise dominated data is calculated using 1-second bins in cleaned event files. If a bin has >2000 counts, and if more than 50% of those come from <1% of pixels, then it is considered to be noise-dominated and hence unusable.
| Quadrant | # 1 sec bins | Bins with >0 counts | Bins with >2000 counts | High rate bins dominated by noise | Noise dominated (total time) | Noise dominated (detector-on time) | Marked lightcurve |
|---|---|---|---|---|---|---|---|
| A | 7362 | 7249 | 17 | 17 | 0.23% | 0.23% | 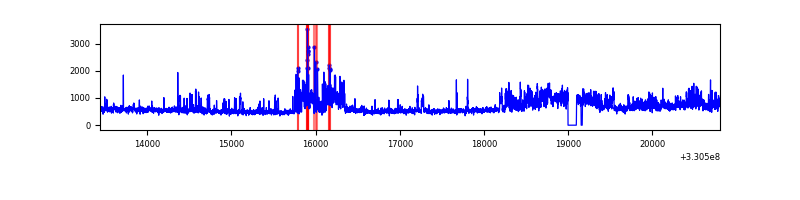 |
| B | 7363 | 7250 | 15 | 15 | 0.20% | 0.21% | 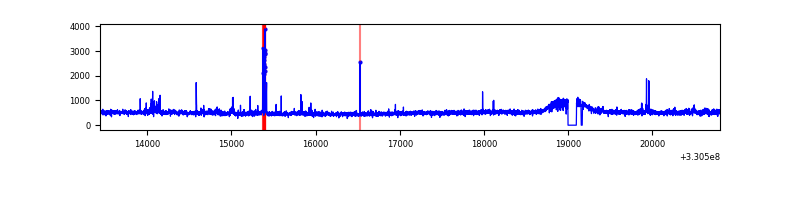 |
| C | 7363 | 7250 | 0 | 0 | 0.00% | 0.00% | 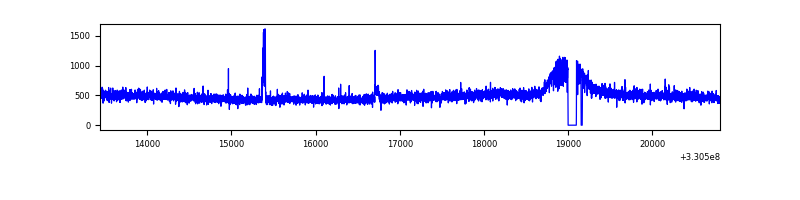 |
| D | 7363 | 7250 | 451 | 451 | 6.13% | 6.22% | 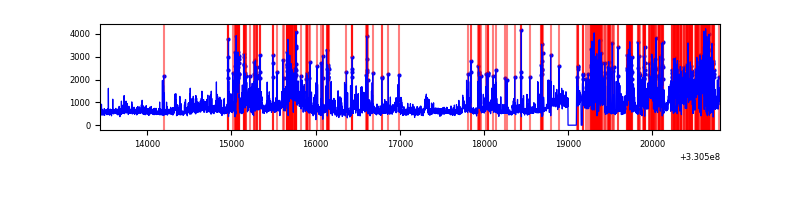 |
Top three noisy pixels from each quadrant. If the there are fewer than three noisy pixels in the level2.evt file, extra rows are filled as -1
| Pixel properties | Quadrant properties | ||||||
|---|---|---|---|---|---|---|---|
| Quadrant | DetID | PixID | Counts | Sigma | Mean | Median | Sigma |
| A | 6 | 16 | 682674 | 3611.71 | 921 | 900 | 188.8 |
| A | 8 | 192 | 665536 | 3520.92 | 921 | 900 | 188.8 |
| A | 4 | 2 | 39497 | 204.47 | 921 | 900 | 188.8 |
| B | 0 | 219 | 95210 | 535.54 | 914 | 891 | 176.1 |
| B | 5 | 172 | 69610 | 390.19 | 914 | 891 | 176.1 |
| B | 0 | 190 | 58292 | 325.92 | 914 | 891 | 176.1 |
| C | 14 | 238 | 138520 | 663.16 | 877 | 882 | 207.5 |
| C | 3 | 233 | 46939 | 221.91 | 877 | 882 | 207.5 |
| C | 2 | 16 | 12420 | 55.59 | 877 | 882 | 207.5 |
| D | 1 | 52 | 2647376 | 12272.44 | 877 | 851 | 215.6 |
| D | 8 | 195 | 442470 | 2047.87 | 877 | 851 | 215.6 |
| D | 2 | 244 | 275048 | 1271.5 | 877 | 851 | 215.6 |
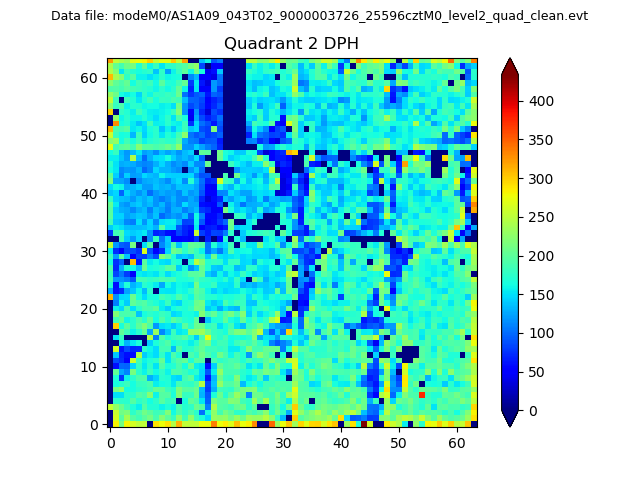
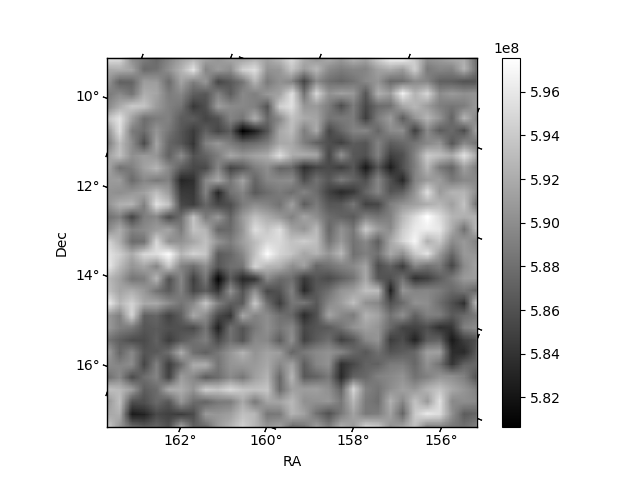
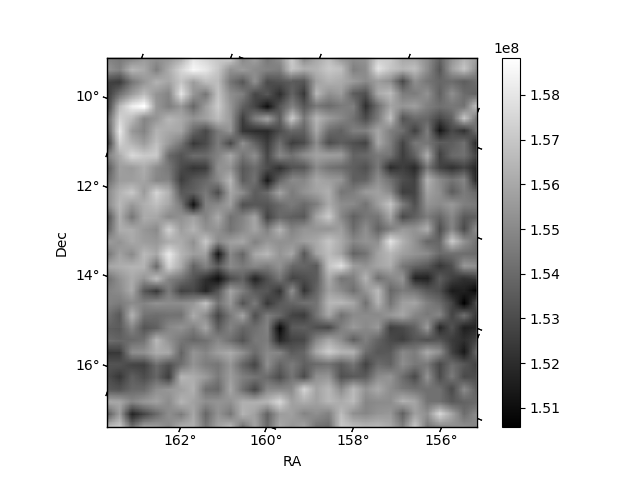
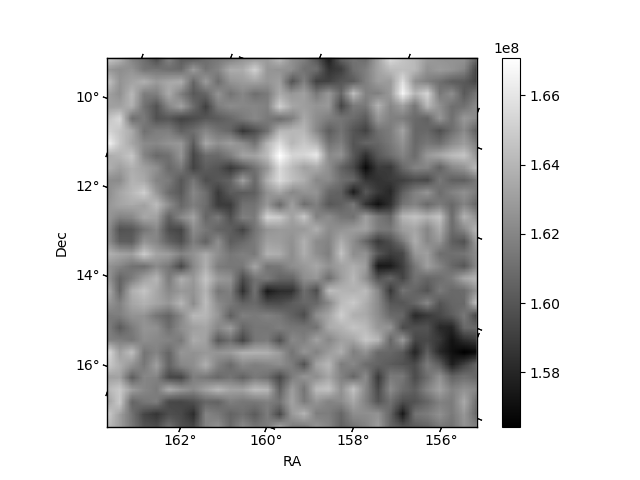
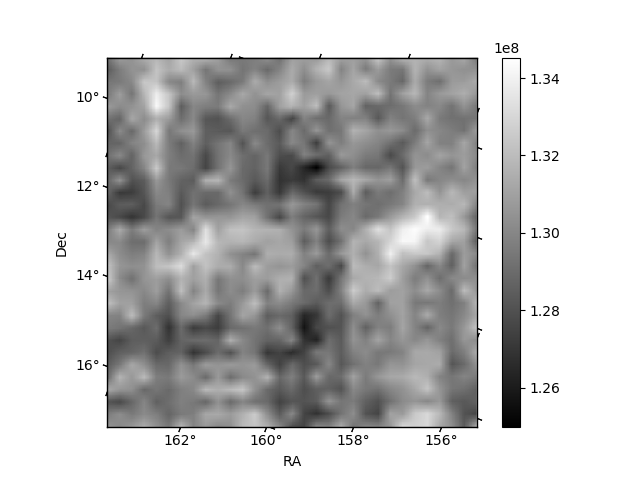
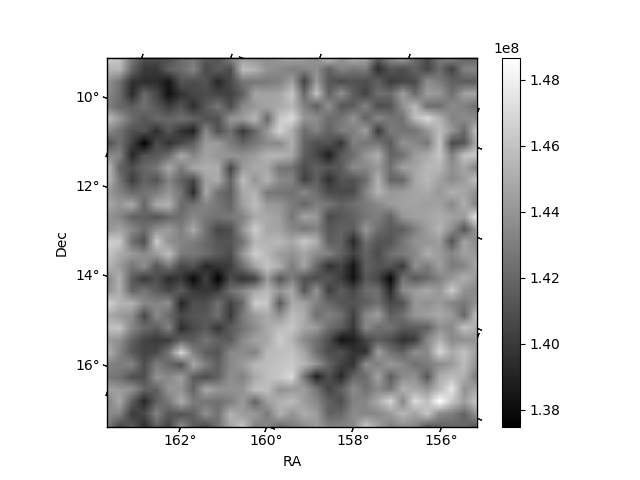
Histogram calculated using DETX and DETY for each event in the final _common_clean file
| Quadrant A | 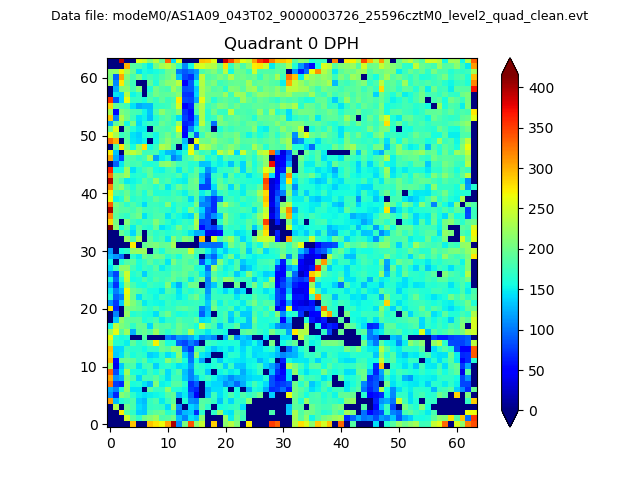 |
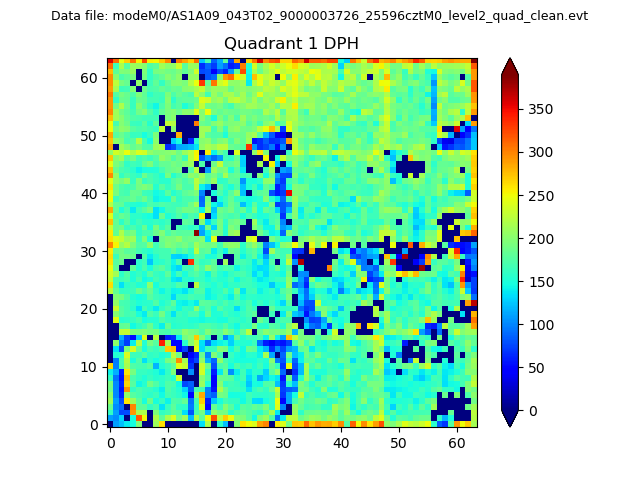 |
Quadrant B |
|---|---|---|---|
| Quadrant D | 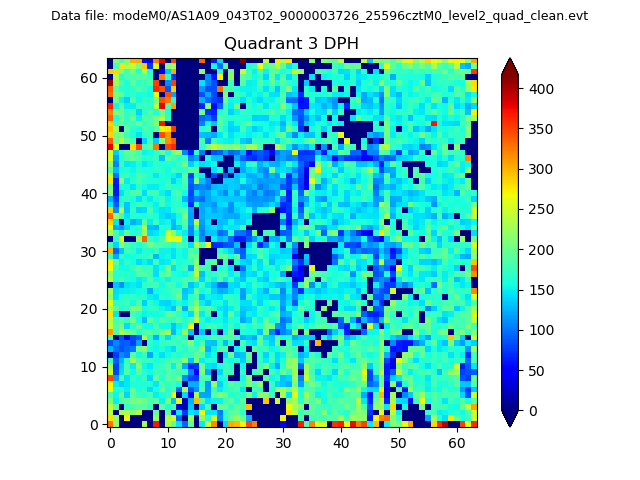 |
 |
Quadrant C |
| Plot type | Count rate plots | Images |
|---|---|---|
| Comparison with Poisson distribution Blue bars denote a histogram of data divided into 1 sec bins. Red curve is a Poisson curve with rate = median count rate of data. |
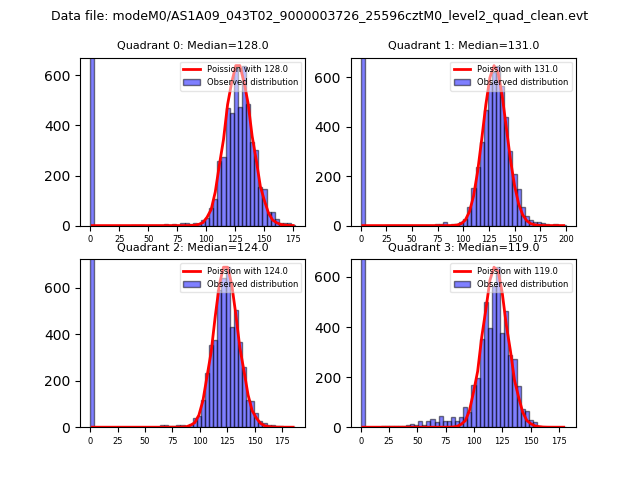 |
 |
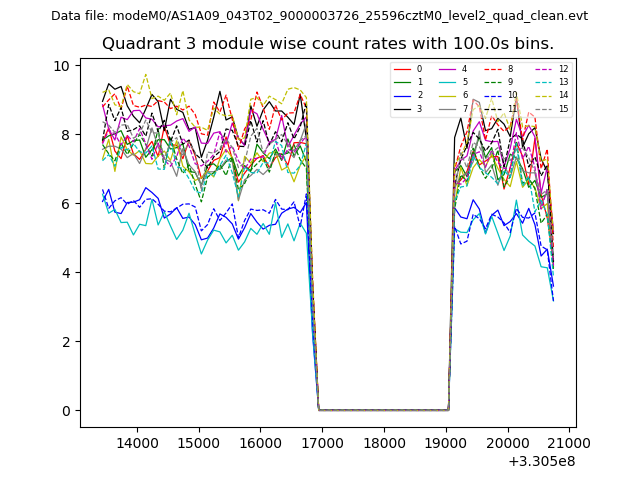
| Quadrant-wise count rates Data is divided into 100 sec bins |
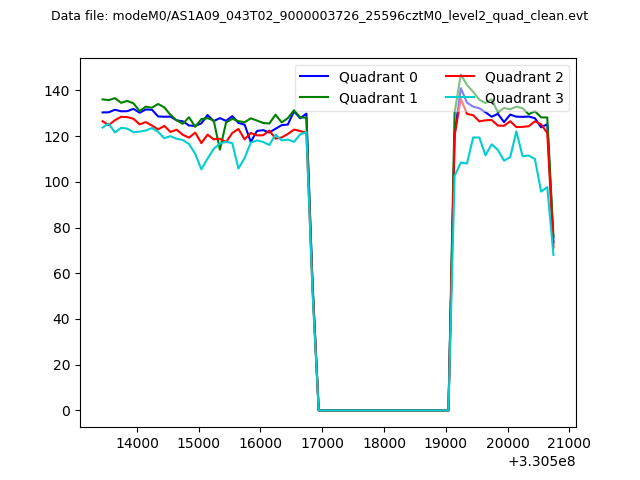 |
|
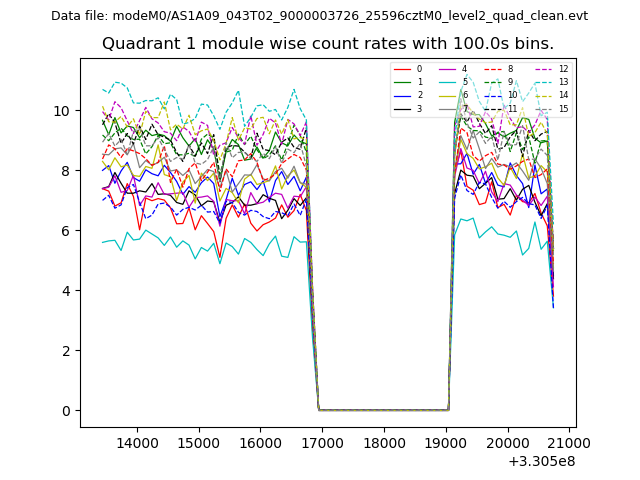
| Module-wise count rates for Quadrant A Data is divided into 100 sec bins |
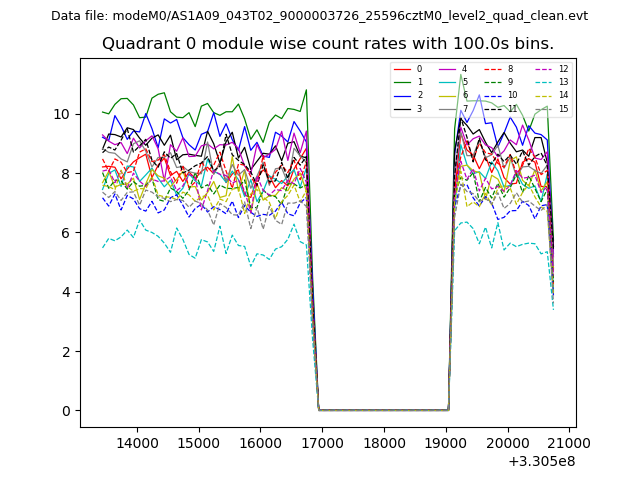 |
 |
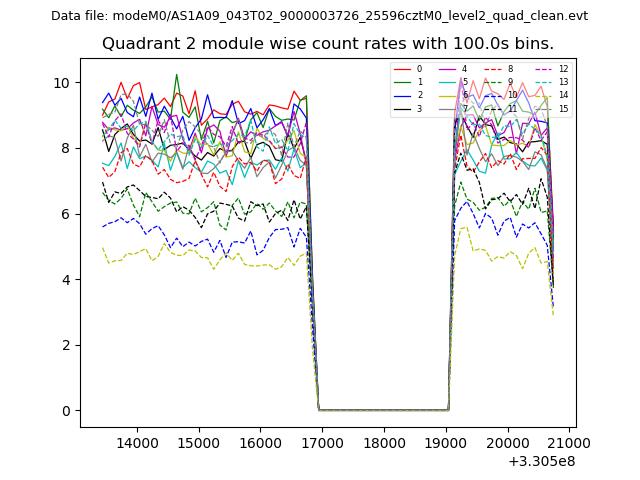
| Module-wise count rates for Quadrant B Data is divided into 100 sec bins |
 |
 |
| Module-wise count rates for Quadrant C Data is divided into 100 sec bins |
 |
 |
| Module-wise count rates for Quadrant D Data is divided into 100 sec bins |
 |
 |
| Parameter | Plot |
|---|---|
| CZT HV Monitor | 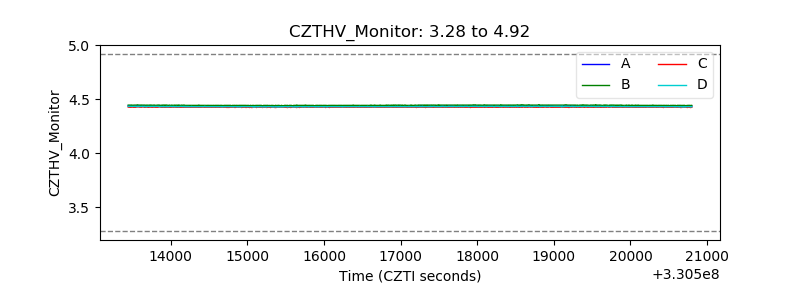 |
| D_VDD | 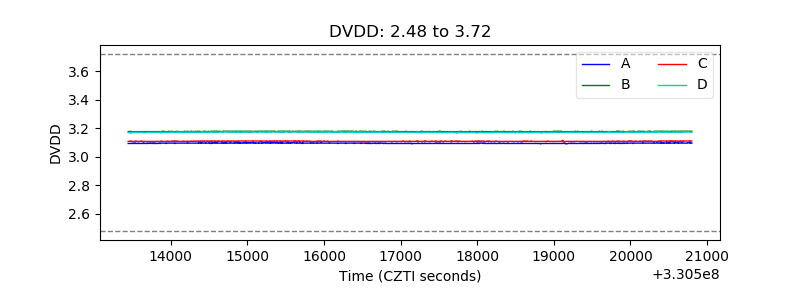 |
| Temperature 1 | 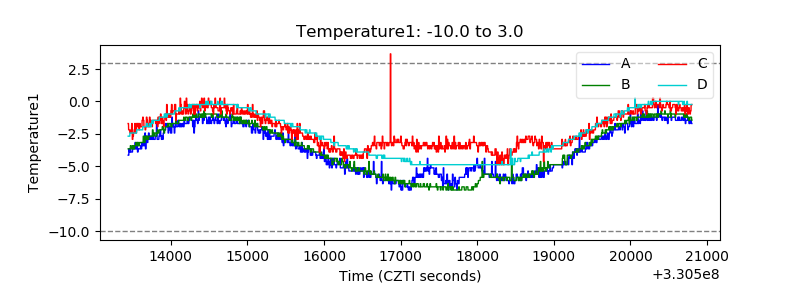 |
| Veto HV Monitor | 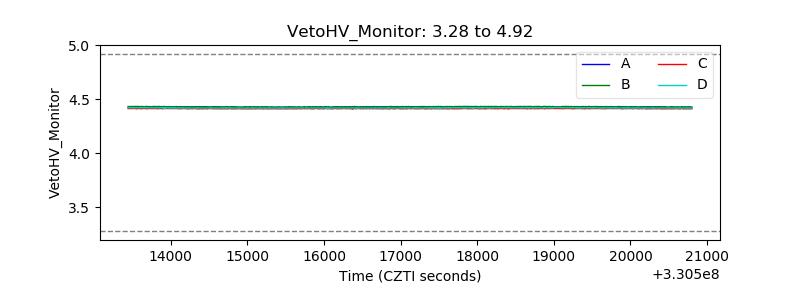 |
| Veto LLD | 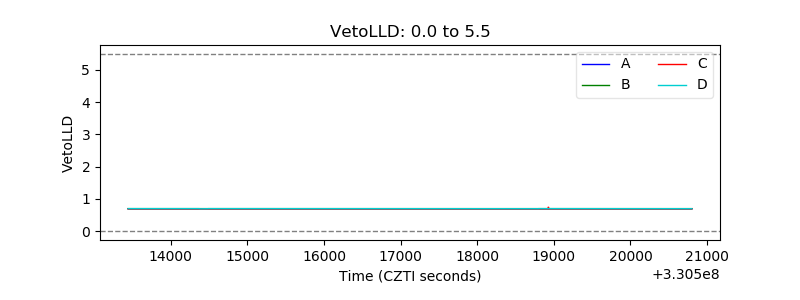 |
| Alpha Counter | 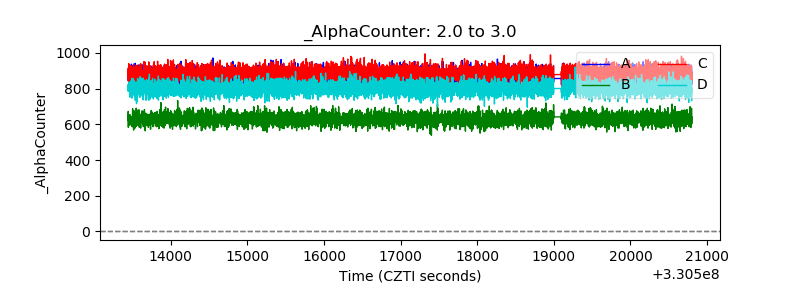 |
| _CPM_Rate | 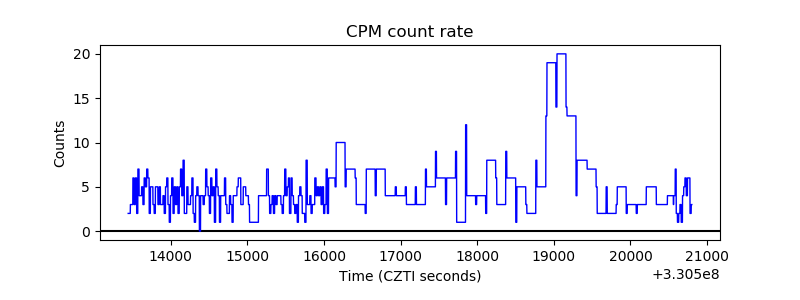 |
| CZT Counter | 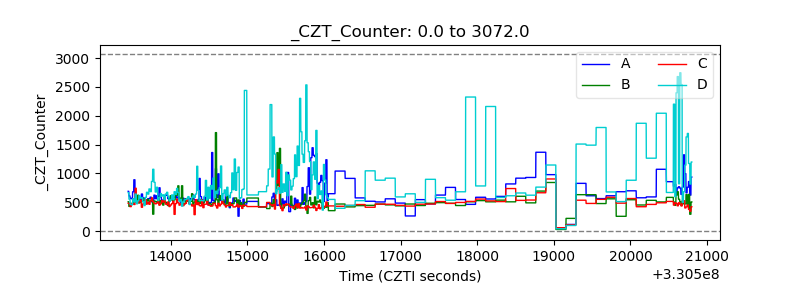 |
| +2.5 Volts monitor |  |
| +5 Volts monitor |  |
| _ROLL_ROT | 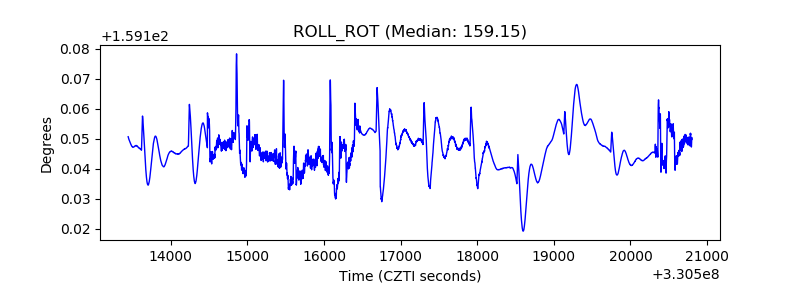 |
| _Roll_DEC | 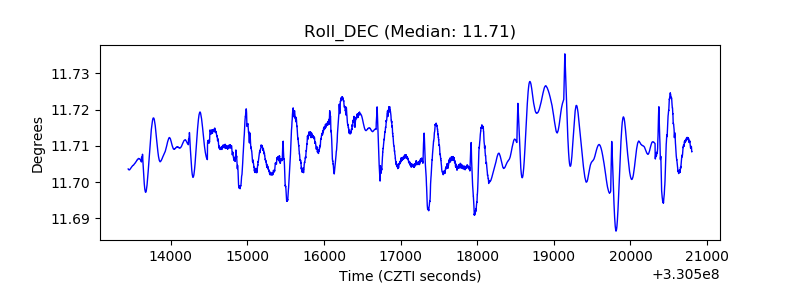 |
| _Roll_RA | 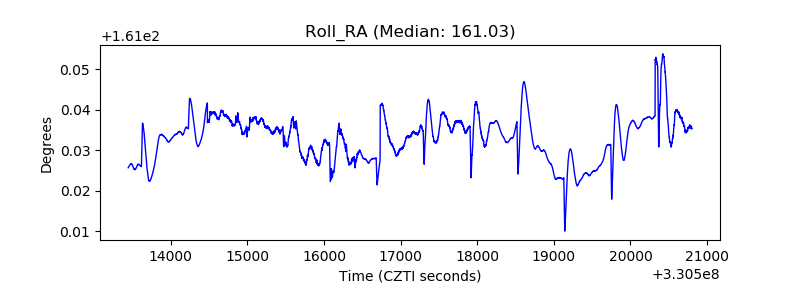 |
| Veto Counter | 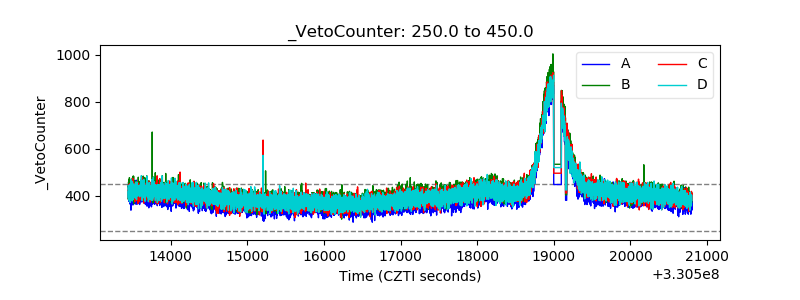 |