| Param | Original file | Final file |
|---|---|---|
| Filename | modeM0/AS1A09_043T02_9000003726_25597cztM0_level2.evt | modeM0/AS1A09_043T02_9000003726_25597cztM0_level2_quad_clean.evt |
| Size (bytes) | 239,895,360 | 42,131,520 |
| Size | 228.8 MB | 40.2 MB |
| Events in quadrant A | 1,912,958 | 286,604 |
| Events in quadrant B | 1,142,235 | 293,135 |
| Events in quadrant C | 1,046,333 | 279,437 |
| Events in quadrant D | 3,005,102 | 249,441 |
| Mode M0 | |||
|---|---|---|---|
| Quadrant | BADHDUFLAG | Total packets | Discarded packets |
| A | 0 | 7432 | 0 |
| B | 0 | 4792 | 0 |
| C | 0 | 4657 | 0 |
| D | 0 | 10534 | 0 |
| Quadrant | Total seconds | Saturated seconds | Saturation percentage |
|---|---|---|---|
| A | 2313 | 10 | 0.432339% |
| B | 2314 | 3 | 0.129646% |
| C | 2314 | 6 | 0.259291% |
| D | 2314 | 461 | 19.922213% |
Noise dominated data is calculated using 1-second bins in cleaned event files. If a bin has >2000 counts, and if more than 50% of those come from <1% of pixels, then it is considered to be noise-dominated and hence unusable.
| Quadrant | # 1 sec bins | Bins with >0 counts | Bins with >2000 counts | High rate bins dominated by noise | Noise dominated (total time) | Noise dominated (detector-on time) | Marked lightcurve |
|---|---|---|---|---|---|---|---|
| A | 2313 | 2313 | 7 | 7 | 0.30% | 0.30% | 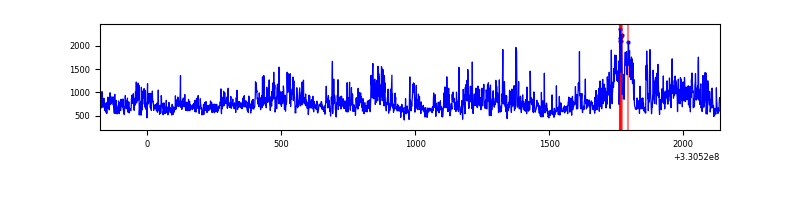 |
| B | 2314 | 2314 | 0 | 0 | 0.00% | 0.00% | 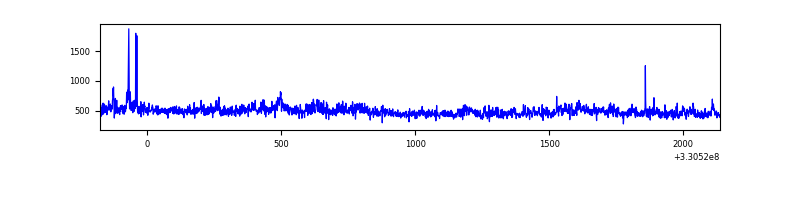 |
| C | 2314 | 2314 | 1 | 1 | 0.04% | 0.04% | 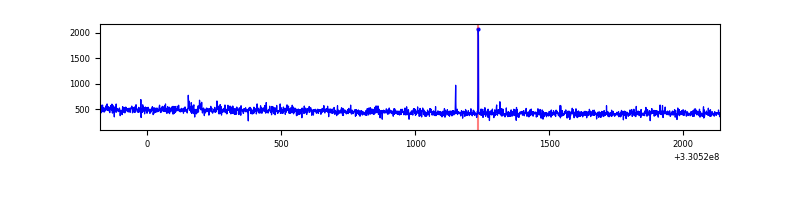 |
| D | 2314 | 2314 | 381 | 381 | 16.46% | 16.46% | 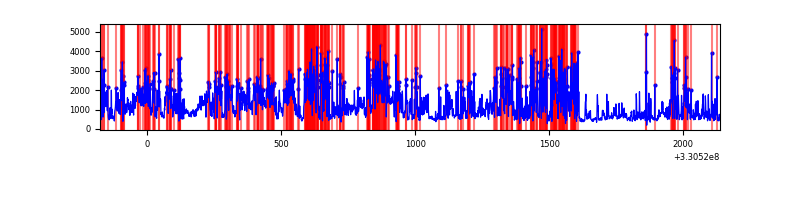 |
Top three noisy pixels from each quadrant. If the there are fewer than three noisy pixels in the level2.evt file, extra rows are filled as -1
| Pixel properties | Quadrant properties | ||||||
|---|---|---|---|---|---|---|---|
| Quadrant | DetID | PixID | Counts | Sigma | Mean | Median | Sigma |
| A | 6 | 16 | 481740 | 8678.28 | 266 | 260 | 55.5 |
| A | 8 | 192 | 386501 | 6961.68 | 266 | 260 | 55.5 |
| A | 4 | 2 | 16670 | 295.78 | 266 | 260 | 55.5 |
| B | 0 | 219 | 68497 | 1332.31 | 263 | 258 | 51.2 |
| B | 0 | 190 | 33990 | 658.59 | 263 | 258 | 51.2 |
| B | 12 | 111 | 5653 | 105.33 | 263 | 258 | 51.2 |
| C | 14 | 238 | 39118 | 636.37 | 253 | 255 | 61.1 |
| C | 3 | 233 | 11455 | 183.4 | 253 | 255 | 61.1 |
| C | 0 | 207 | 6410 | 100.79 | 253 | 255 | 61.1 |
| D | 1 | 52 | 1851236 | 30221.25 | 244 | 236 | 61.2 |
| D | 8 | 195 | 98922 | 1611.24 | 244 | 236 | 61.2 |
| D | 2 | 244 | 67792 | 1102.99 | 244 | 236 | 61.2 |
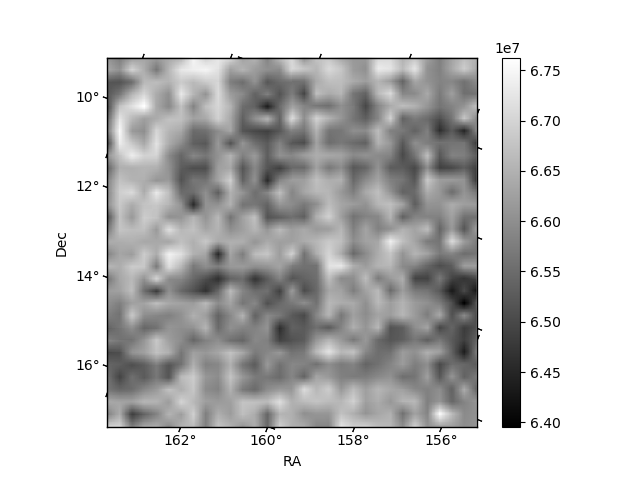
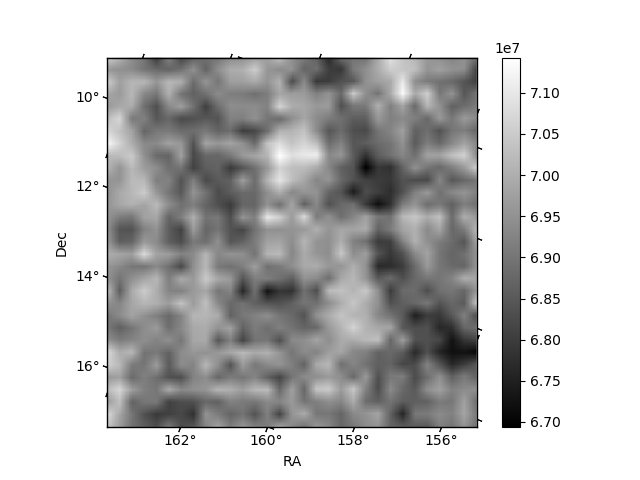
Histogram calculated using DETX and DETY for each event in the final _common_clean file
| Quadrant A | 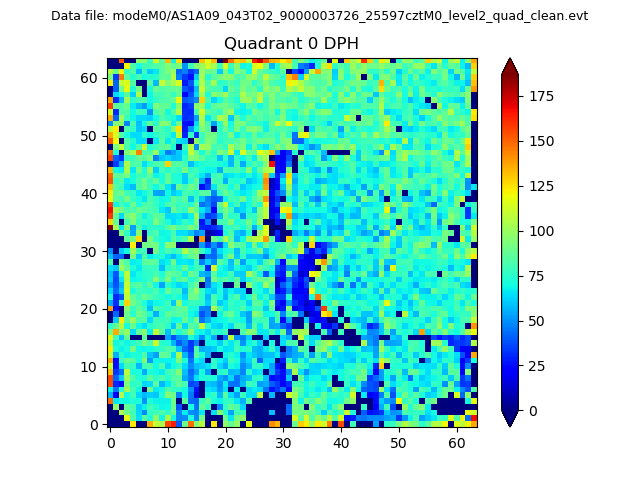 |
 |
Quadrant B |
|---|---|---|---|
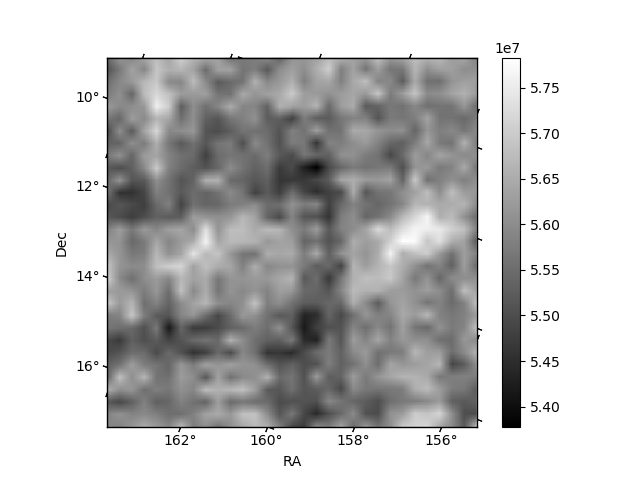
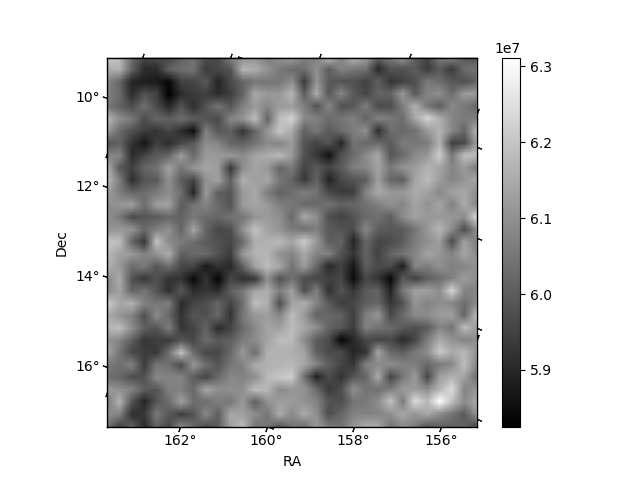
| Quadrant D |  |
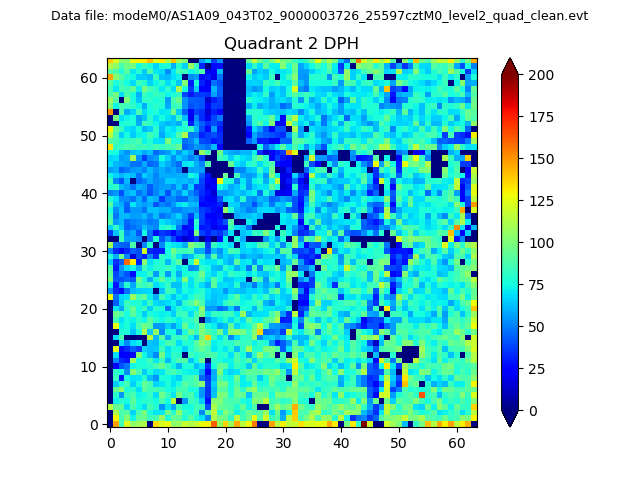 |
Quadrant C |
| Plot type | Count rate plots | Images |
|---|---|---|
| Comparison with Poisson distribution Blue bars denote a histogram of data divided into 1 sec bins. Red curve is a Poisson curve with rate = median count rate of data. |
 |
 |
| Quadrant-wise count rates Data is divided into 100 sec bins |
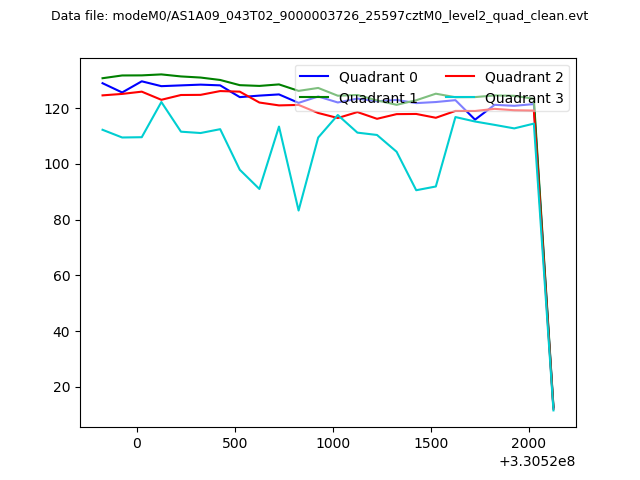 |
|
| Module-wise count rates for Quadrant A Data is divided into 100 sec bins |
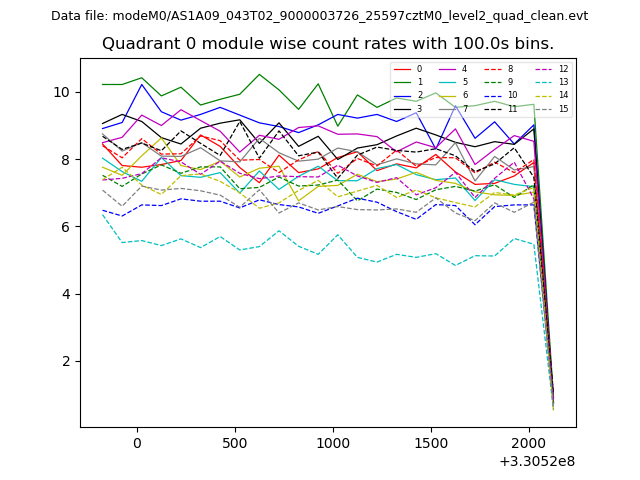 |
 |
| Module-wise count rates for Quadrant B Data is divided into 100 sec bins |
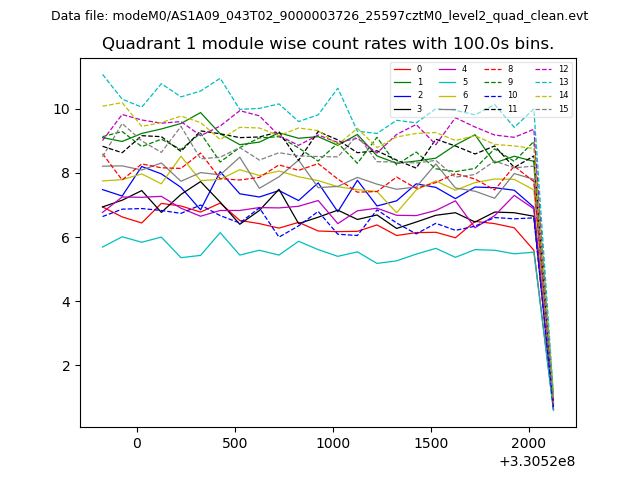 |
 |
| Module-wise count rates for Quadrant C Data is divided into 100 sec bins |
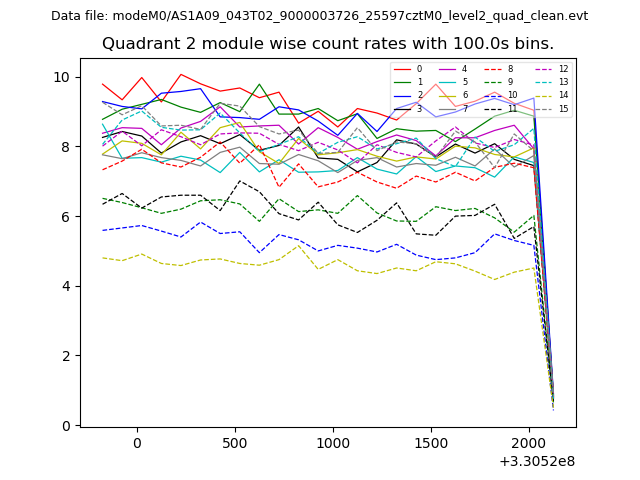 |
 |
| Module-wise count rates for Quadrant D Data is divided into 100 sec bins |
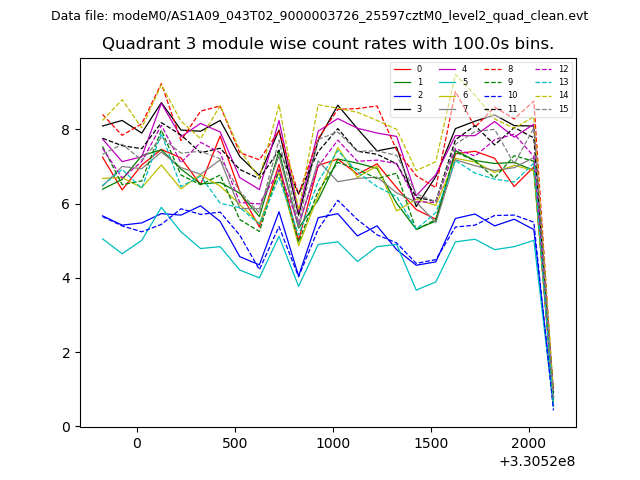 |
 |
| Parameter | Plot |
|---|---|
| CZT HV Monitor | 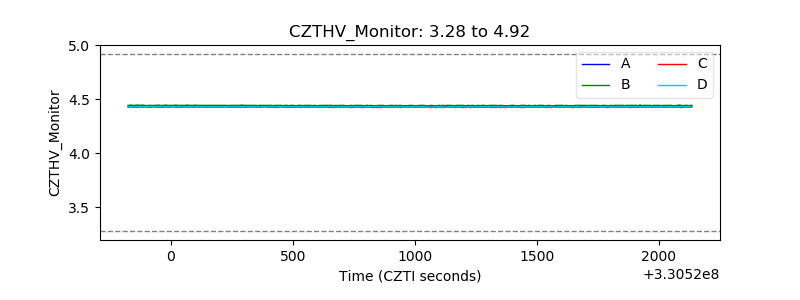 |
| D_VDD | 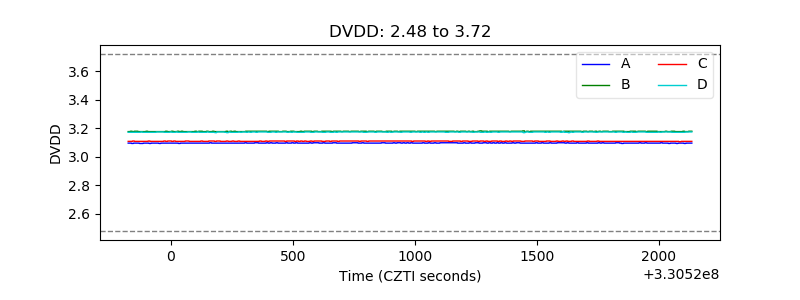 |
| Temperature 1 | 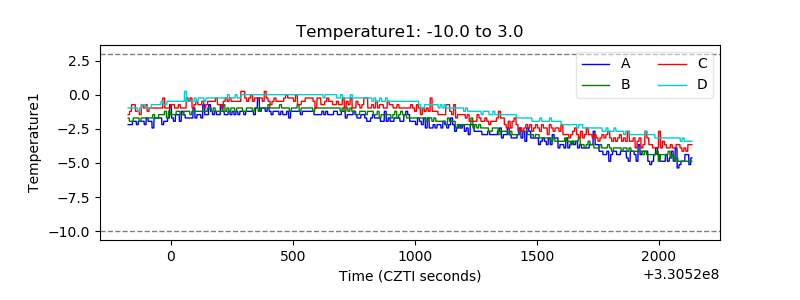 |
| Veto HV Monitor | 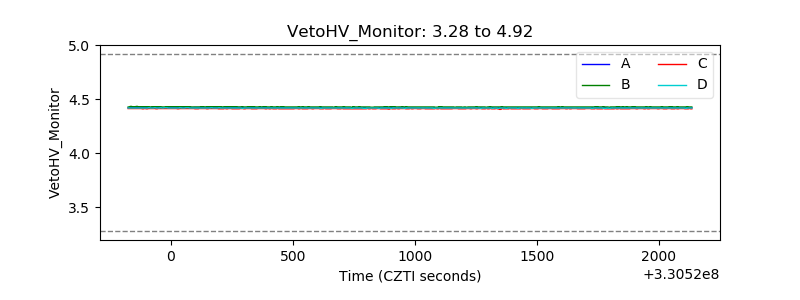 |
| Veto LLD | 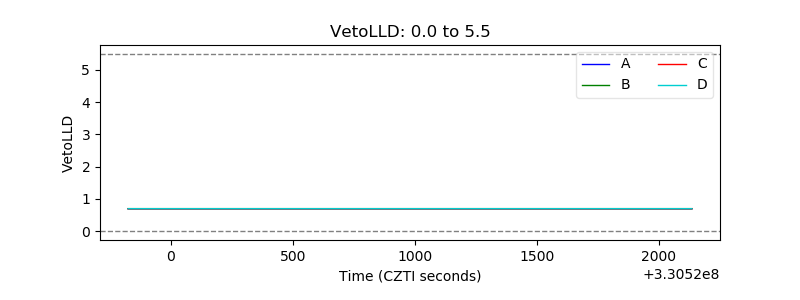 |
| Alpha Counter | 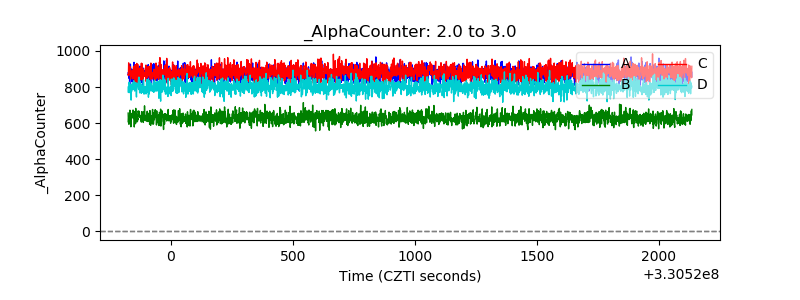 |
| _CPM_Rate | 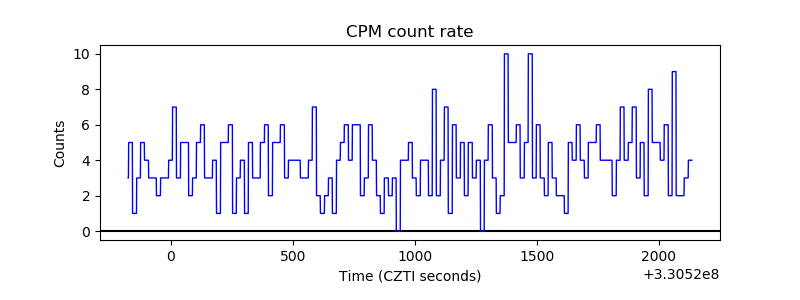 |
| CZT Counter | 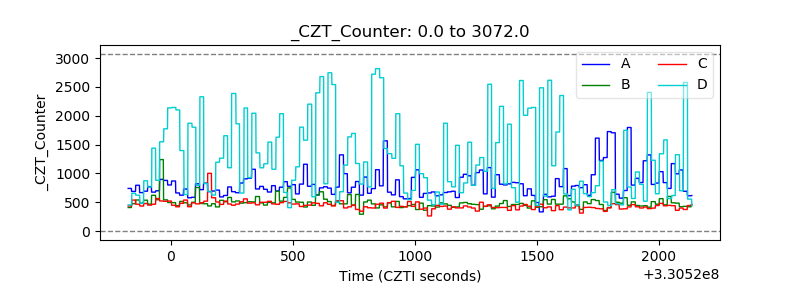 |
| +2.5 Volts monitor |  |
| +5 Volts monitor | 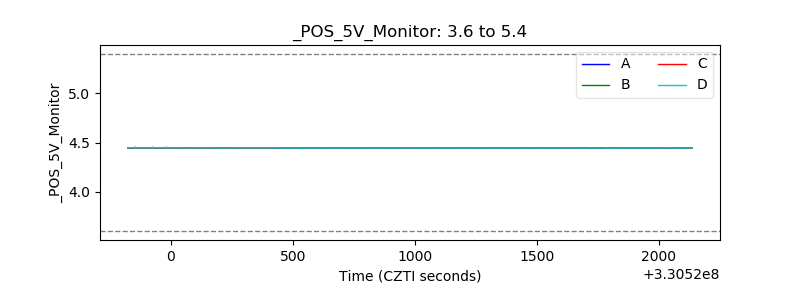 |
| _ROLL_ROT | 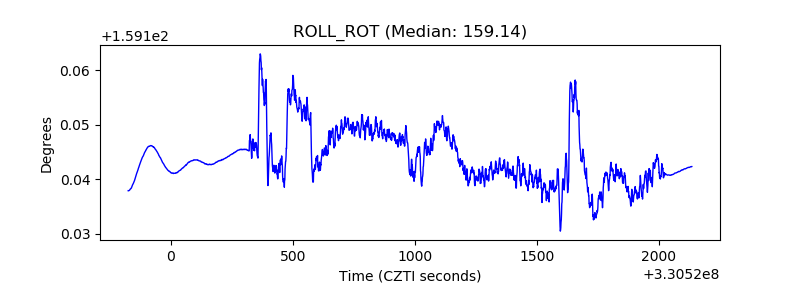 |
| _Roll_DEC | 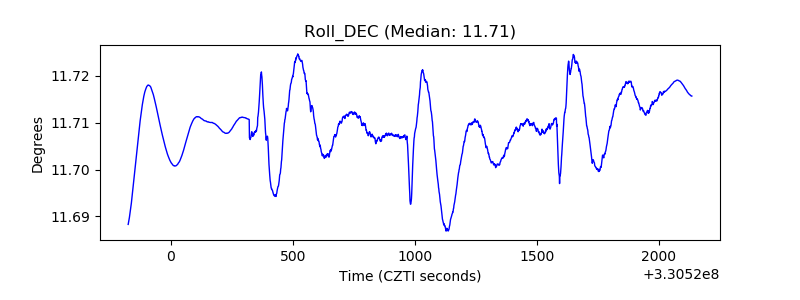 |
| _Roll_RA |  |
| Veto Counter | 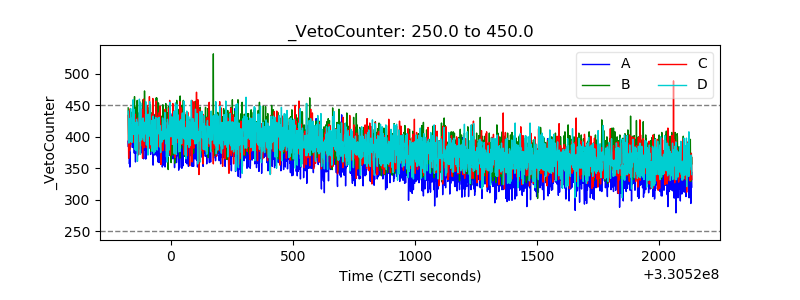 |