| Param | Original file | Final file |
|---|---|---|
| Filename | modeM0/AS1A07_148T02_9000003728_25600cztM0_level2.evt | modeM0/AS1A07_148T02_9000003728_25600cztM0_level2_quad_clean.evt |
| Size (bytes) | 1,222,600,320 | 172,071,360 |
| Size | 1.1 GB | 164.1 MB |
| Events in quadrant A | 8,719,803 | 1,083,045 |
| Events in quadrant B | 7,309,482 | 1,092,379 |
| Events in quadrant C | 7,266,684 | 1,028,349 |
| Events in quadrant D | 12,739,721 | 993,287 |
| Mode M9 | |||
|---|---|---|---|
| Quadrant | BADHDUFLAG | Total packets | Discarded packets |
| A | 0 | 22 | 0 |
| B | 0 | 22 | 0 |
| C | 0 | 22 | 0 |
| D | 0 | 22 | 0 |
| Mode M0 | |||
|---|---|---|---|
| Quadrant | BADHDUFLAG | Total packets | Discarded packets |
| A | 0 | 35529 | 0 |
| B | 0 | 30708 | 0 |
| C | 0 | 30972 | 0 |
| D | 0 | 47867 | 0 |
| Quadrant | Total seconds | Saturated seconds | Saturation percentage |
|---|---|---|---|
| A | 14694 | 194 | 1.320267% |
| B | 14694 | 125 | 0.850687% |
| C | 14694 | 199 | 1.354294% |
| D | 14695 | 929 | 6.321878% |
Noise dominated data is calculated using 1-second bins in cleaned event files. If a bin has >2000 counts, and if more than 50% of those come from <1% of pixels, then it is considered to be noise-dominated and hence unusable.
| Quadrant | # 1 sec bins | Bins with >0 counts | Bins with >2000 counts | High rate bins dominated by noise | Noise dominated (total time) | Noise dominated (detector-on time) | Marked lightcurve |
|---|---|---|---|---|---|---|---|
| A | 16879 | 14697 | 19 | 19 | 0.11% | 0.13% |  |
| B | 16879 | 14697 | 2 | 2 | 0.01% | 0.01% |  |
| C | 16879 | 14697 | 10 | 10 | 0.06% | 0.07% |  |
| D | 16880 | 14698 | 659 | 659 | 3.90% | 4.48% |  |
Top three noisy pixels from each quadrant. If the there are fewer than three noisy pixels in the level2.evt file, extra rows are filled as -1
| Pixel properties | Quadrant properties | ||||||
|---|---|---|---|---|---|---|---|
| Quadrant | DetID | PixID | Counts | Sigma | Mean | Median | Sigma |
| A | 6 | 16 | 932969 | 2539.32 | 1822 | 1785 | 366.7 |
| A | 8 | 192 | 764329 | 2079.44 | 1822 | 1785 | 366.7 |
| A | 13 | 254 | 23809 | 60.06 | 1822 | 1785 | 366.7 |
| B | 0 | 219 | 136374 | 390.48 | 1811 | 1766 | 344.7 |
| B | 12 | 111 | 43087 | 119.87 | 1811 | 1766 | 344.7 |
| B | 11 | 111 | 38300 | 105.98 | 1811 | 1766 | 344.7 |
| C | 14 | 238 | 273392 | 668.02 | 1729 | 1740 | 406.6 |
| C | 3 | 233 | 138967 | 337.46 | 1729 | 1740 | 406.6 |
| C | 0 | 207 | 87836 | 211.72 | 1729 | 1740 | 406.6 |
| D | 1 | 52 | 4711768 | 11200.06 | 1720 | 1669 | 420.5 |
| D | 2 | 244 | 465545 | 1103.04 | 1720 | 1669 | 420.5 |
| D | 13 | 174 | 425157 | 1007.0 | 1720 | 1669 | 420.5 |
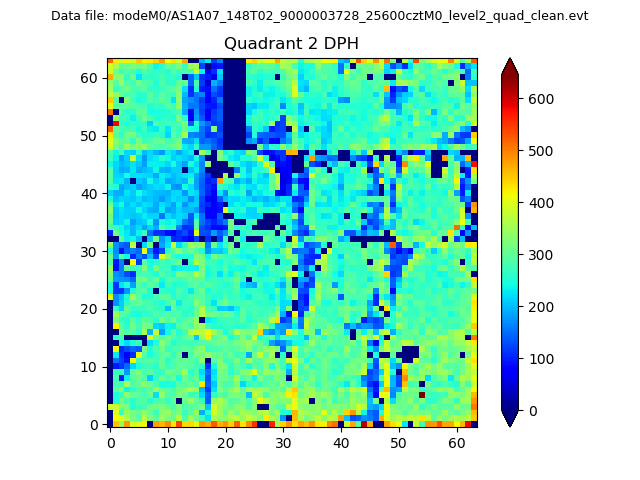
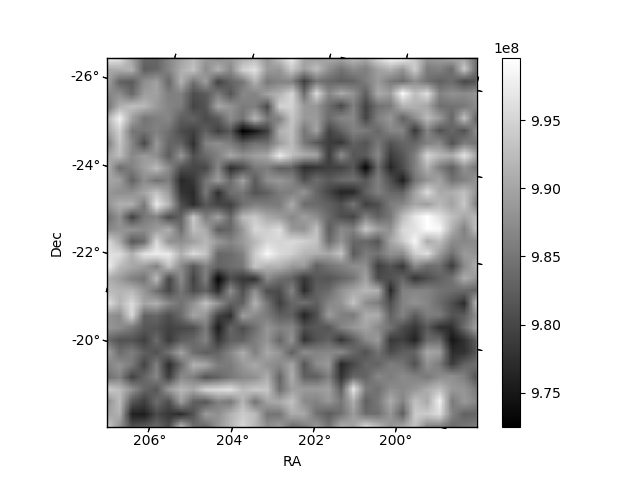
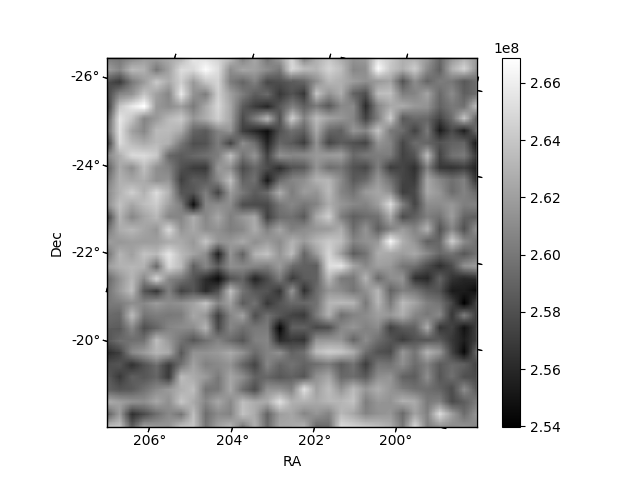
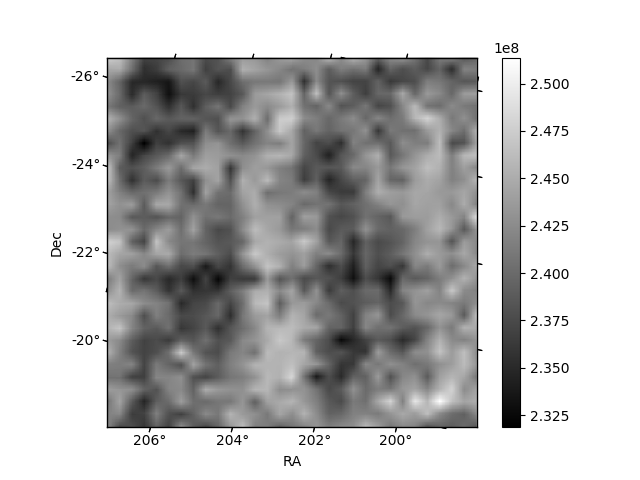
Histogram calculated using DETX and DETY for each event in the final _common_clean file
| Quadrant A | 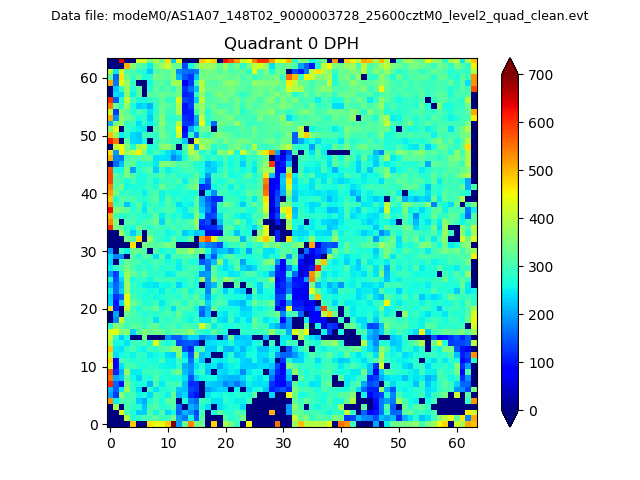 |
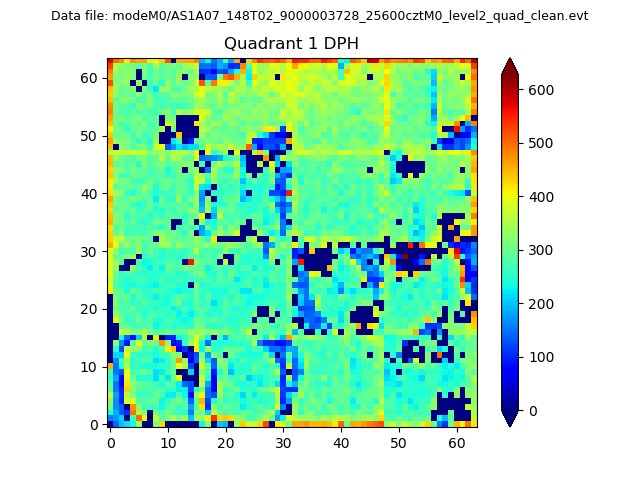 |
Quadrant B |
|---|---|---|---|
| Quadrant D | 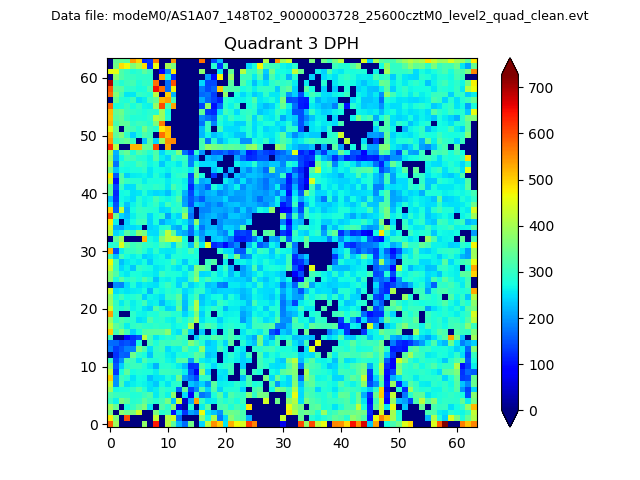 |
 |
Quadrant C |
| Plot type | Count rate plots | Images |
|---|---|---|
| Comparison with Poisson distribution Blue bars denote a histogram of data divided into 1 sec bins. Red curve is a Poisson curve with rate = median count rate of data. |
 |
 |
| Quadrant-wise count rates Data is divided into 100 sec bins |
 |
|
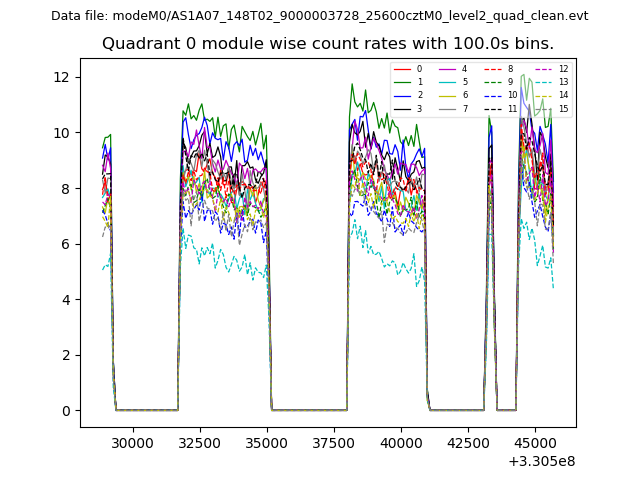
| Module-wise count rates for Quadrant A Data is divided into 100 sec bins |
 |
 |
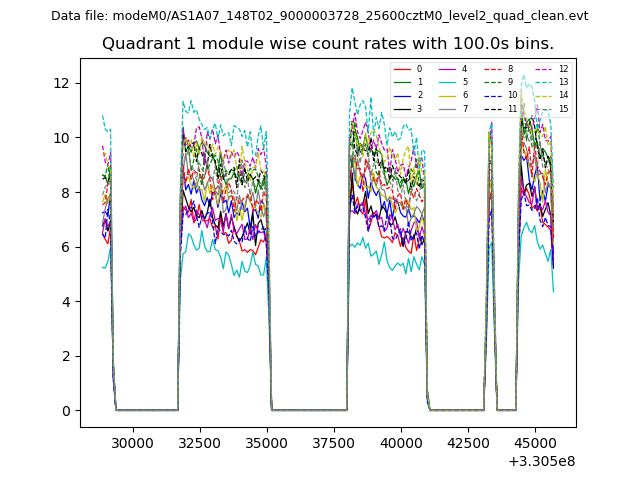
| Module-wise count rates for Quadrant B Data is divided into 100 sec bins |
 |
 |
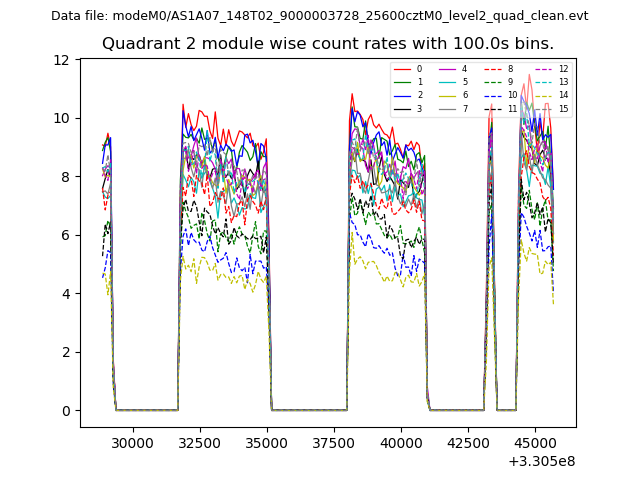
| Module-wise count rates for Quadrant C Data is divided into 100 sec bins |
 |
 |
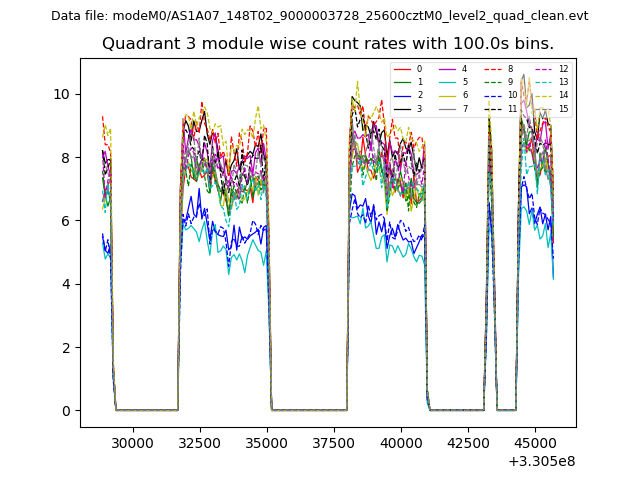
| Module-wise count rates for Quadrant D Data is divided into 100 sec bins |
 |
 |
| Parameter | Plot |
|---|---|
| CZT HV Monitor | 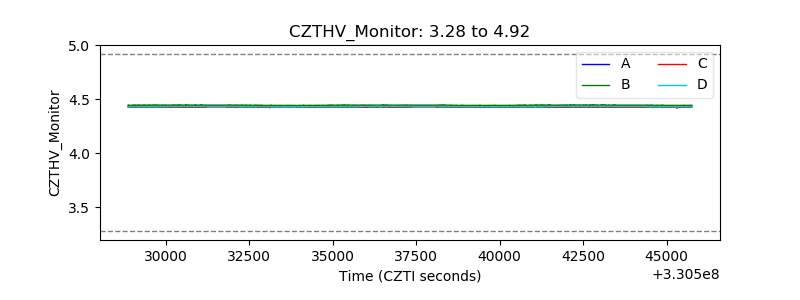 |
| D_VDD | 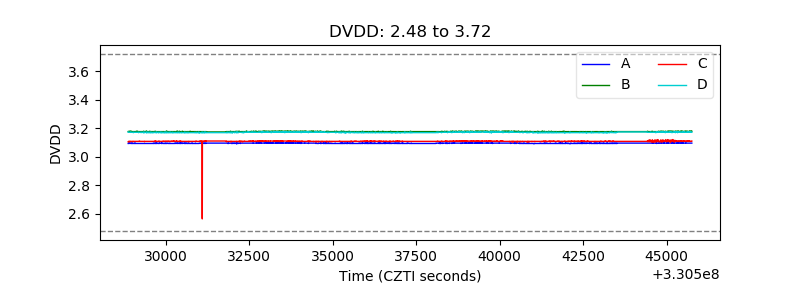 |
| Temperature 1 | 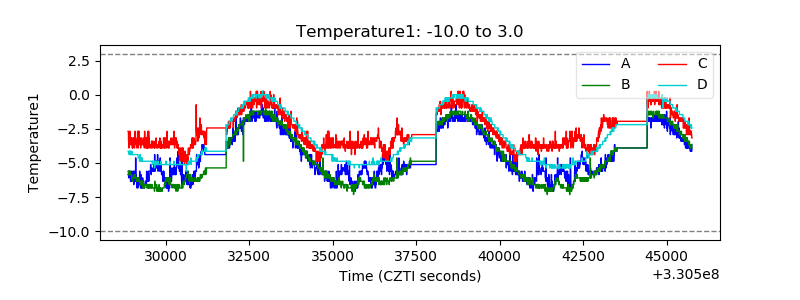 |
| Veto HV Monitor | 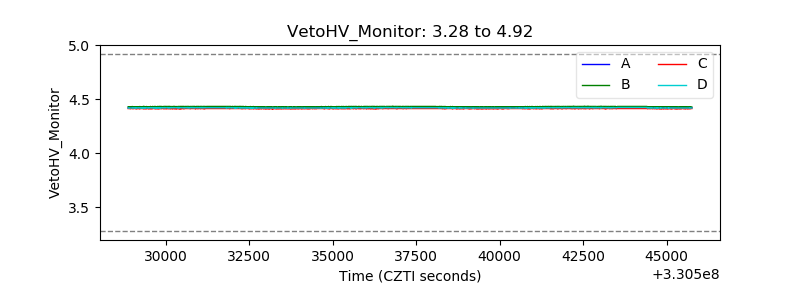 |
| Veto LLD | 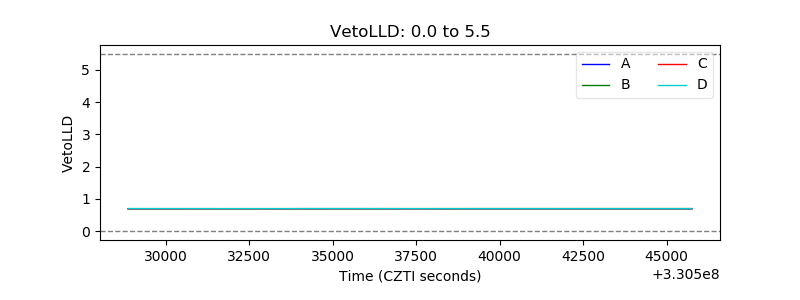 |
| Alpha Counter | 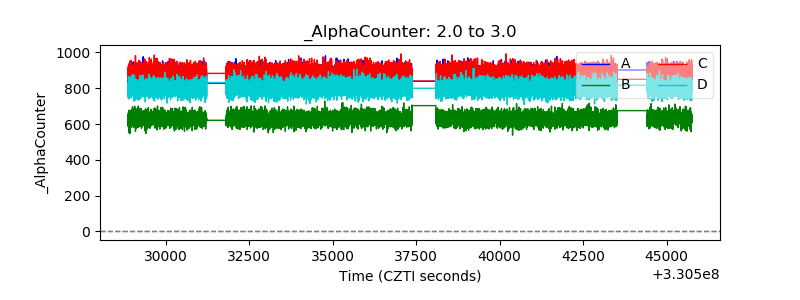 |
| _CPM_Rate | 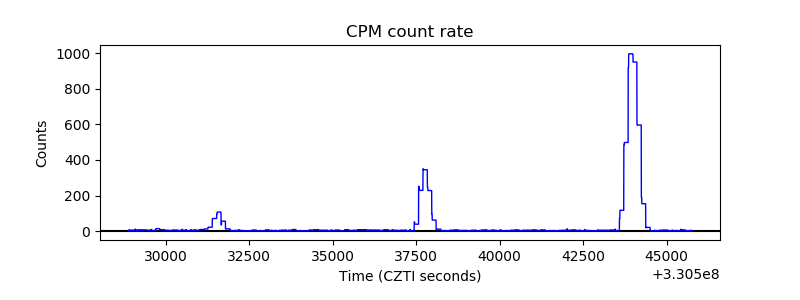 |
| CZT Counter | 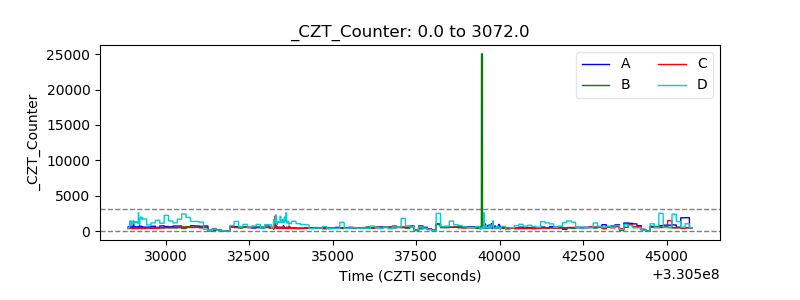 |
| +2.5 Volts monitor |  |
| +5 Volts monitor |  |
| _ROLL_ROT | 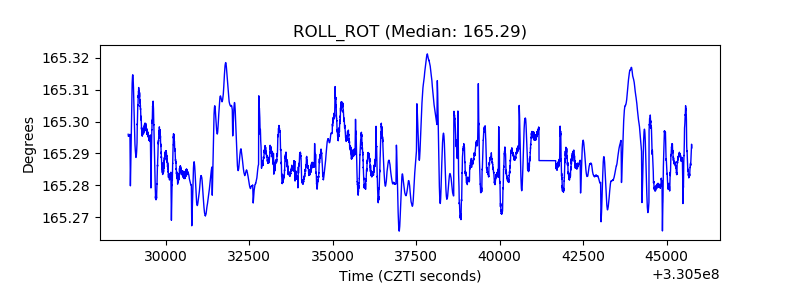 |
| _Roll_DEC | 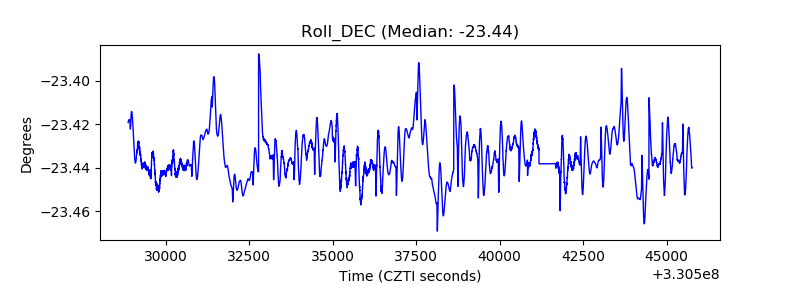 |
| _Roll_RA | 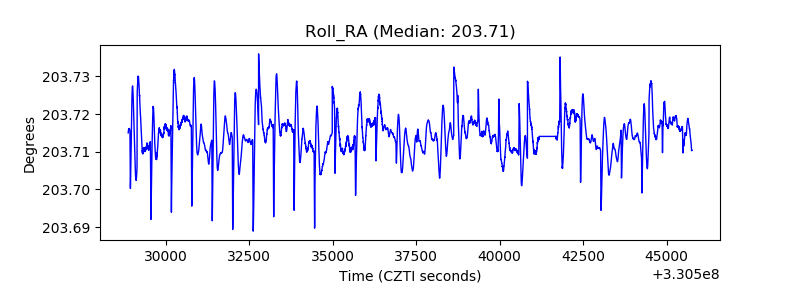 |
| Veto Counter | 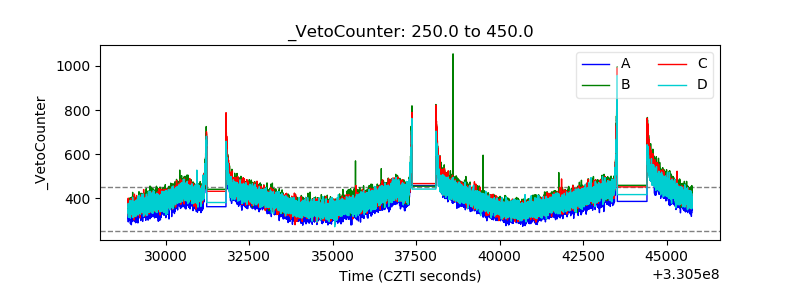 |