| Param | Original file | Final file |
|---|---|---|
| Filename | modeM0/AS1A07_148T02_9000003728_25601cztM0_level2.evt | modeM0/AS1A07_148T02_9000003728_25601cztM0_level2_quad_clean.evt |
| Size (bytes) | 497,226,240 | 93,188,160 |
| Size | 474.2 MB | 88.9 MB |
| Events in quadrant A | 3,977,300 | 606,460 |
| Events in quadrant B | 3,391,787 | 617,415 |
| Events in quadrant C | 3,244,184 | 575,713 |
| Events in quadrant D | 3,997,304 | 562,135 |
| Mode M9 | |||
|---|---|---|---|
| Quadrant | BADHDUFLAG | Total packets | Discarded packets |
| A | 0 | 12 | 0 |
| B | 0 | 13 | 0 |
| C | 0 | 13 | 0 |
| D | 0 | 13 | 0 |
| Mode M0 | |||
|---|---|---|---|
| Quadrant | BADHDUFLAG | Total packets | Discarded packets |
| A | 0 | 16226 | 0 |
| B | 0 | 14275 | 0 |
| C | 0 | 13918 | 0 |
| D | 0 | 16246 | 0 |
| Quadrant | Total seconds | Saturated seconds | Saturation percentage |
|---|---|---|---|
| A | 6609 | 104 | 1.573612% |
| B | 6609 | 43 | 0.650628% |
| C | 6609 | 72 | 1.089424% |
| D | 6609 | 133 | 2.012407% |
Noise dominated data is calculated using 1-second bins in cleaned event files. If a bin has >2000 counts, and if more than 50% of those come from <1% of pixels, then it is considered to be noise-dominated and hence unusable.
| Quadrant | # 1 sec bins | Bins with >0 counts | Bins with >2000 counts | High rate bins dominated by noise | Noise dominated (total time) | Noise dominated (detector-on time) | Marked lightcurve |
|---|---|---|---|---|---|---|---|
| A | 7659 | 6610 | 30 | 30 | 0.39% | 0.45% | 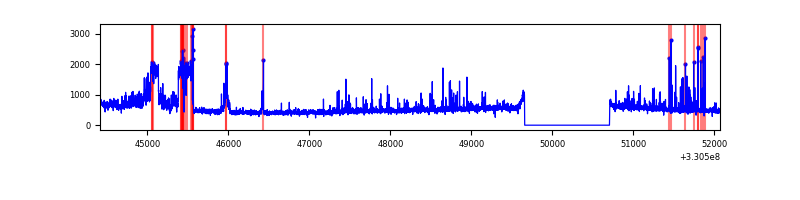 |
| B | 7659 | 6610 | 6 | 6 | 0.08% | 0.09% | 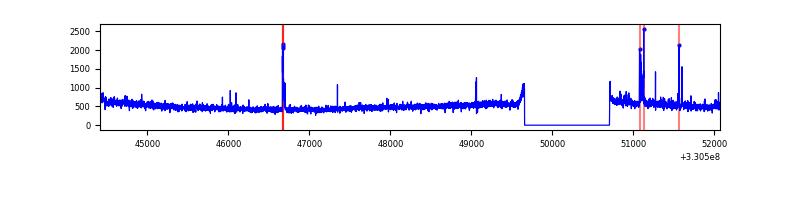 |
| C | 7659 | 6610 | 2 | 2 | 0.03% | 0.03% | 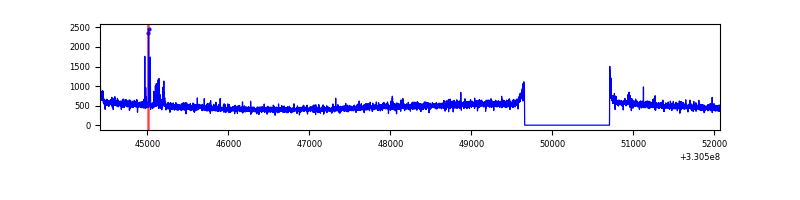 |
| D | 7659 | 6610 | 58 | 58 | 0.76% | 0.88% | 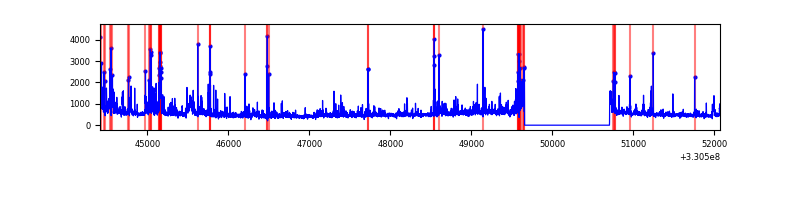 |
Top three noisy pixels from each quadrant. If the there are fewer than three noisy pixels in the level2.evt file, extra rows are filled as -1
| Pixel properties | Quadrant properties | ||||||
|---|---|---|---|---|---|---|---|
| Quadrant | DetID | PixID | Counts | Sigma | Mean | Median | Sigma |
| A | 6 | 16 | 671272 | 4050.38 | 827 | 811 | 165.5 |
| A | 8 | 192 | 97990 | 587.08 | 827 | 811 | 165.5 |
| A | 0 | 13 | 13287 | 75.37 | 827 | 811 | 165.5 |
| B | 0 | 219 | 97266 | 610.85 | 824 | 808 | 157.9 |
| B | 12 | 111 | 19189 | 116.4 | 824 | 808 | 157.9 |
| B | 7 | 219 | 18381 | 111.29 | 824 | 808 | 157.9 |
| C | 14 | 238 | 123409 | 668.19 | 782 | 787 | 183.5 |
| C | 0 | 207 | 37320 | 199.07 | 782 | 787 | 183.5 |
| C | 2 | 16 | 19525 | 102.1 | 782 | 787 | 183.5 |
| D | 1 | 52 | 495685 | 2570.45 | 789 | 766 | 192.5 |
| D | 13 | 174 | 229383 | 1187.36 | 789 | 766 | 192.5 |
| D | 2 | 244 | 94074 | 484.61 | 789 | 766 | 192.5 |
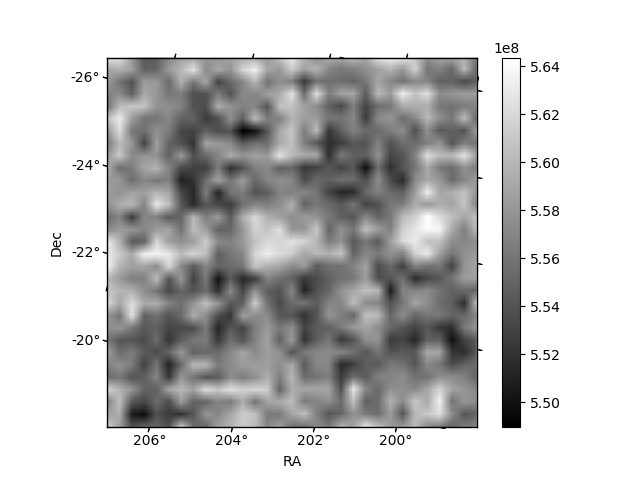
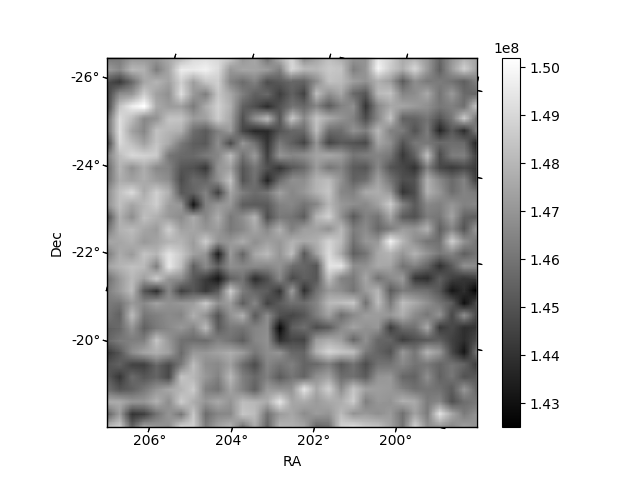
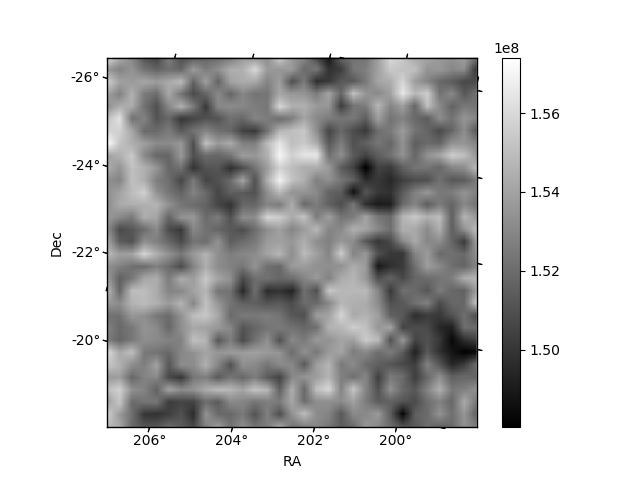
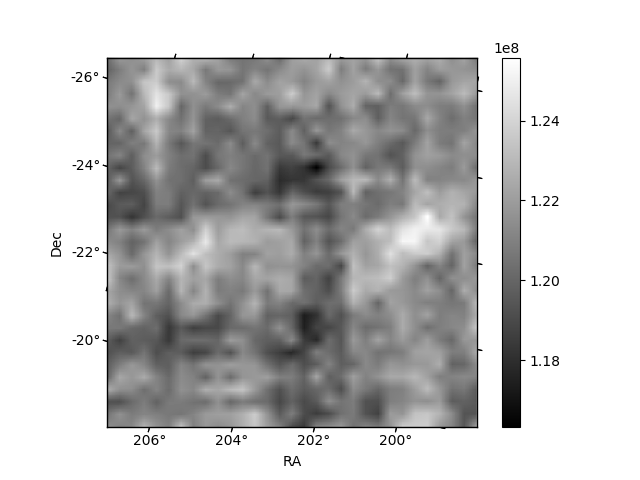
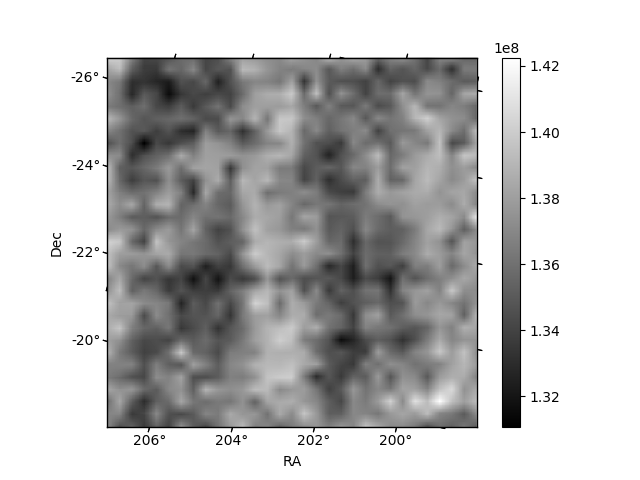
Histogram calculated using DETX and DETY for each event in the final _common_clean file
| Quadrant A | 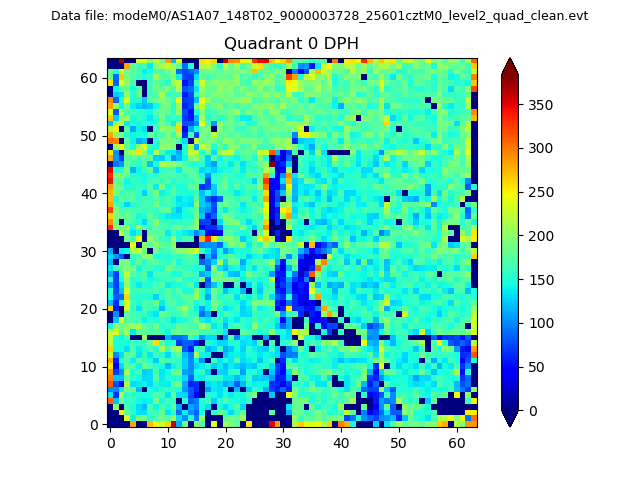 |
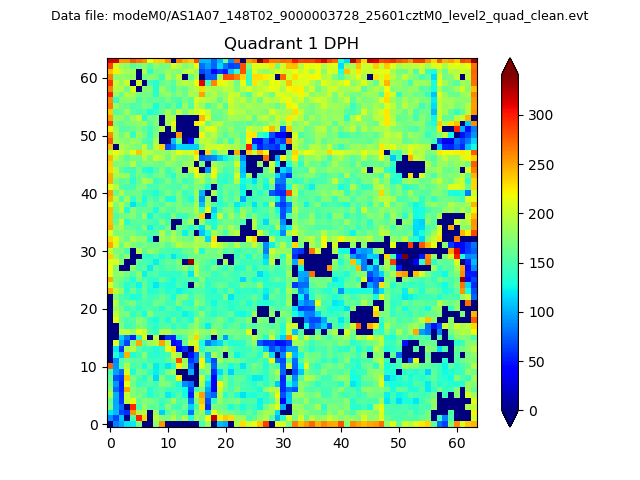 |
Quadrant B |
|---|---|---|---|
| Quadrant D | 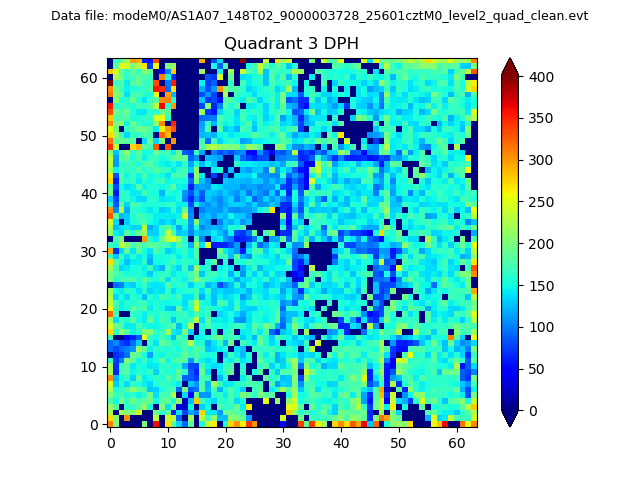 |
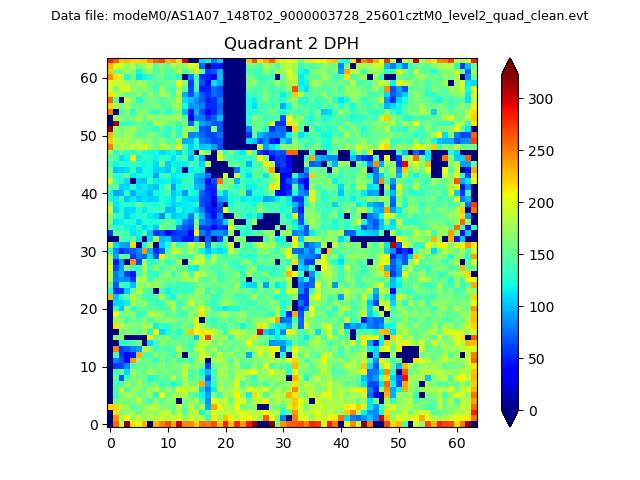 |
Quadrant C |
| Plot type | Count rate plots | Images |
|---|---|---|
| Comparison with Poisson distribution Blue bars denote a histogram of data divided into 1 sec bins. Red curve is a Poisson curve with rate = median count rate of data. |
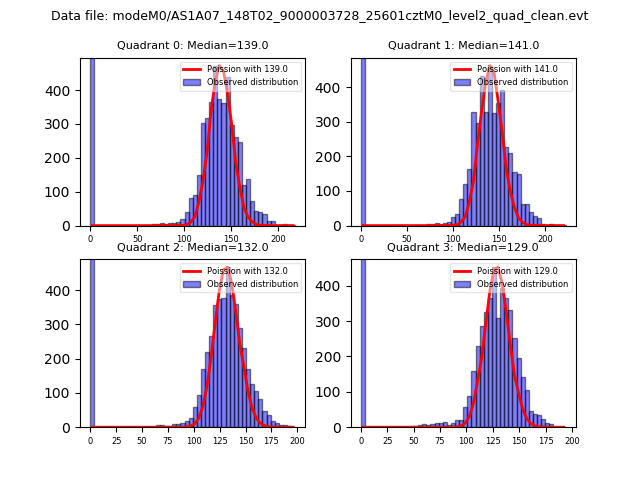 |
 |
| Quadrant-wise count rates Data is divided into 100 sec bins |
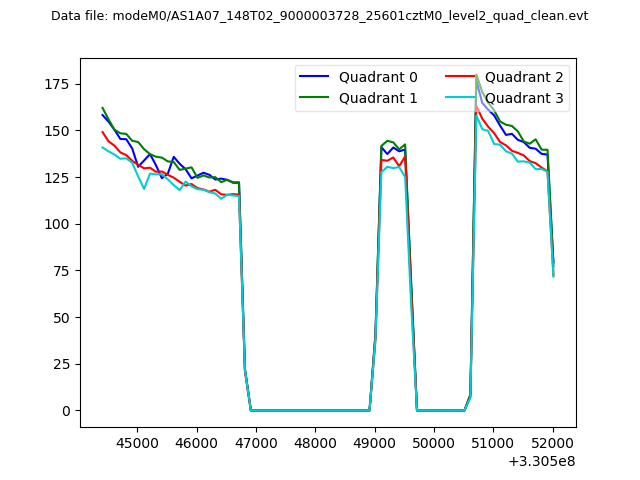 |
|
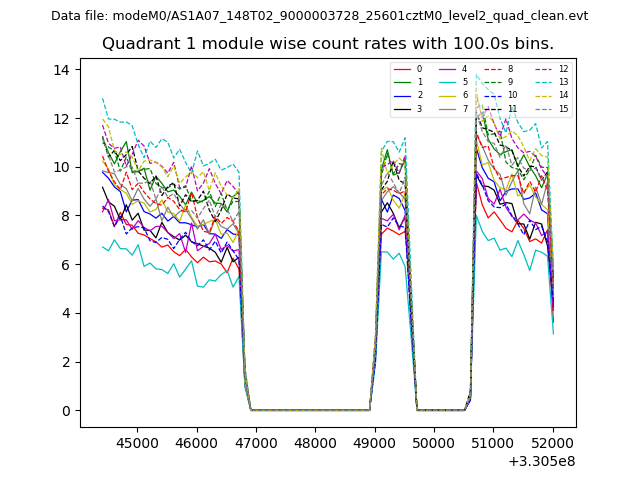
| Module-wise count rates for Quadrant A Data is divided into 100 sec bins |
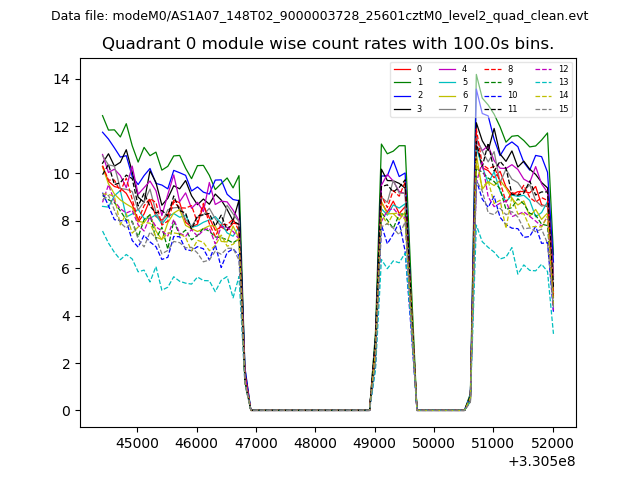 |
 |
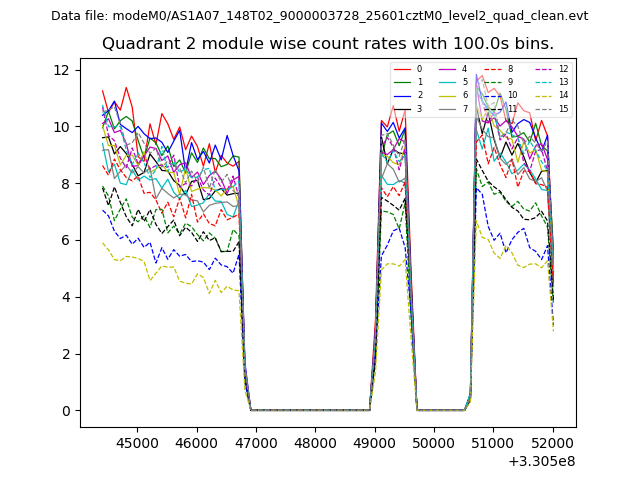
| Module-wise count rates for Quadrant B Data is divided into 100 sec bins |
 |
 |
| Module-wise count rates for Quadrant C Data is divided into 100 sec bins |
 |
 |
| Module-wise count rates for Quadrant D Data is divided into 100 sec bins |
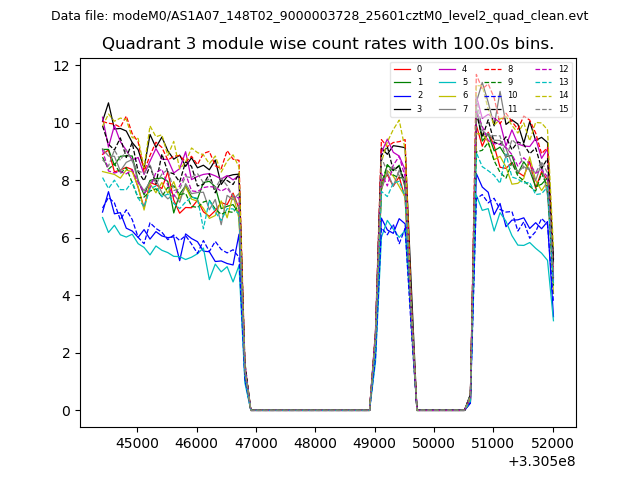 |
 |
| Parameter | Plot |
|---|---|
| CZT HV Monitor | 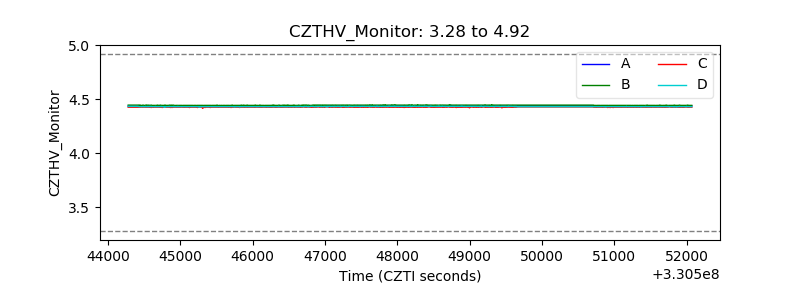 |
| D_VDD | 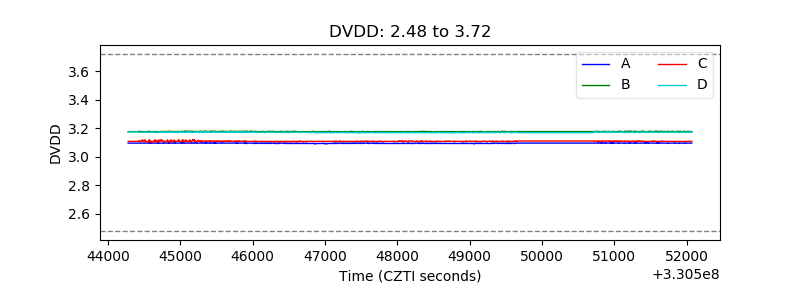 |
| Temperature 1 | 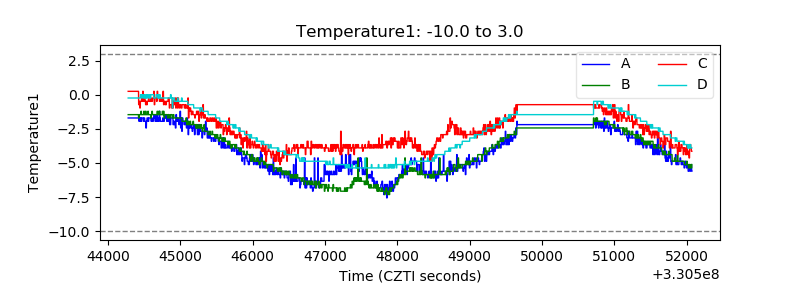 |
| Veto HV Monitor | 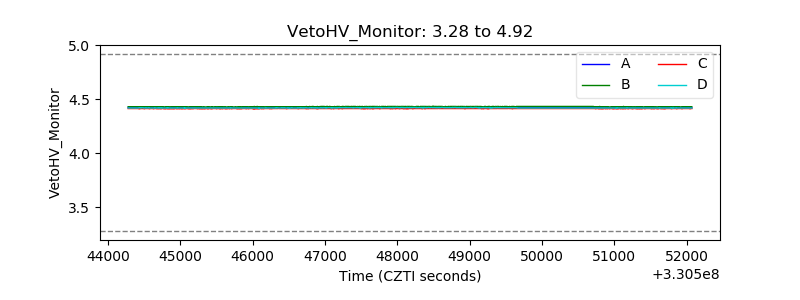 |
| Veto LLD | 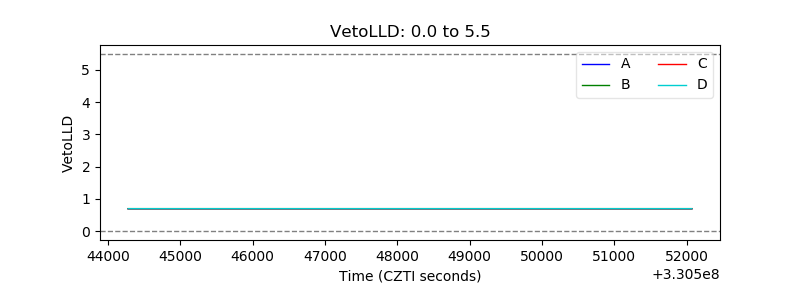 |
| Alpha Counter | 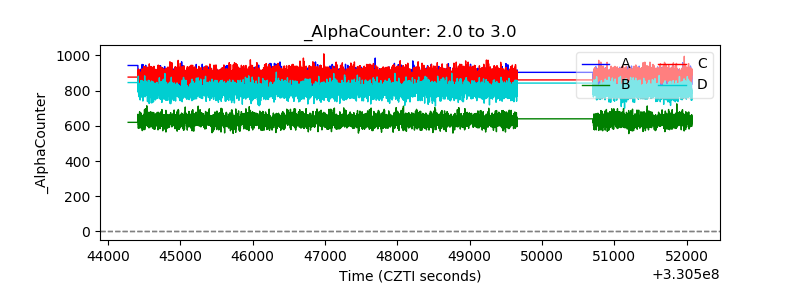 |
| _CPM_Rate | 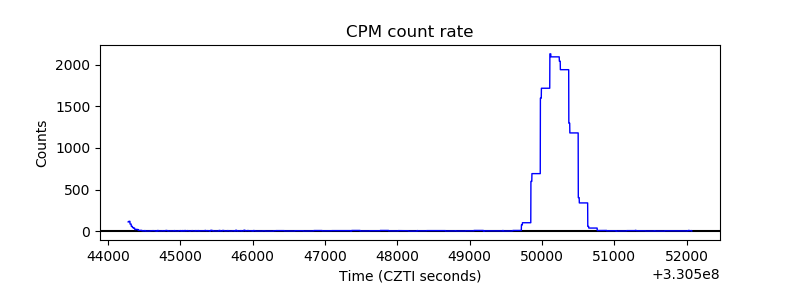 |
| CZT Counter | 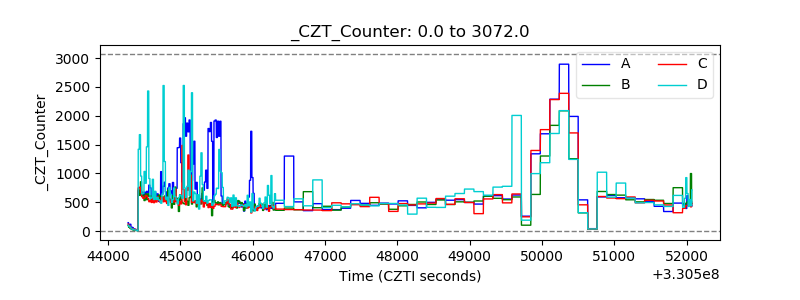 |
| +2.5 Volts monitor | 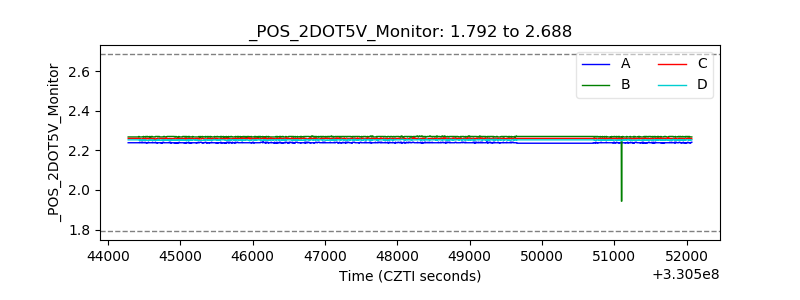 |
| +5 Volts monitor |  |
| _ROLL_ROT | 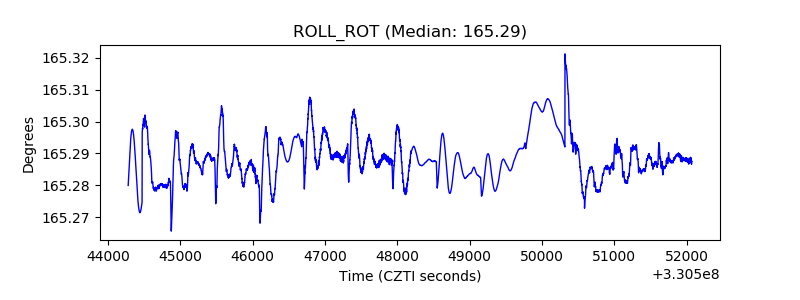 |
| _Roll_DEC | 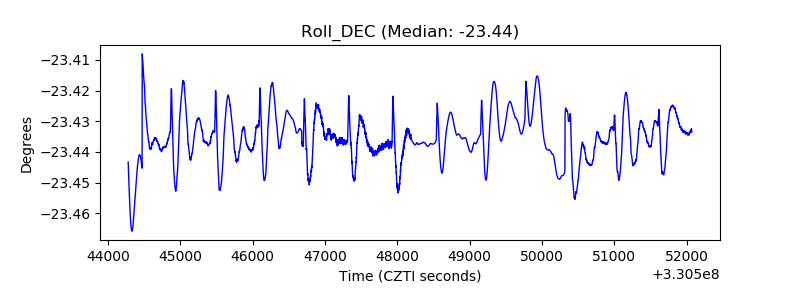 |
| _Roll_RA | 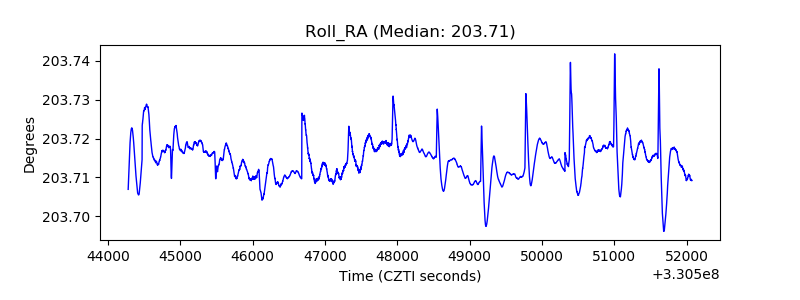 |
| Veto Counter | 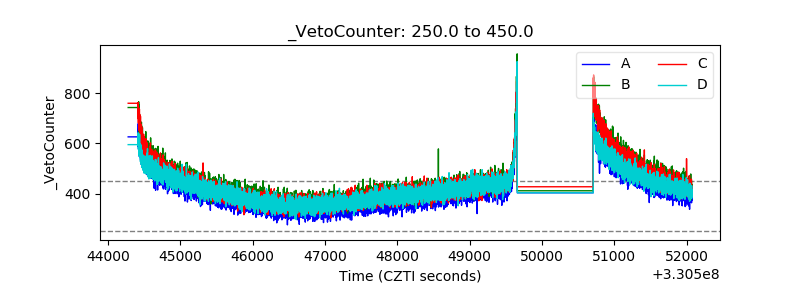 |