| Param | Original file | Final file |
|---|---|---|
| Filename | modeM0/AS1A07_148T02_9000003728_25603cztM0_level2.evt | modeM0/AS1A07_148T02_9000003728_25603cztM0_level2_quad_clean.evt |
| Size (bytes) | 474,834,240 | 94,383,360 |
| Size | 452.8 MB | 90.0 MB |
| Events in quadrant A | 3,465,776 | 622,030 |
| Events in quadrant B | 3,374,187 | 633,936 |
| Events in quadrant C | 3,244,812 | 585,888 |
| Events in quadrant D | 3,861,068 | 569,978 |
| Mode M9 | |||
|---|---|---|---|
| Quadrant | BADHDUFLAG | Total packets | Discarded packets |
| A | 0 | 15 | 0 |
| B | 0 | 16 | 0 |
| C | 0 | 16 | 0 |
| D | 0 | 16 | 0 |
| Mode M0 | |||
|---|---|---|---|
| Quadrant | BADHDUFLAG | Total packets | Discarded packets |
| A | 0 | 14314 | 0 |
| B | 0 | 13989 | 0 |
| C | 0 | 13611 | 0 |
| D | 0 | 15705 | 0 |
| Quadrant | Total seconds | Saturated seconds | Saturation percentage |
|---|---|---|---|
| A | 6401 | 38 | 0.593657% |
| B | 6401 | 44 | 0.687393% |
| C | 6401 | 97 | 1.515388% |
| D | 6401 | 52 | 0.812373% |
Noise dominated data is calculated using 1-second bins in cleaned event files. If a bin has >2000 counts, and if more than 50% of those come from <1% of pixels, then it is considered to be noise-dominated and hence unusable.
| Quadrant | # 1 sec bins | Bins with >0 counts | Bins with >2000 counts | High rate bins dominated by noise | Noise dominated (total time) | Noise dominated (detector-on time) | Marked lightcurve |
|---|---|---|---|---|---|---|---|
| A | 7561 | 6402 | 13 | 13 | 0.17% | 0.20% | 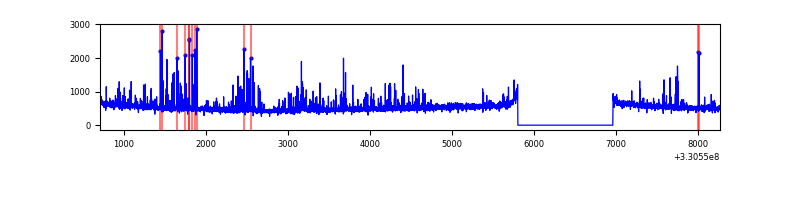 |
| B | 7561 | 6402 | 3 | 3 | 0.04% | 0.05% | 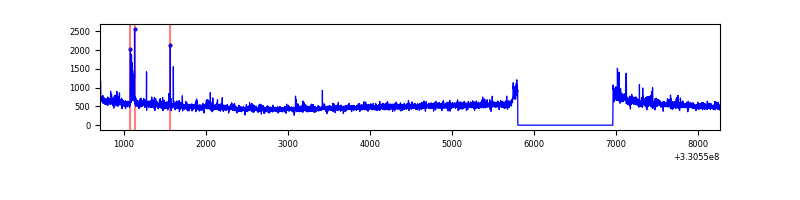 |
| C | 7561 | 6402 | 10 | 10 | 0.13% | 0.16% | 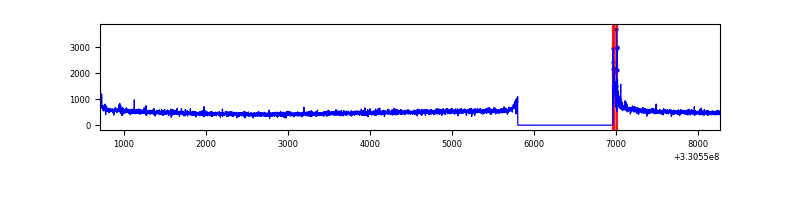 |
| D | 7561 | 6402 | 36 | 36 | 0.48% | 0.56% | 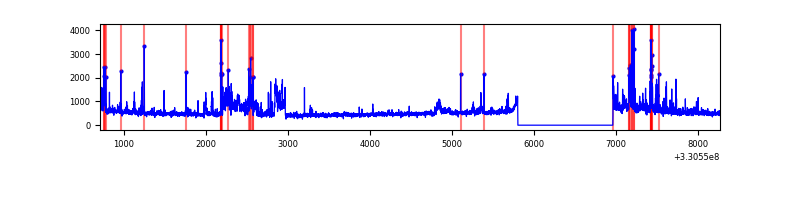 |
Top three noisy pixels from each quadrant. If the there are fewer than three noisy pixels in the level2.evt file, extra rows are filled as -1
| Pixel properties | Quadrant properties | ||||||
|---|---|---|---|---|---|---|---|
| Quadrant | DetID | PixID | Counts | Sigma | Mean | Median | Sigma |
| A | 6 | 16 | 200789 | 1211.4 | 823 | 807 | 165.1 |
| A | 8 | 192 | 87535 | 525.36 | 823 | 807 | 165.1 |
| A | 13 | 254 | 10338 | 57.73 | 823 | 807 | 165.1 |
| B | 0 | 219 | 104162 | 658.73 | 822 | 805 | 156.9 |
| B | 0 | 190 | 19442 | 118.78 | 822 | 805 | 156.9 |
| B | 12 | 111 | 18422 | 112.28 | 822 | 805 | 156.9 |
| C | 14 | 238 | 123593 | 674.11 | 776 | 782 | 182.2 |
| C | 3 | 233 | 77848 | 423.02 | 776 | 782 | 182.2 |
| C | 0 | 207 | 22498 | 119.2 | 776 | 782 | 182.2 |
| D | 1 | 52 | 680724 | 3563.92 | 783 | 762 | 190.8 |
| D | 8 | 195 | 102281 | 532.1 | 783 | 762 | 190.8 |
| D | 2 | 153 | 39593 | 203.53 | 783 | 762 | 190.8 |
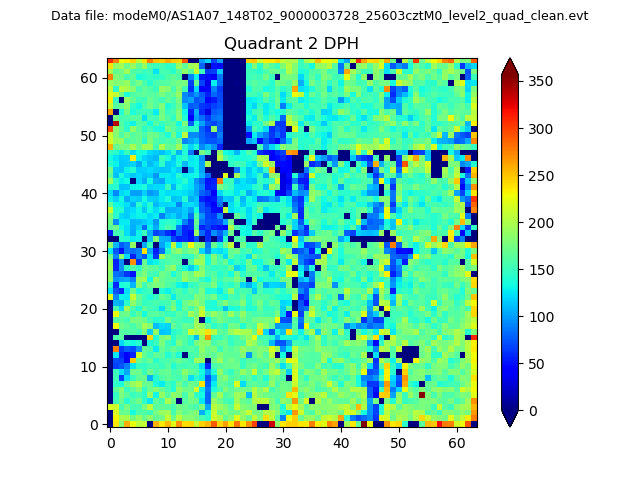
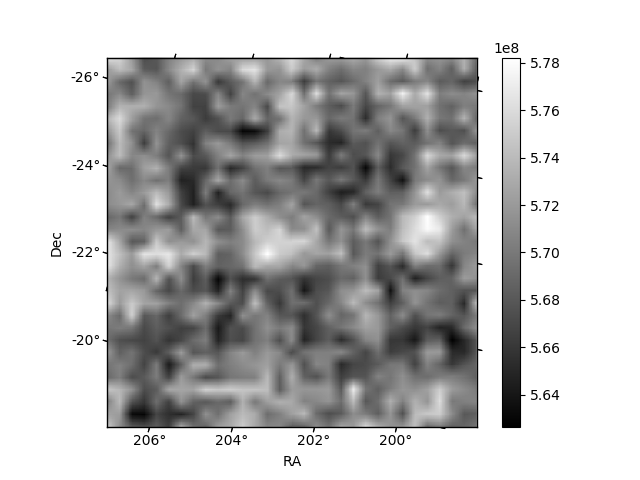
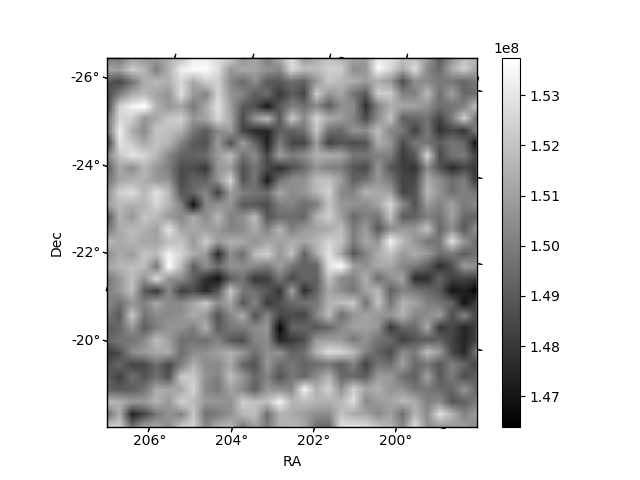
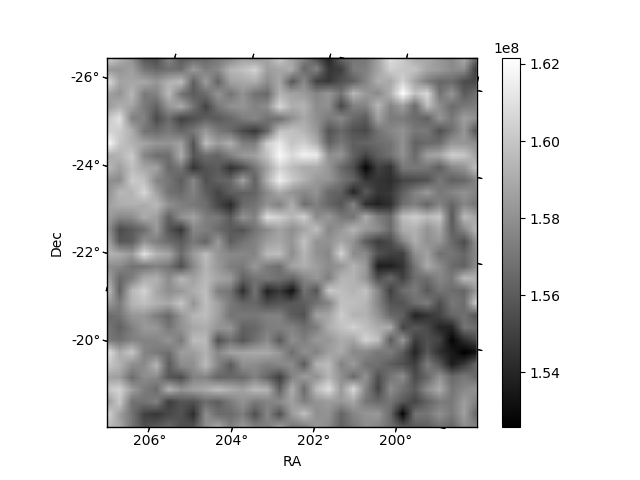
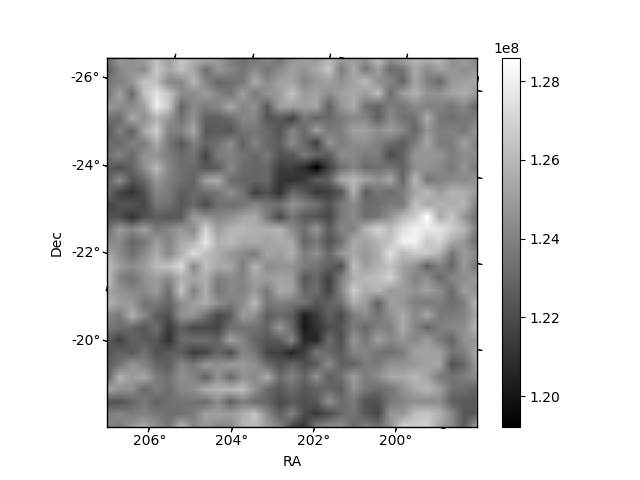
Histogram calculated using DETX and DETY for each event in the final _common_clean file
| Quadrant A | 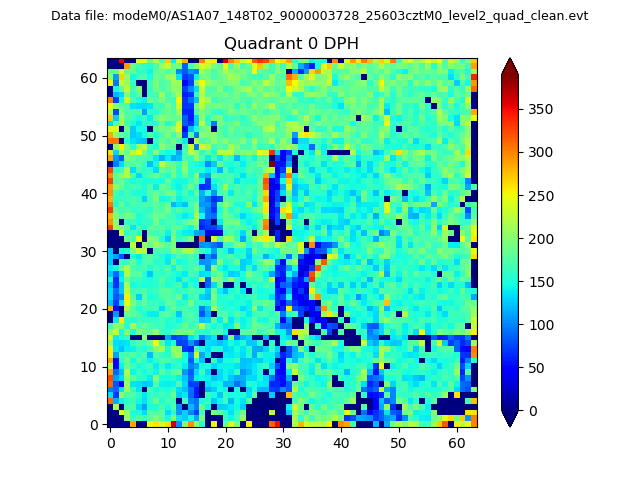 |
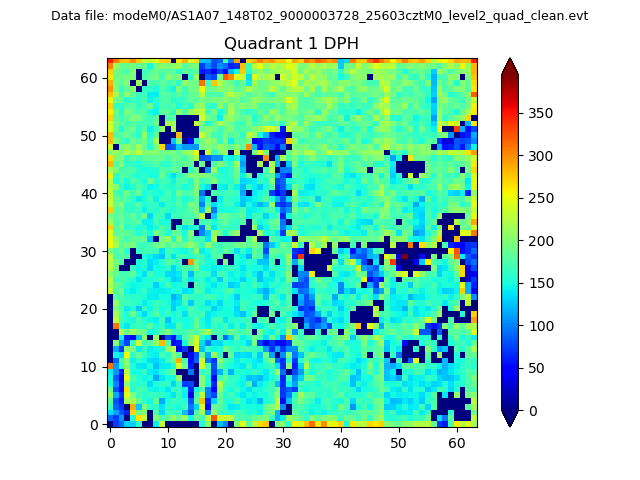 |
Quadrant B |
|---|---|---|---|
| Quadrant D | 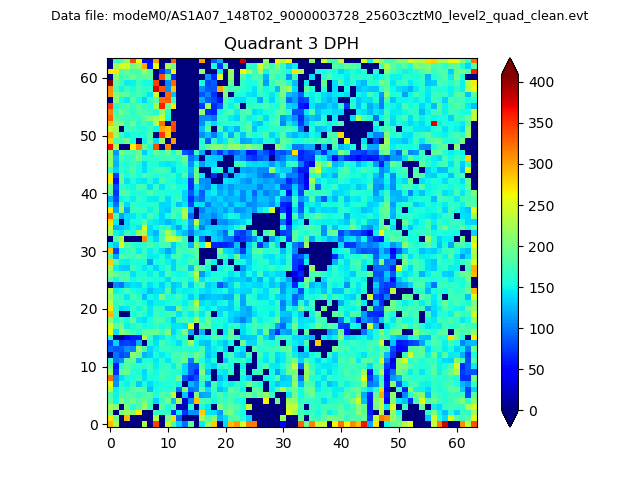 |
 |
Quadrant C |
| Plot type | Count rate plots | Images |
|---|---|---|
| Comparison with Poisson distribution Blue bars denote a histogram of data divided into 1 sec bins. Red curve is a Poisson curve with rate = median count rate of data. |
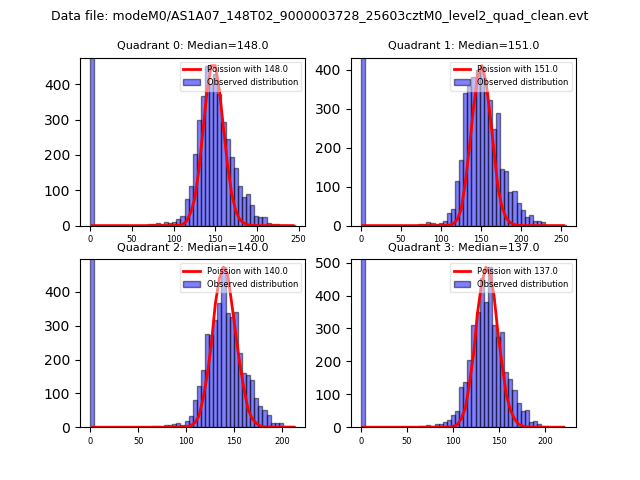 |
 |
| Quadrant-wise count rates Data is divided into 100 sec bins |
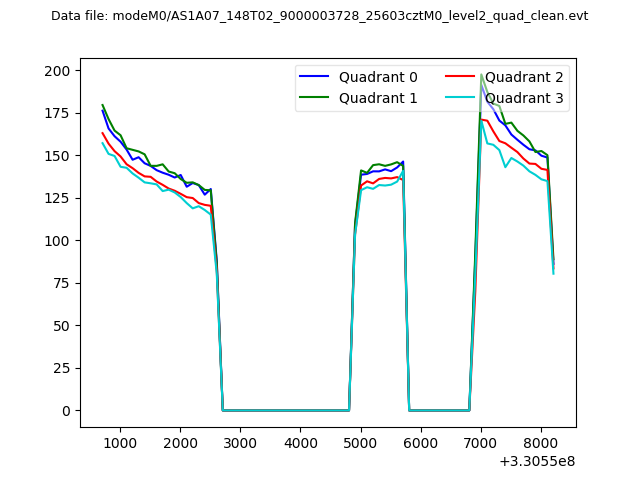 |
|
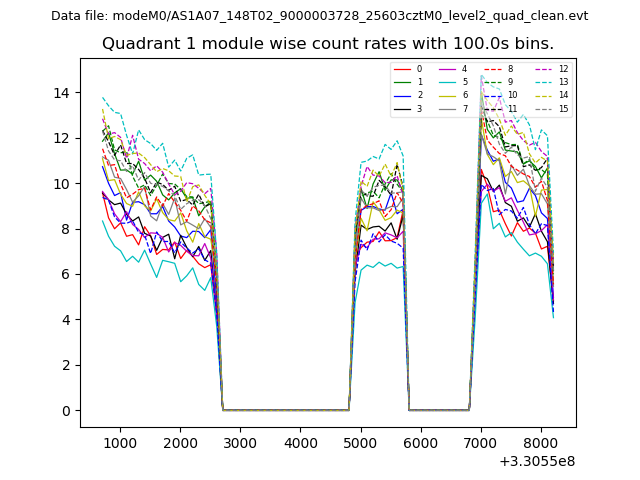
| Module-wise count rates for Quadrant A Data is divided into 100 sec bins |
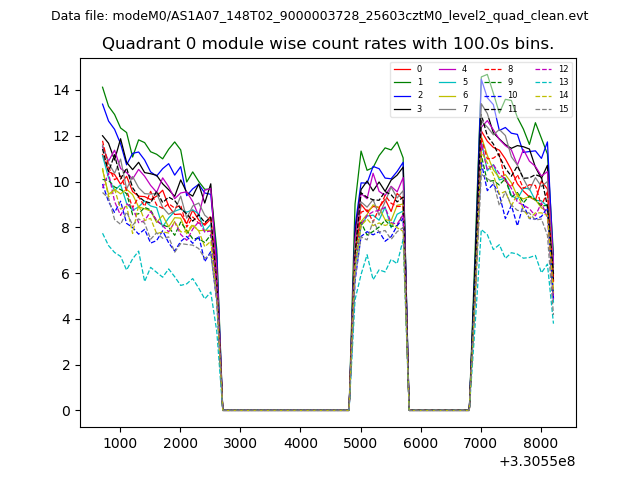 |
 |
| Module-wise count rates for Quadrant B Data is divided into 100 sec bins |
 |
 |
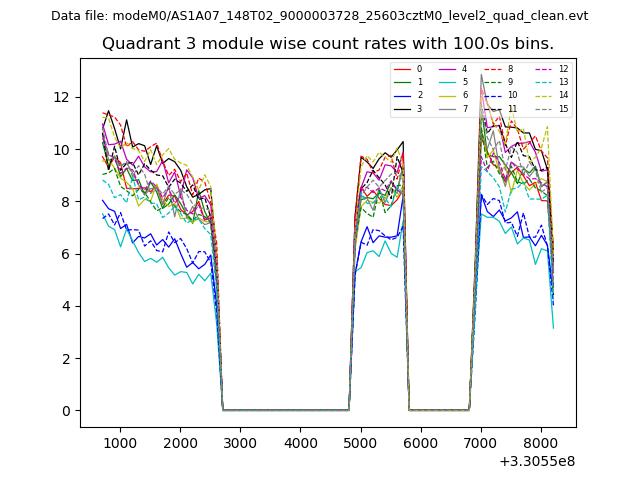
| Module-wise count rates for Quadrant C Data is divided into 100 sec bins |
 |
 |
| Module-wise count rates for Quadrant D Data is divided into 100 sec bins |
 |
 |
| Parameter | Plot |
|---|---|
| CZT HV Monitor |  |
| D_VDD | 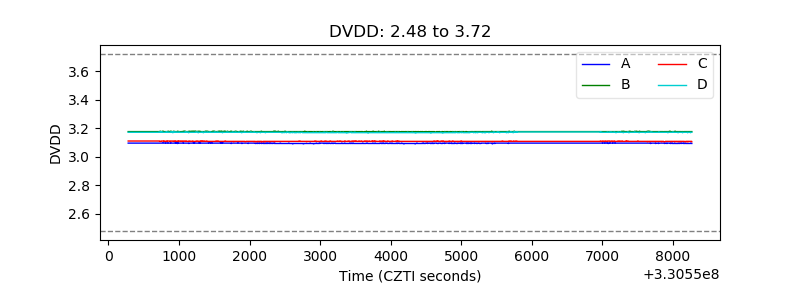 |
| Temperature 1 | 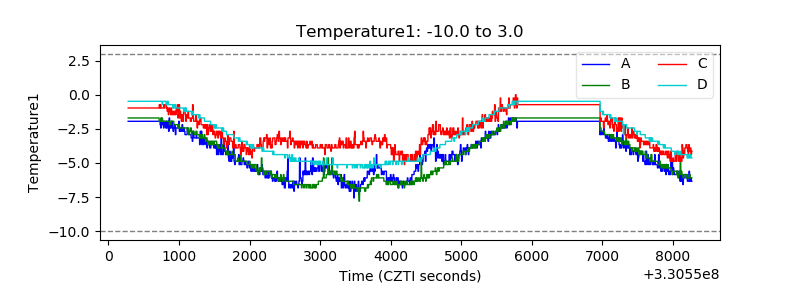 |
| Veto HV Monitor | 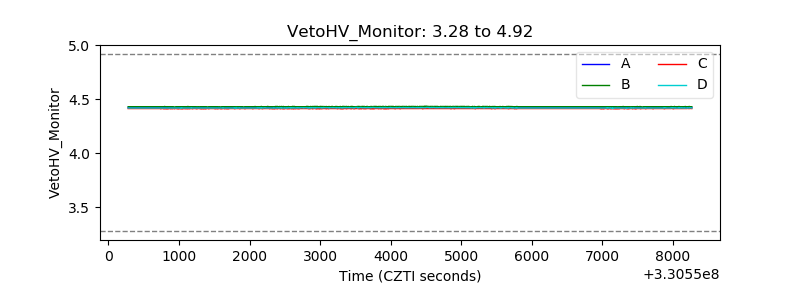 |
| Veto LLD | 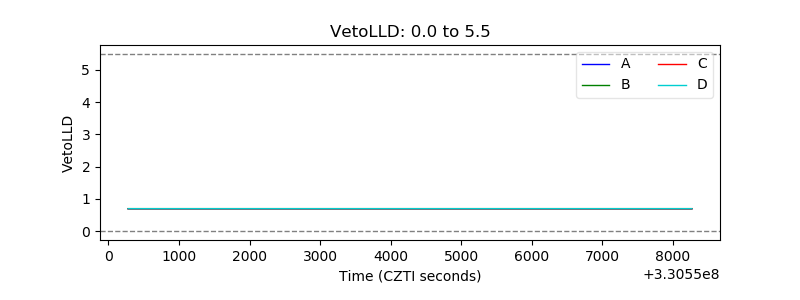 |
| Alpha Counter | 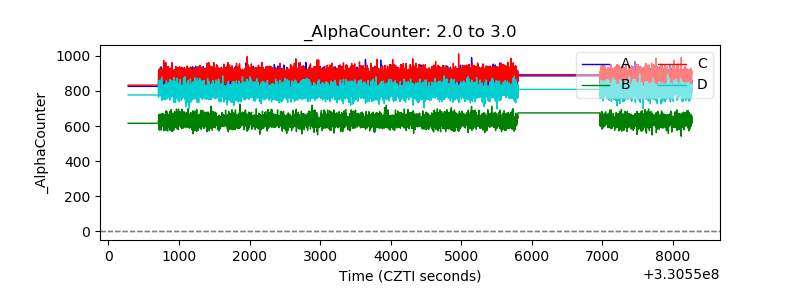 |
| _CPM_Rate | 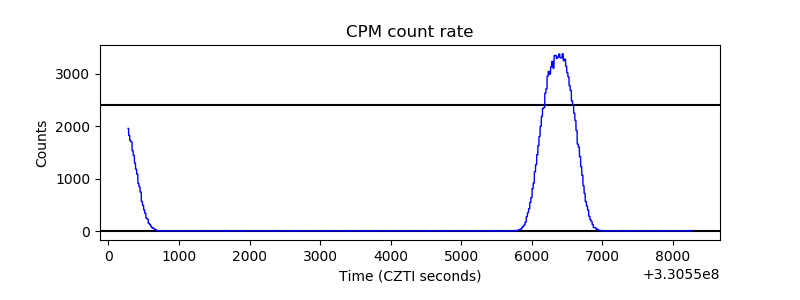 |
| CZT Counter | 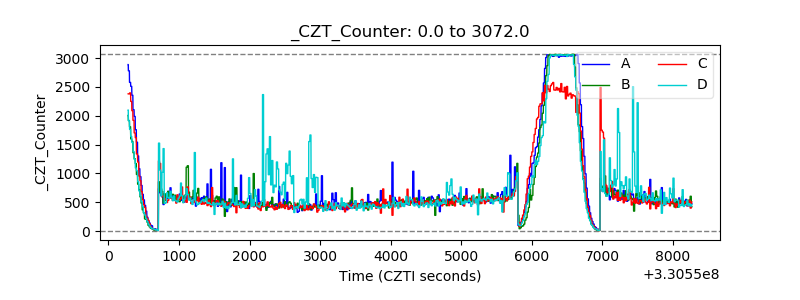 |
| +2.5 Volts monitor | 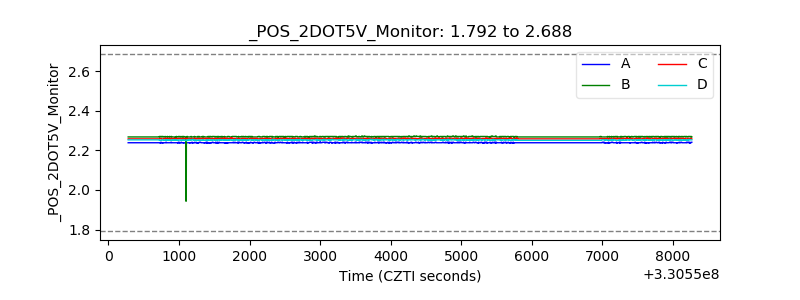 |
| +5 Volts monitor | 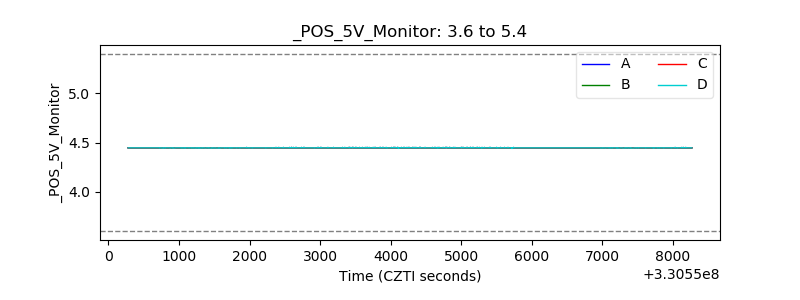 |
| _ROLL_ROT | 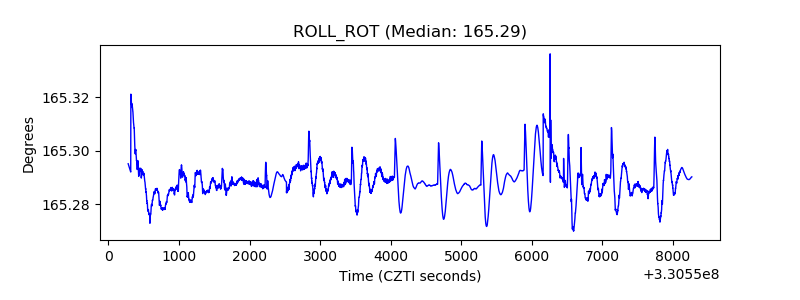 |
| _Roll_DEC | 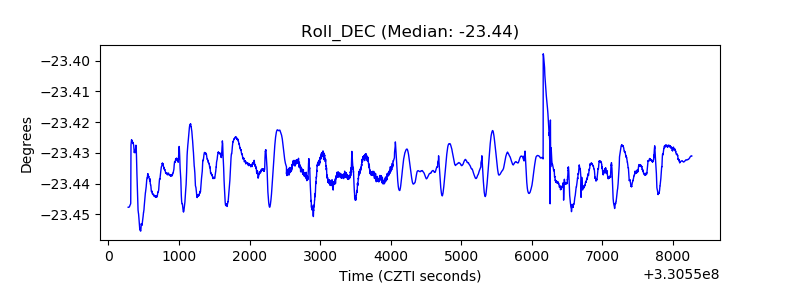 |
| _Roll_RA |  |
| Veto Counter |  |