| Param | Original file | Final file |
|---|---|---|
| Filename | modeM0/AS1A07_148T02_9000003728_25604cztM0_level2.evt | modeM0/AS1A07_148T02_9000003728_25604cztM0_level2_quad_clean.evt |
| Size (bytes) | 461,880,000 | 93,337,920 |
| Size | 440.5 MB | 89.0 MB |
| Events in quadrant A | 3,476,681 | 614,645 |
| Events in quadrant B | 3,348,800 | 636,319 |
| Events in quadrant C | 3,239,335 | 581,271 |
| Events in quadrant D | 3,503,166 | 562,416 |
| Mode M9 | |||
|---|---|---|---|
| Quadrant | BADHDUFLAG | Total packets | Discarded packets |
| A | 0 | 18 | 0 |
| B | 0 | 19 | 0 |
| C | 0 | 19 | 0 |
| D | 0 | 19 | 0 |
| Mode M0 | |||
|---|---|---|---|
| Quadrant | BADHDUFLAG | Total packets | Discarded packets |
| A | 0 | 14357 | 0 |
| B | 0 | 13705 | 0 |
| C | 0 | 13296 | 0 |
| D | 0 | 14345 | 0 |
| Quadrant | Total seconds | Saturated seconds | Saturation percentage |
|---|---|---|---|
| A | 6188 | 25 | 0.404008% |
| B | 6188 | 22 | 0.355527% |
| C | 6188 | 73 | 1.179703% |
| D | 6188 | 44 | 0.711054% |
Noise dominated data is calculated using 1-second bins in cleaned event files. If a bin has >2000 counts, and if more than 50% of those come from <1% of pixels, then it is considered to be noise-dominated and hence unusable.
| Quadrant | # 1 sec bins | Bins with >0 counts | Bins with >2000 counts | High rate bins dominated by noise | Noise dominated (total time) | Noise dominated (detector-on time) | Marked lightcurve |
|---|---|---|---|---|---|---|---|
| A | 7493 | 6189 | 7 | 7 | 0.09% | 0.11% | 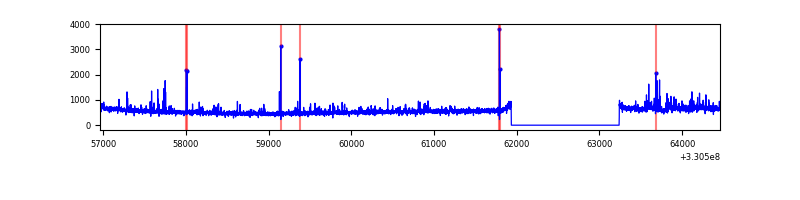 |
| B | 7493 | 6189 | 0 | 0 | 0.00% | 0.00% | 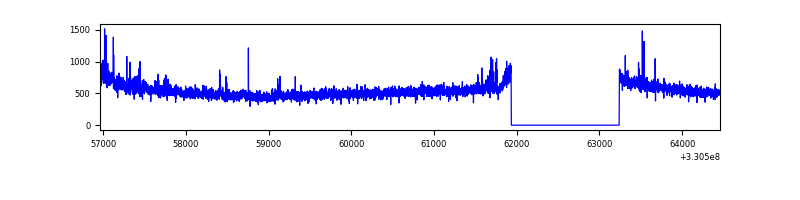 |
| C | 7493 | 6189 | 10 | 10 | 0.13% | 0.16% | 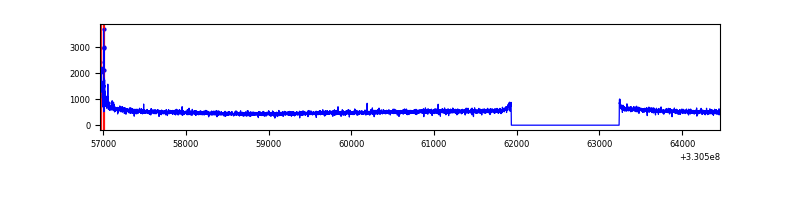 |
| D | 7493 | 6189 | 27 | 27 | 0.36% | 0.44% | 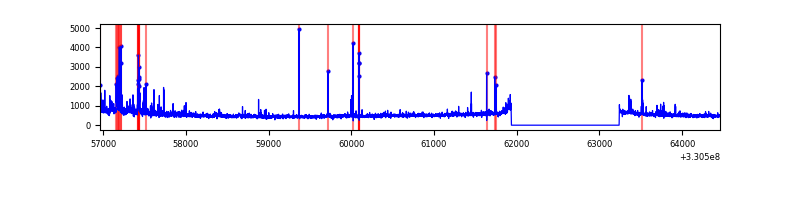 |
Top three noisy pixels from each quadrant. If the there are fewer than three noisy pixels in the level2.evt file, extra rows are filled as -1
| Pixel properties | Quadrant properties | ||||||
|---|---|---|---|---|---|---|---|
| Quadrant | DetID | PixID | Counts | Sigma | Mean | Median | Sigma |
| A | 8 | 192 | 168112 | 1012.22 | 824 | 811 | 165.3 |
| A | 6 | 16 | 128431 | 772.14 | 824 | 811 | 165.3 |
| A | 13 | 254 | 10356 | 57.75 | 824 | 811 | 165.3 |
| B | 0 | 219 | 68364 | 436.12 | 826 | 809 | 154.9 |
| B | 0 | 245 | 23296 | 145.17 | 826 | 809 | 154.9 |
| B | 12 | 111 | 18203 | 112.29 | 826 | 809 | 154.9 |
| C | 14 | 238 | 126456 | 694.85 | 777 | 782 | 180.9 |
| C | 3 | 233 | 71568 | 391.37 | 777 | 782 | 180.9 |
| C | 0 | 207 | 14644 | 76.64 | 777 | 782 | 180.9 |
| D | 1 | 52 | 271367 | 1437.05 | 778 | 757 | 188.3 |
| D | 8 | 195 | 115293 | 608.23 | 778 | 757 | 188.3 |
| D | 2 | 153 | 40036 | 208.59 | 778 | 757 | 188.3 |
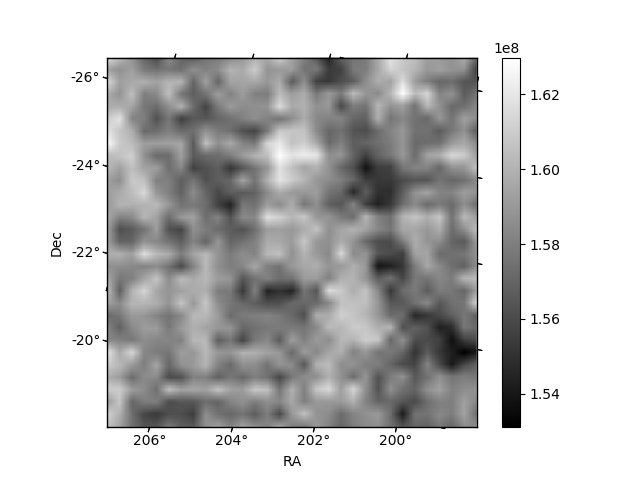
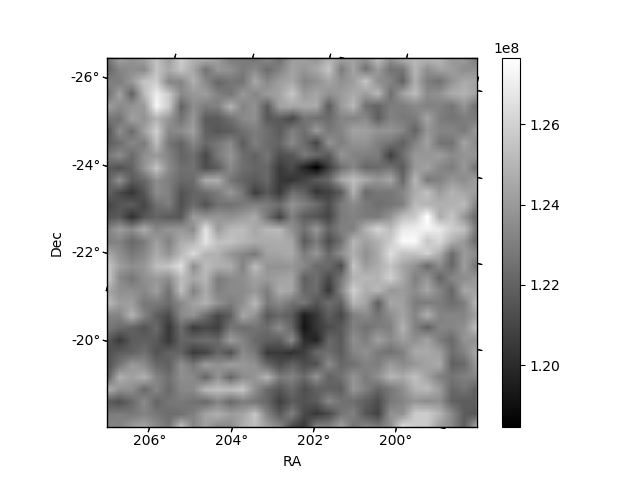
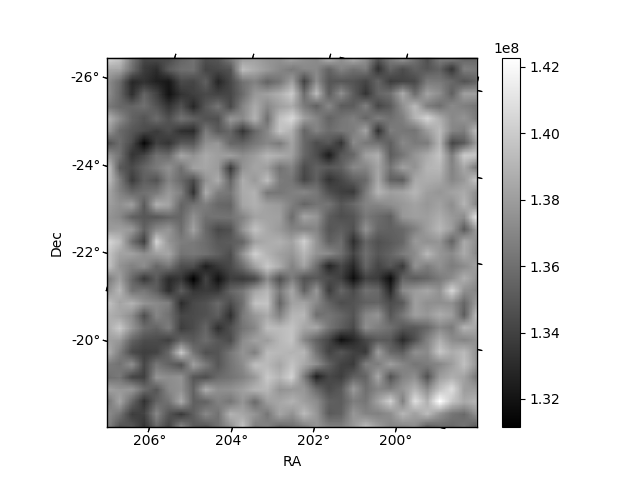
Histogram calculated using DETX and DETY for each event in the final _common_clean file
| Quadrant A | 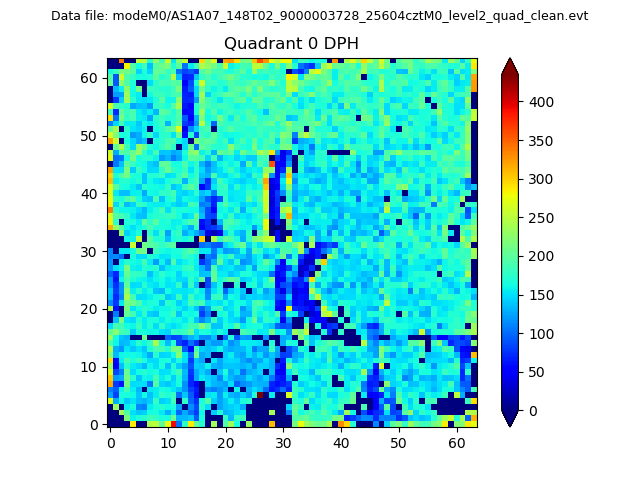 |
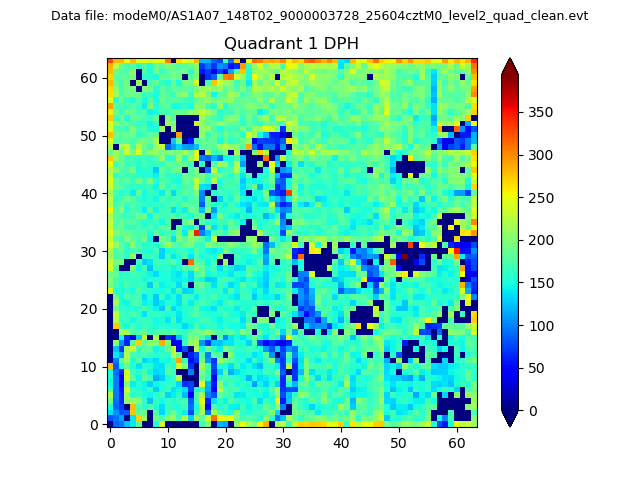 |
Quadrant B |
|---|---|---|---|
| Quadrant D | 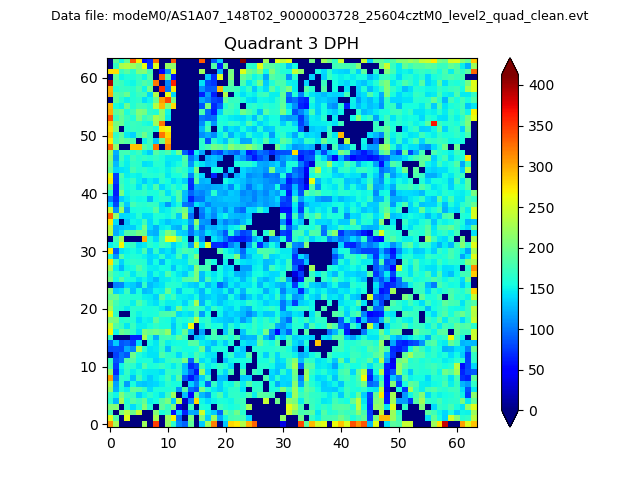 |
 |
Quadrant C |
| Plot type | Count rate plots | Images |
|---|---|---|
| Comparison with Poisson distribution Blue bars denote a histogram of data divided into 1 sec bins. Red curve is a Poisson curve with rate = median count rate of data. |
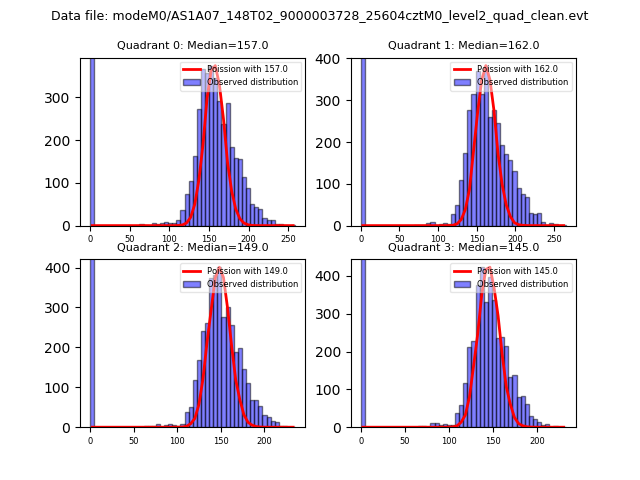 |
 |
| Quadrant-wise count rates Data is divided into 100 sec bins |
 |
|
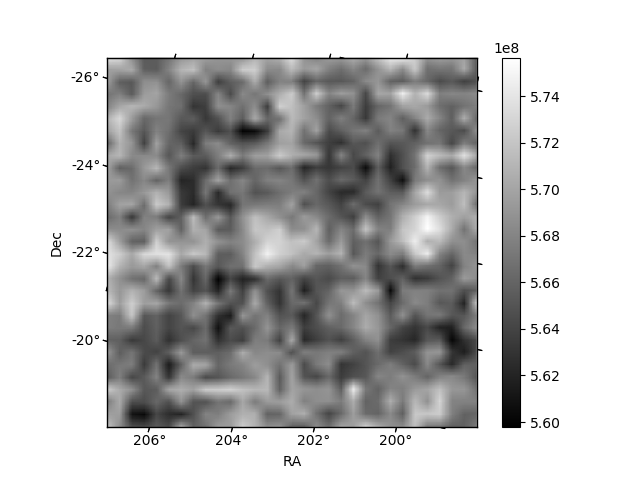
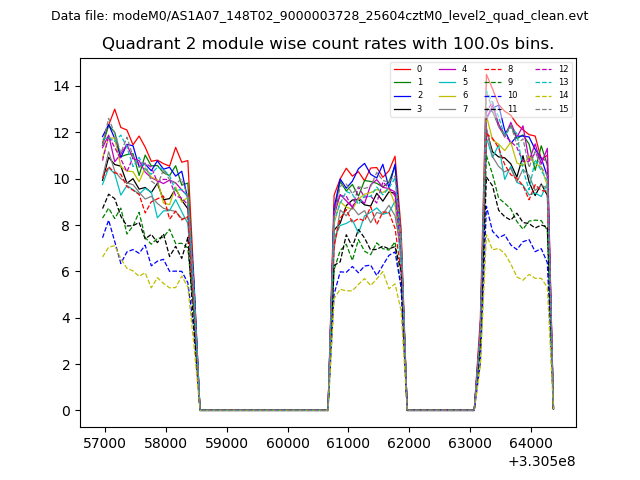
| Module-wise count rates for Quadrant A Data is divided into 100 sec bins |
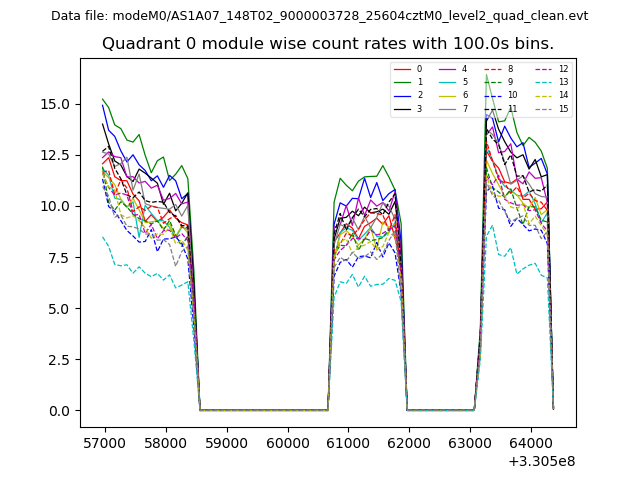 |
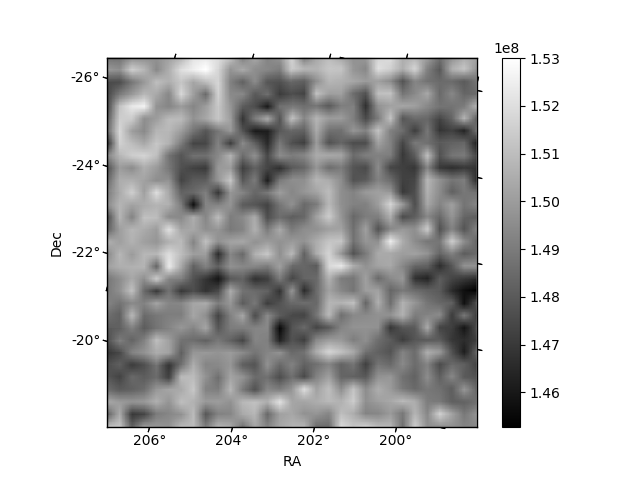 |
| Module-wise count rates for Quadrant B Data is divided into 100 sec bins |
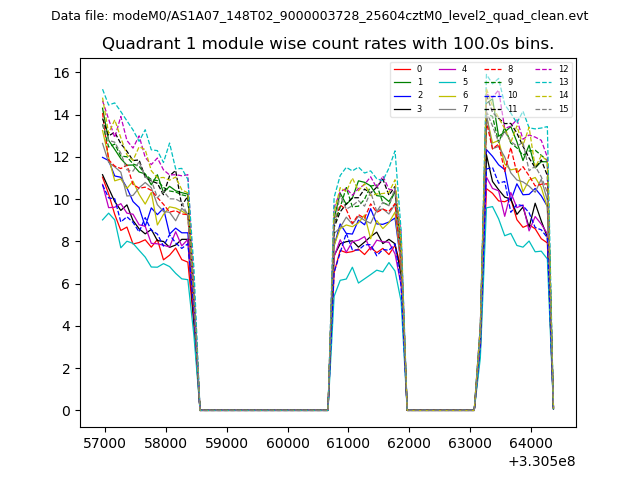 |
 |
| Module-wise count rates for Quadrant C Data is divided into 100 sec bins |
 |
 |
| Module-wise count rates for Quadrant D Data is divided into 100 sec bins |
 |
 |
| Parameter | Plot |
|---|---|
| CZT HV Monitor | 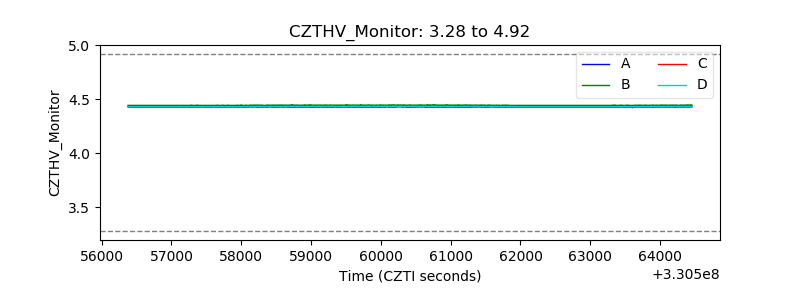 |
| D_VDD | 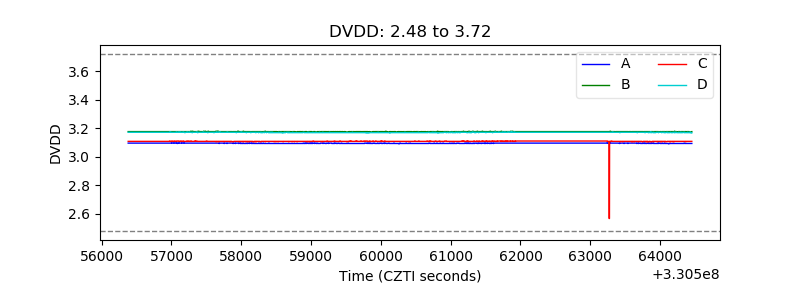 |
| Temperature 1 | 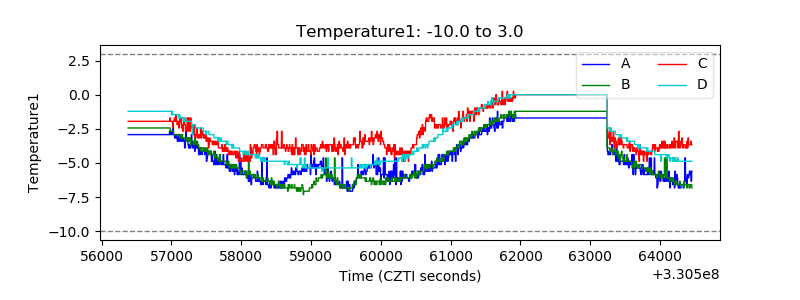 |
| Veto HV Monitor | 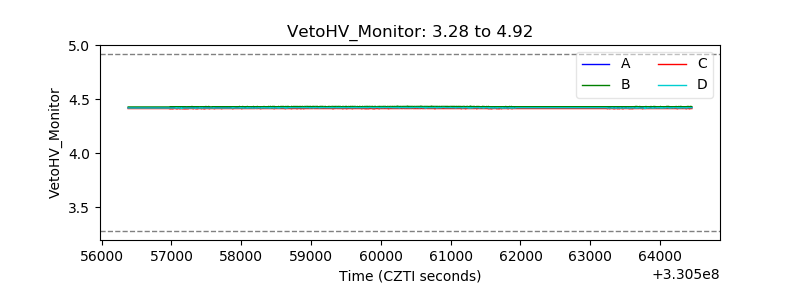 |
| Veto LLD | 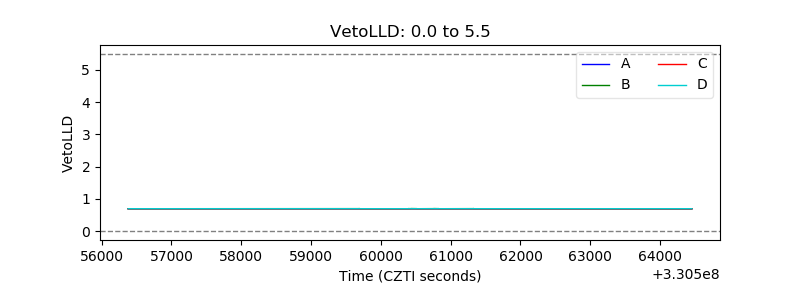 |
| Alpha Counter | 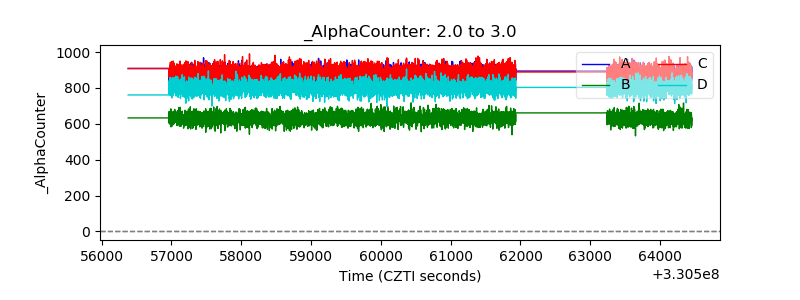 |
| _CPM_Rate | 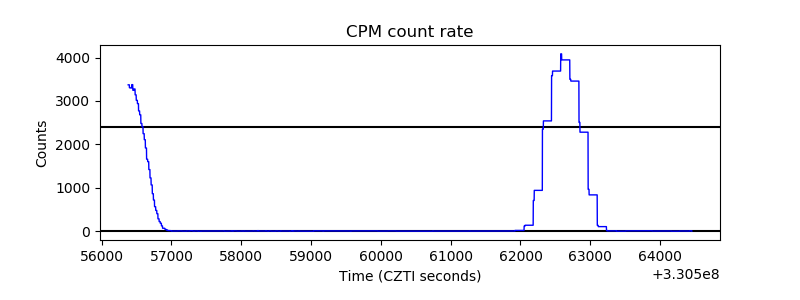 |
| CZT Counter | 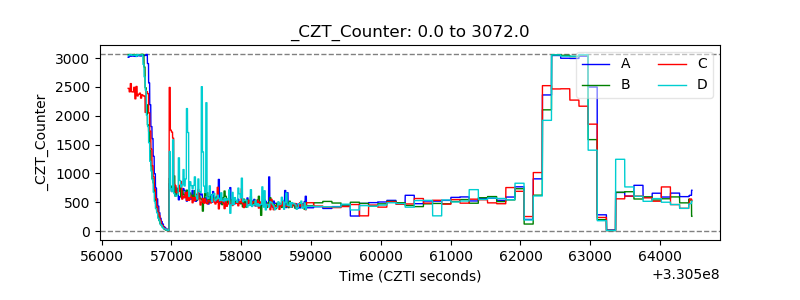 |
| +2.5 Volts monitor |  |
| +5 Volts monitor |  |
| _ROLL_ROT | 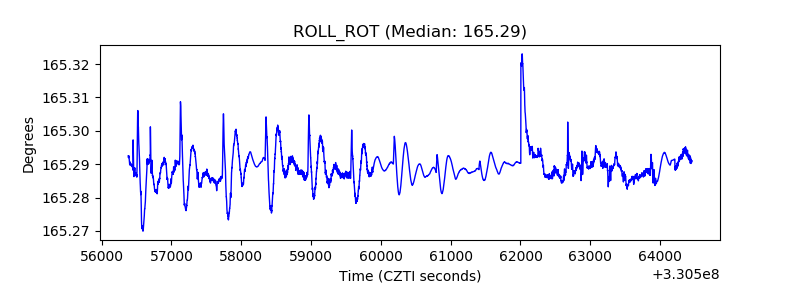 |
| _Roll_DEC | 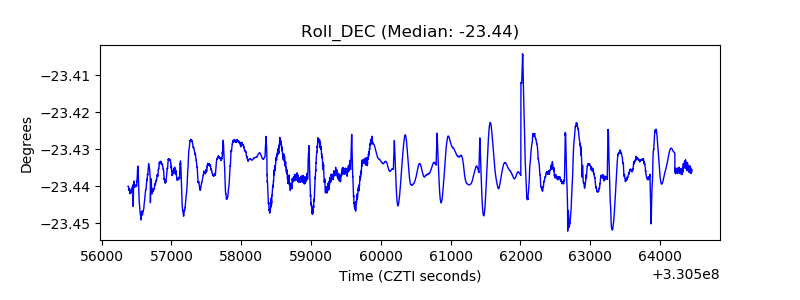 |
| _Roll_RA | 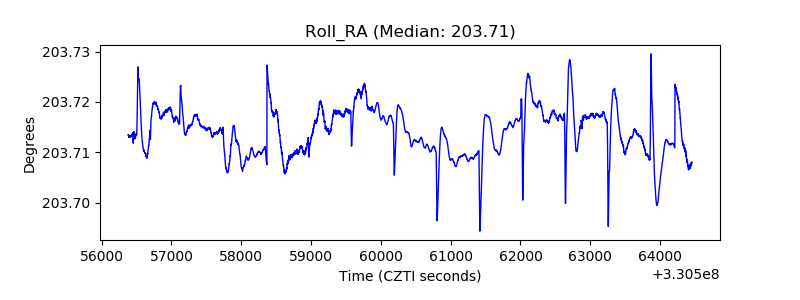 |
| Veto Counter | 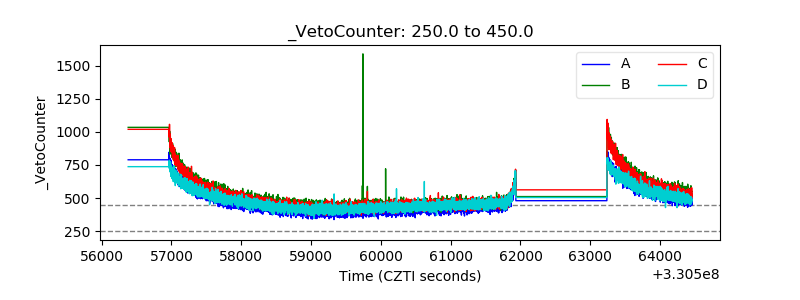 |