| Param | Original file | Final file |
|---|---|---|
| Filename | modeM0/AS1A07_148T02_9000003728_25605cztM0_level2.evt | modeM0/AS1A07_148T02_9000003728_25605cztM0_level2_quad_clean.evt |
| Size (bytes) | 497,496,960 | 86,601,600 |
| Size | 474.5 MB | 82.6 MB |
| Events in quadrant A | 4,229,236 | 560,180 |
| Events in quadrant B | 3,466,279 | 581,646 |
| Events in quadrant C | 3,325,106 | 533,903 |
| Events in quadrant D | 3,624,275 | 512,471 |
| Mode M9 | |||
|---|---|---|---|
| Quadrant | BADHDUFLAG | Total packets | Discarded packets |
| A | 0 | 25 | 0 |
| B | 0 | 26 | 0 |
| C | 0 | 26 | 0 |
| D | 0 | 26 | 0 |
| Mode M0 | |||
|---|---|---|---|
| Quadrant | BADHDUFLAG | Total packets | Discarded packets |
| A | 0 | 17446 | 0 |
| B | 0 | 13985 | 0 |
| C | 0 | 13505 | 0 |
| D | 0 | 14705 | 0 |
| Quadrant | Total seconds | Saturated seconds | Saturation percentage |
|---|---|---|---|
| A | 6225 | 44 | 0.706827% |
| B | 6225 | 53 | 0.851406% |
| C | 6225 | 58 | 0.931727% |
| D | 6225 | 67 | 1.076305% |
Noise dominated data is calculated using 1-second bins in cleaned event files. If a bin has >2000 counts, and if more than 50% of those come from <1% of pixels, then it is considered to be noise-dominated and hence unusable.
| Quadrant | # 1 sec bins | Bins with >0 counts | Bins with >2000 counts | High rate bins dominated by noise | Noise dominated (total time) | Noise dominated (detector-on time) | Marked lightcurve |
|---|---|---|---|---|---|---|---|
| A | 7565 | 6227 | 1 | 1 | 0.01% | 0.02% | 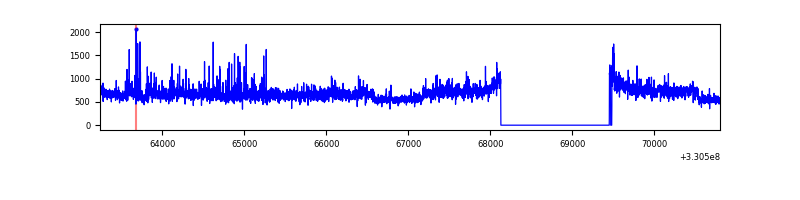 |
| B | 7565 | 6227 | 5 | 5 | 0.07% | 0.08% | 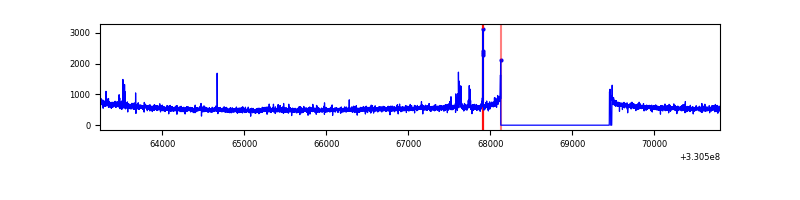 |
| C | 7565 | 6227 | 0 | 0 | 0.00% | 0.00% | 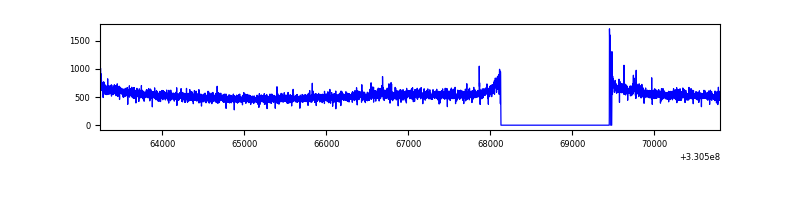 |
| D | 7565 | 6227 | 27 | 27 | 0.36% | 0.43% | 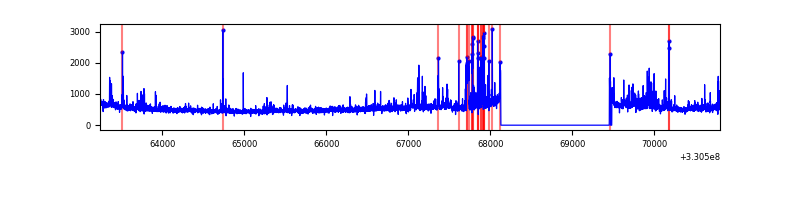 |
Top three noisy pixels from each quadrant. If the there are fewer than three noisy pixels in the level2.evt file, extra rows are filled as -1
| Pixel properties | Quadrant properties | ||||||
|---|---|---|---|---|---|---|---|
| Quadrant | DetID | PixID | Counts | Sigma | Mean | Median | Sigma |
| A | 8 | 192 | 837429 | 4926.6 | 854 | 843 | 169.8 |
| A | 6 | 16 | 77790 | 453.14 | 854 | 843 | 169.8 |
| A | 9 | 130 | 16469 | 92.02 | 854 | 843 | 169.8 |
| B | 0 | 219 | 43744 | 269.17 | 857 | 841 | 159.4 |
| B | 0 | 190 | 28114 | 171.11 | 857 | 841 | 159.4 |
| B | 5 | 171 | 20595 | 123.93 | 857 | 841 | 159.4 |
| C | 14 | 238 | 131061 | 693.74 | 809 | 817 | 187.7 |
| C | 3 | 233 | 35845 | 186.58 | 809 | 817 | 187.7 |
| C | 13 | 61 | 5686 | 25.93 | 809 | 817 | 187.7 |
| D | 1 | 52 | 348787 | 1805.71 | 805 | 785 | 192.7 |
| D | 8 | 195 | 125641 | 647.85 | 805 | 785 | 192.7 |
| D | 7 | 238 | 38931 | 197.93 | 805 | 785 | 192.7 |
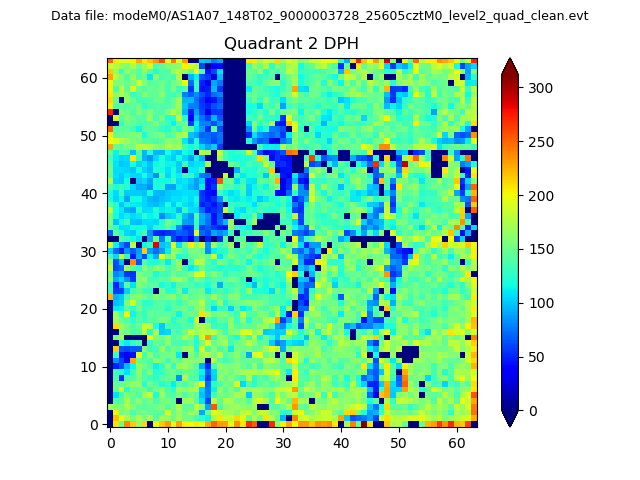
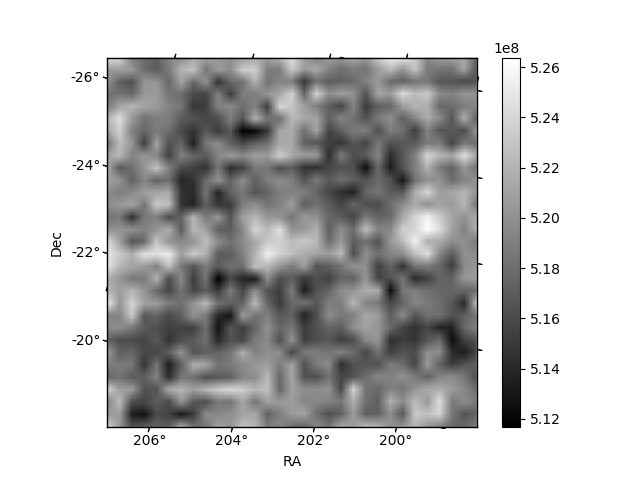
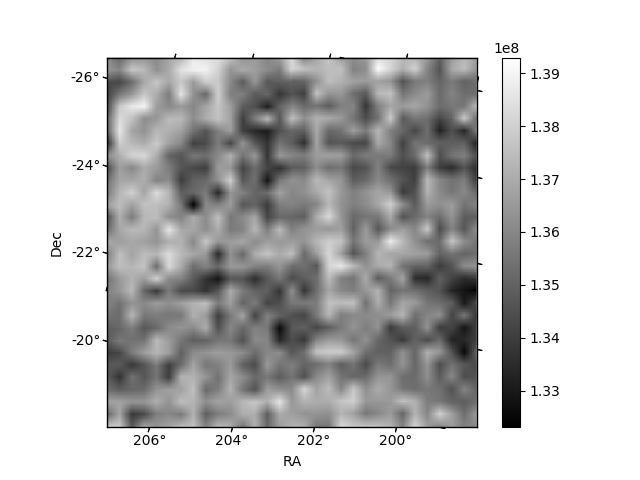
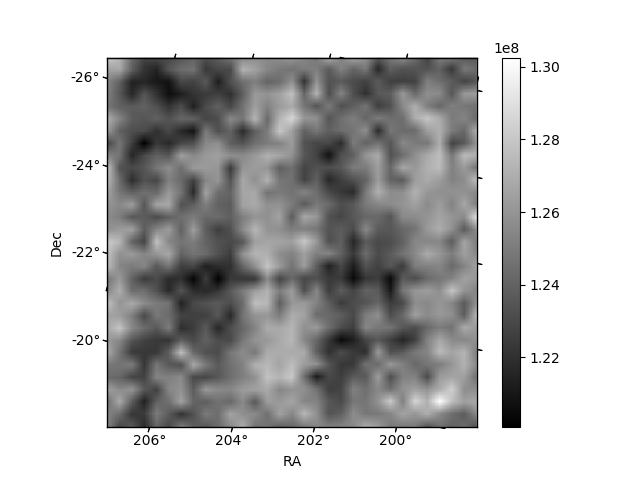
Histogram calculated using DETX and DETY for each event in the final _common_clean file
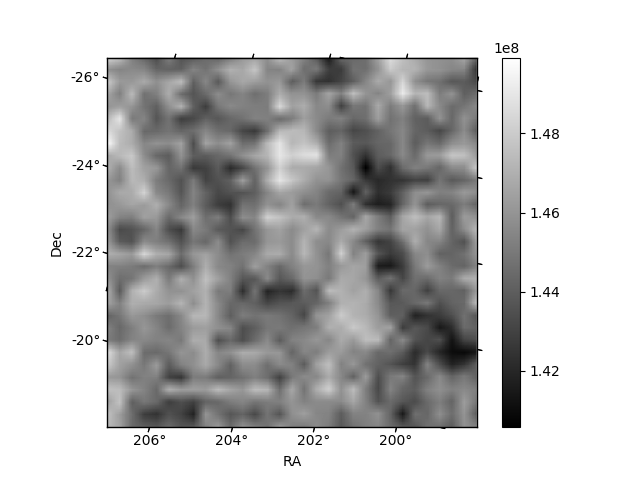
| Quadrant A | 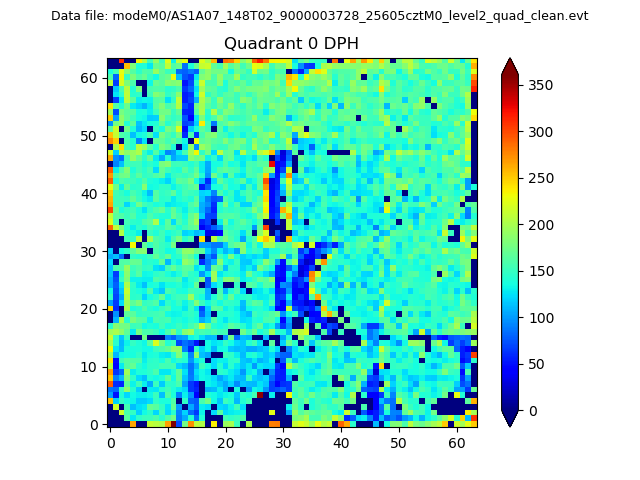 |
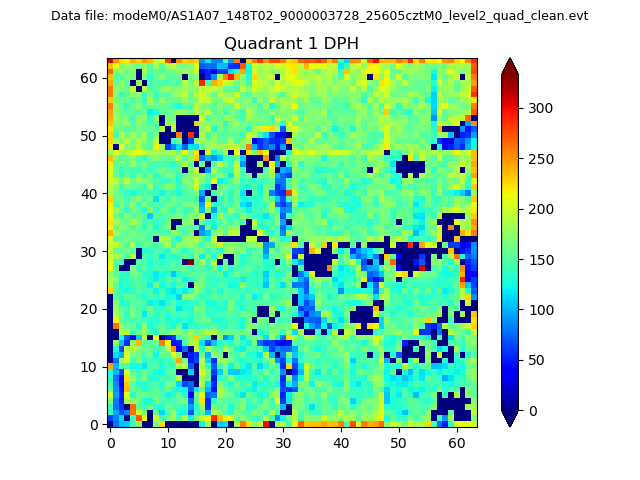 |
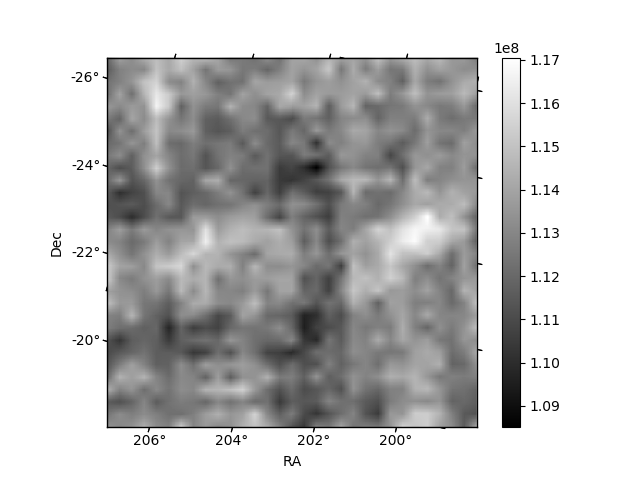
Quadrant B |
|---|---|---|---|
| Quadrant D | 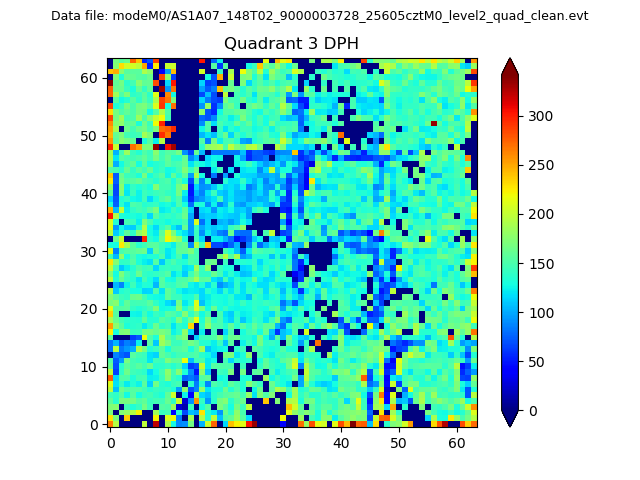 |
 |
Quadrant C |
| Plot type | Count rate plots | Images |
|---|---|---|
| Comparison with Poisson distribution Blue bars denote a histogram of data divided into 1 sec bins. Red curve is a Poisson curve with rate = median count rate of data. |
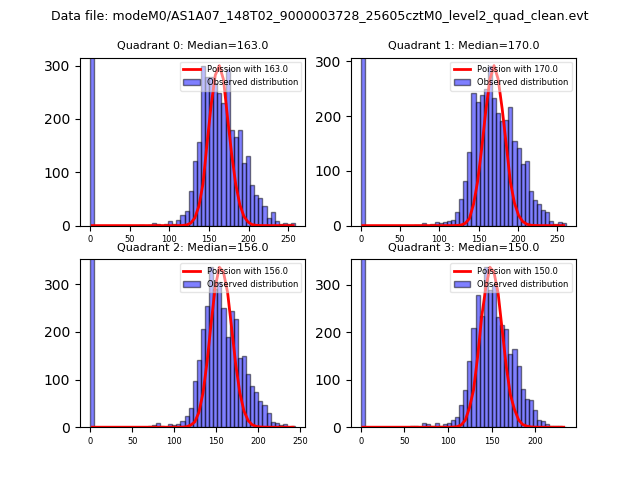 |
 |
| Quadrant-wise count rates Data is divided into 100 sec bins |
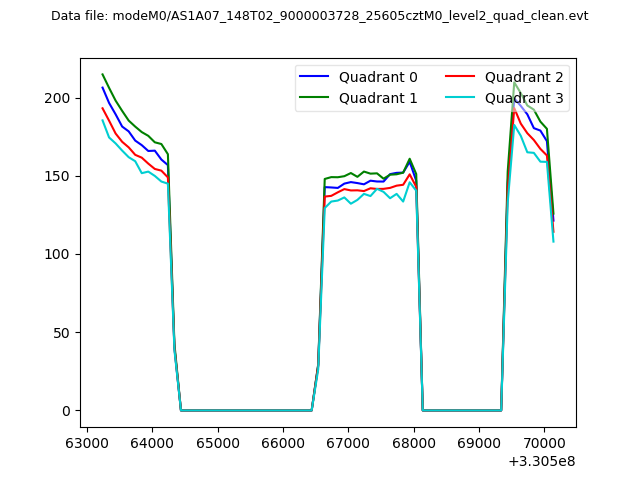 |
|
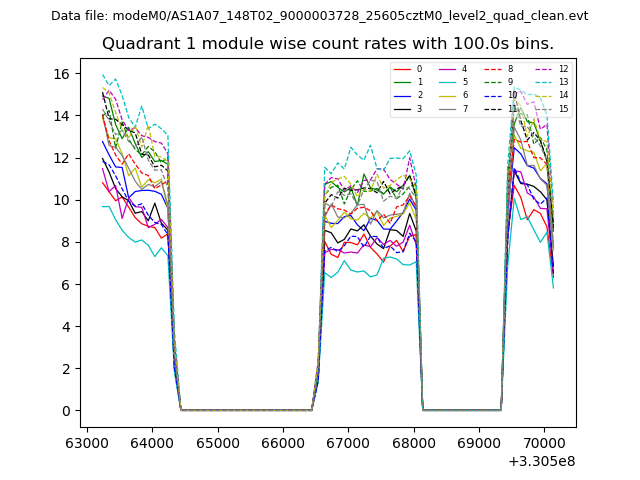
| Module-wise count rates for Quadrant A Data is divided into 100 sec bins |
 |
 |
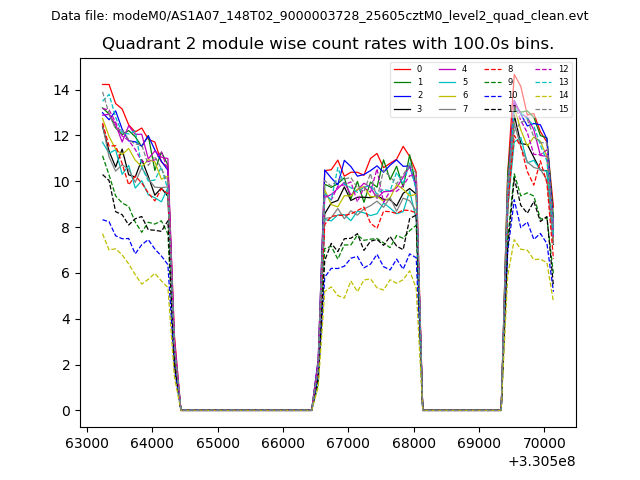
| Module-wise count rates for Quadrant B Data is divided into 100 sec bins |
 |
 |
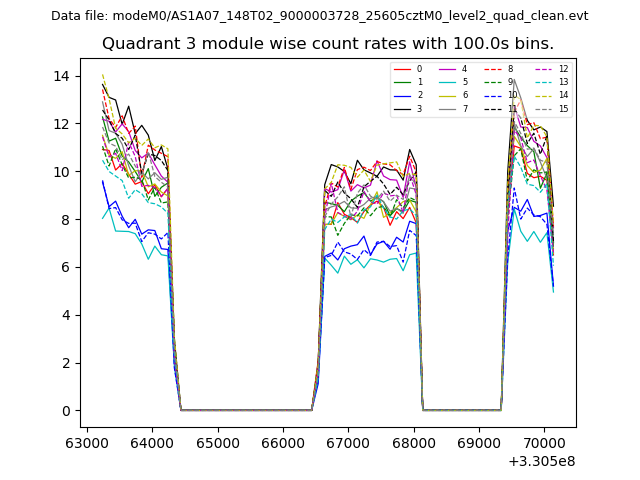
| Module-wise count rates for Quadrant C Data is divided into 100 sec bins |
 |
 |
| Module-wise count rates for Quadrant D Data is divided into 100 sec bins |
 |
 |
| Parameter | Plot |
|---|---|
| CZT HV Monitor | 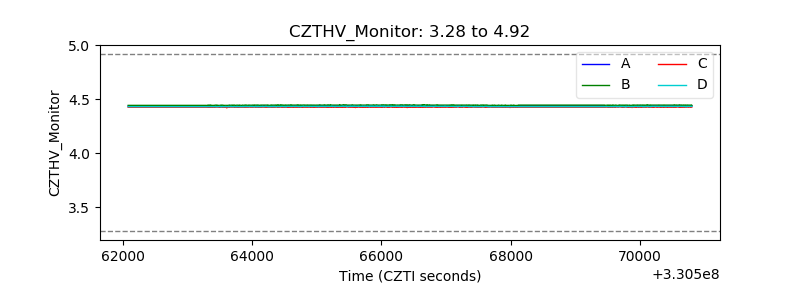 |
| D_VDD | 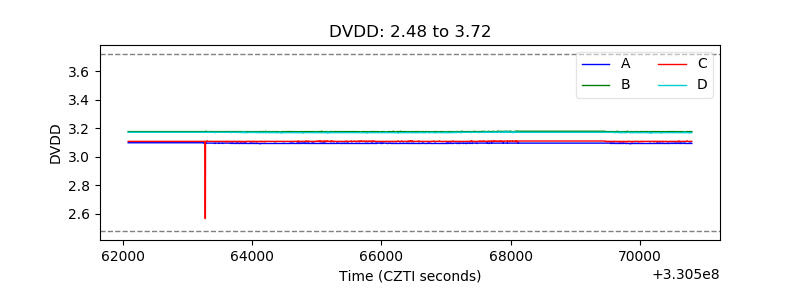 |
| Temperature 1 | 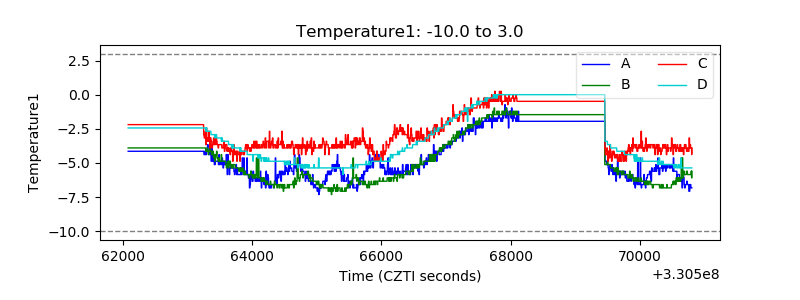 |
| Veto HV Monitor | 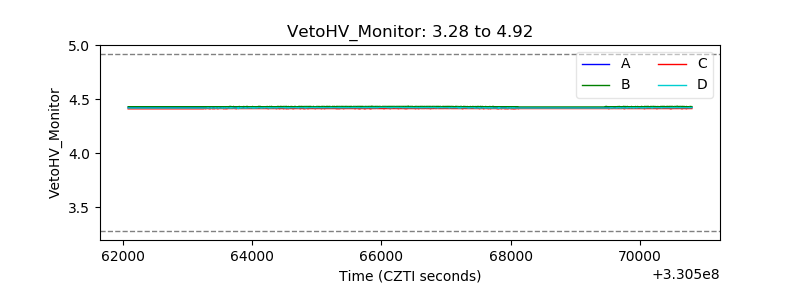 |
| Veto LLD | 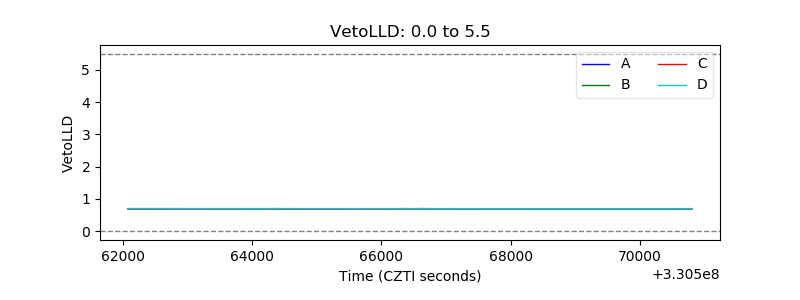 |
| Alpha Counter | 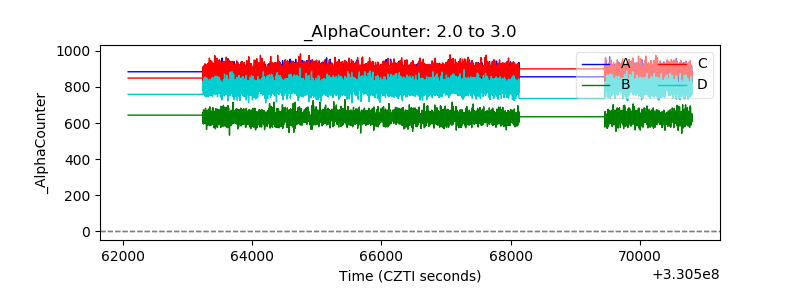 |
| _CPM_Rate |  |
| CZT Counter | 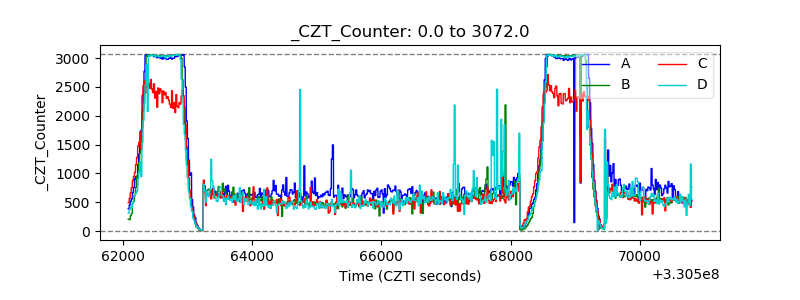 |
| +2.5 Volts monitor |  |
| +5 Volts monitor |  |
| _ROLL_ROT | 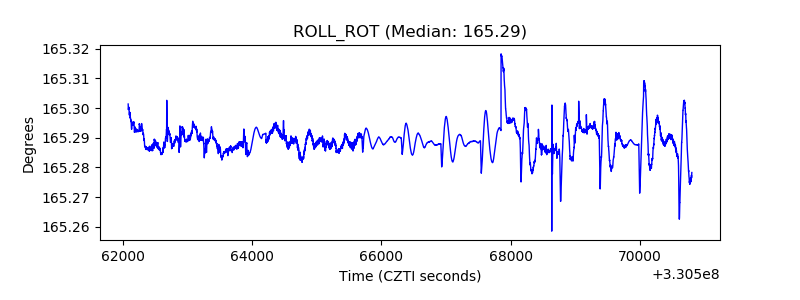 |
| _Roll_DEC | 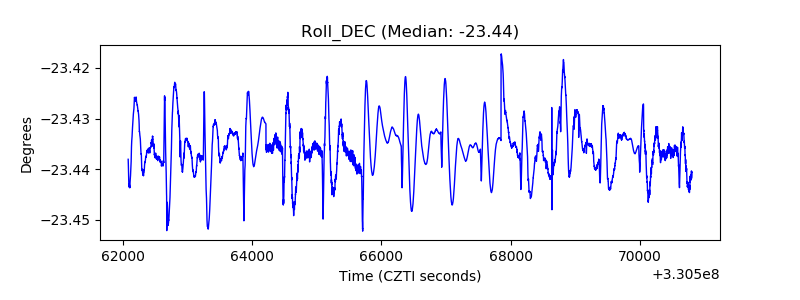 |
| _Roll_RA | 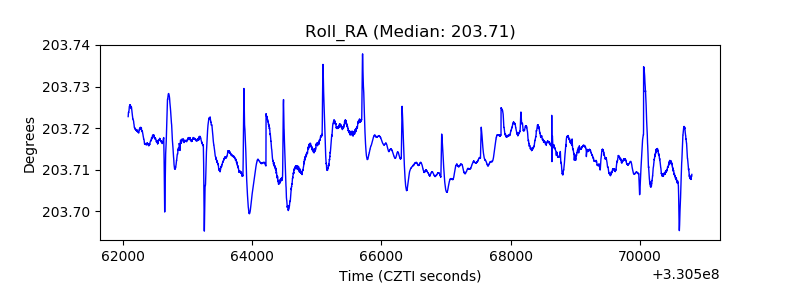 |
| Veto Counter | 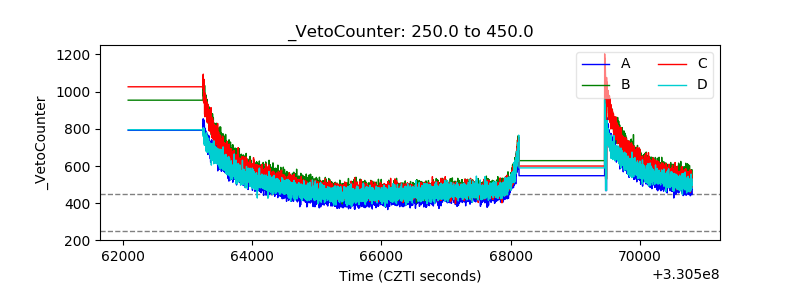 |